瞭解如何建立可搜尋的追蹤、有效地查詢追蹤,以及分析結果,以深入瞭解 GenAI 應用程式的行為。
快速參考
基本搜尋語法
# Search by status
mlflow.search_traces("attributes.status = 'OK'")
mlflow.search_traces("attributes.status = 'ERROR'")

# Search by time (milliseconds since epoch)
mlflow.search_traces("attributes.timestamp_ms > 1749006880539")
mlflow.search_traces("attributes.execution_time_ms > 5000")

# Search by tags
mlflow.search_traces("tags.environment = 'production'")
mlflow.search_traces("tags.`mlflow.traceName` = 'my_function'")

# Search by metadata
mlflow.search_traces("metadata.`mlflow.user` = 'alice@company.com'")

# Combined filters (AND only)
mlflow.search_traces(
    "attributes.status = 'OK' AND tags.environment = 'production'"
)
金鑰規則
-
一律使用前置詞:
attributes.、tags.、 或metadata. - 如果標籤或屬性名稱中有句點,請使用反引號:
-
僅限單引號:
'value'不是"value" -
時間的毫秒:
1749006880539不是日期 - 僅限 AND:不支援 OR
可搜尋的欄位
| 領域 | 路徑 | 運營商 |
|---|---|---|
| 地位 | attributes.status |
=、!= |
| 時間戳 | attributes.timestamp_ms |
=、<、<=、>、>= |
| 持續時間 | attributes.execution_time_ms |
=、<、<=、>、>= |
| 標籤 | tags.* |
=、!= |
| 後設資料 | metadata.* |
=、!= |
端對端範例
備註:先決條件
安裝 MLflow 和必要套件
pip install --upgrade "mlflow[databricks]>=3.1.0" openai "databricks-connect>=16.1"按照 設定環境的快速入門指南,來建立 MLflow 實驗。 :::
建立範例追蹤以示範搜尋功能:
import time
import mlflow

# Define methods to be traced
@mlflow.trace()
def morning_greeting(name: str):
    time.sleep(1)
    # Add tag and metadata for better categorization
    mlflow.update_current_trace(
        tags={"person": name},
    )
    return f"Good morning {name}."


@mlflow.trace()
def evening_greeting(name: str):
    time.sleep(1)
    # Add tag with different values for comparison
    mlflow.update_current_trace(
        tags={"person": name},
    )
    return f"Good evening {name}."

@mlflow.trace()
def goodbye():
    # Add tag even for functions that might fail
    mlflow.update_current_trace(
        tags={"greeting_type": "goodbye"},
    )
    raise Exception("Cannot say goodbye")


# Execute the methods
morning_greeting("Tom")

# Get the timestamp in milliseconds
morning_time = int(time.time() * 1000)

evening_greeting("Mary")

# Execute goodbye, catching the exception
try:
    goodbye()
except Exception as e:
    print(f"Caught expected exception: {e}")
    pass
上述程式代碼會建立下列追蹤:
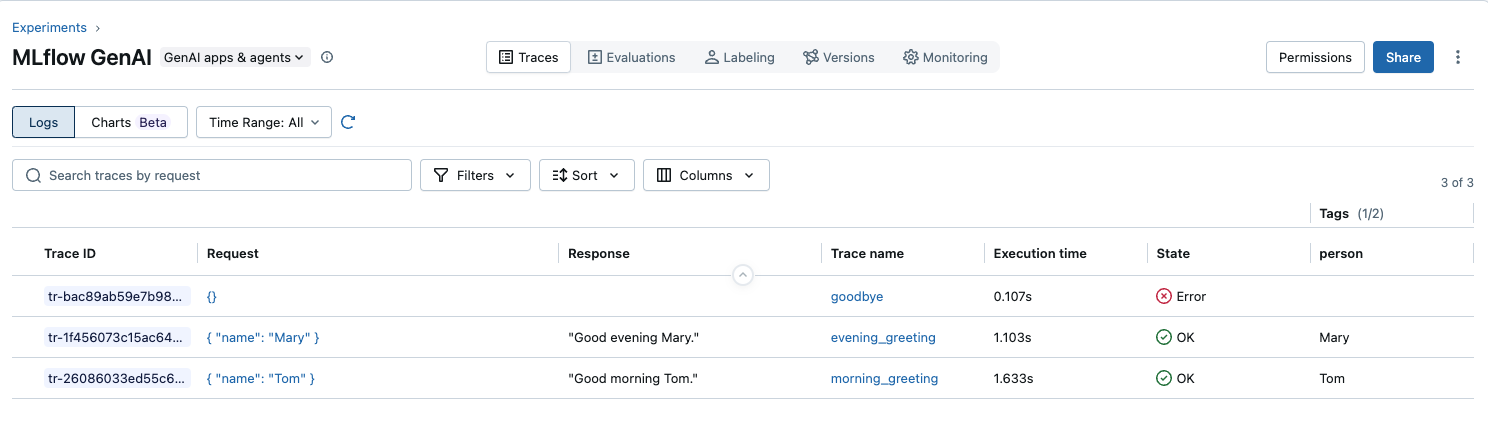
使用正確的欄位前置詞搜尋這些痕跡。
# Search successful traces
traces = mlflow.search_traces(
    filter_string="attributes.status = 'OK'",
)
print(traces)
# 2 results

# Search failed traces
traces = mlflow.search_traces(
    filter_string="attributes.status = 'ERROR'",
)
print(traces)
# 1 result

# Search all traces in experiment
traces = mlflow.search_traces()
print(traces)
# 3 results

# Search by single tag
traces = mlflow.search_traces(filter_string="tags.person = 'Tom'")
print(traces)
# 1 result

# Complex search combining tags and status
traces = mlflow.search_traces(
    filter_string="tags.person = 'Tom' AND attributes.status = 'OK'"
)
print(traces)
# 1 result

# Search by timestamp
traces = mlflow.search_traces(filter_string=f"attributes.timestamp > {morning_time}")
print(traces)
# 1 result
API 參考資料
搜尋 API
使用 mlflow.search_traces() 搜尋和分析實驗中的蹤跡。
mlflow.search_traces(
    experiment_ids: Optional[List[str]] = None,          # Uses active experiment if not specified
    filter_string: Optional[str] = None,
    max_results: Optional[int] = None,
    order_by: Optional[List[str]] = None,
    extract_fields: Optional[List[str]] = None,          # DataFrame column extraction (pandas only)
    run_id: Optional[str] = None,                        # Filter traces by run ID
    return_type: Optional[Literal["pandas", "list"]] = None,  # Return type (default: pandas if available)
    model_id: Optional[str] = None,                      # Search traces by model ID
    sql_warehouse_id: Optional[str] = None               # Databricks SQL warehouse ID
) -> Union[pandas.DataFrame, List[Trace]]
參數詳細資料:
| 參數 | 說明 |
|---|---|
experiment_ids |
限定搜尋範圍的實驗 ID 清單。 如果未提供,則會在當前活躍的實驗中執行搜尋。 |
filter_string |
搜尋篩選字串。 |
max_results |
所希望的追蹤數目上限。 如果為 None,則會傳回符合搜尋表示式的所有追蹤。 |
order_by |
order_by 子句清單。 |
extract_fields |
使用格式 "span_name.[inputs\|outputs].field_name" 或 "span_name.[inputs\|outputs]" 指定要從追蹤中擷取的欄位。 |
run_id |
用來限定搜尋範圍的執行標識碼。 在活動執行中建立追蹤時,該追蹤會與執行相關聯,您可以根據執行 ID 過濾來擷取追蹤。 請參閱下列範例,以瞭解如何依執行標識符篩選追蹤。 |
return_type |
傳回值的型別。 支援下列傳回型別。 如果已安裝 pandas 連結庫,則預設傳回類型為 「pandas」。 否則,預設傳回類型為 「list」: • "pandas":傳回 Pandas DataFrame,其中包含追蹤的相關信息,其中每個數據列代表單一追蹤,而每個數據行都代表追蹤的字段,例如trace_id、範圍等。• "list": 傳回 :p y:class:Trace <mlflow.entities.Trace> 物件的清單。 |
model_id |
如有指定,搜索與指定模型 ID 相關聯的追蹤。 |
備註
MLflow 也提供 MlflowClient.search_traces()。 不過,我們建議使用 mlflow.search_traces() - 除了分頁支援之外,它也提供功能超集,其中包含更方便的預設值和其他功能,例如 DataFrame 輸出和字段擷取。
可搜尋的欄位參考
這很重要
如需這些欄位的完整參考,請參閱 追蹤數據模型。
| 欄位類型 | 搜尋路徑 | 運營商 | 價值觀 | 註釋 |
|---|---|---|---|---|
| 中繼資料 | metadata.* |
=、!= |
請參閱下方的詳細數據 | 僅適用於字串相等 |
| 標籤 | tags.* |
=、!= |
請參閱下方的詳細數據 | 僅適用於字串相等 |
| 狀態 | attributes.status |
=、!= |
OK、ERROR、IN_PROGRESS |
僅適用於字串相等 |
| 名稱 | attributes.name |
=、!= |
追蹤名稱 | 僅適用於字串相等 |
| 時間戳 | attributes.timestamp_ms |
=、<、<=、>、>= |
建立時間 (自 epoch 以來的毫秒) | 數值比較 |
| 執行時間 | attributes.execution_time_ms |
=、<、<=、>、>= |
持續時間 (毫秒) | 數值比較 |
元數據詳情
以下中繼資料欄位可用於篩選:
-
metadata.mlflow.traceInputs:要求內容 -
metadata.mlflow.traceOutputs:回應內容 -
metadata.mlflow.sourceRun:來源執行標識碼 -
metadata.mlflow.modelId:模型標識碼 -
metadata.mlflow.trace.sizeBytes:以位元組為單位的追蹤大小 -
metadata.mlflow.trace.tokenUsage:匯總令牌使用資訊 (JSON 字串) -
metadata.mlflow.trace.user:應用程式要求的使用者識別碼/名稱 -
metadata.mlflow.trace.session:應用程式要求的會話標識碼
標記詳細數據
除了使用者定義的標記之外,還有下列系統定義的標籤可供使用:
-
mlflow.traceName:追蹤的名稱 -
eval.requestId:由mlflow.genai.evaluate()設定的評估要求標識碼
篩選語法規則
-
所需的資料表前綴:一律使用
attributes.、tags.或metadata. -
點的反引號:含有點 (dot) 的欄位需要使用反引號:
tags.`mlflow.traceName` -
僅限單引號:字串值必須使用單引號:
'value' - 區分大小寫:所有欄位名稱和值皆區分大小寫
- 僅限 AND:不支援 OR 運算元
依語法排序
# Single field ordering
order_by=["attributes.timestamp_ms DESC"]
order_by=["attributes.execution_time_ms ASC"]

# Multiple field ordering (applied in sequence)
order_by=[
    "attributes.timestamp_ms DESC",
    "attributes.execution_time_ms ASC"
]

# Supported fields for ordering
# - attributes.timestamp_ms (and aliases)
# - attributes.execution_time_ms (and aliases)
# - attributes.status
# - attributes.name
常見模式
# Status filtering
"attributes.status = 'OK'"
"attributes.status = 'ERROR'"

# Time-based queries
"attributes.timestamp_ms > 1749006880539"
"attributes.execution_time_ms > 5000"

# Tag searches
"tags.user_id = 'U001'"
"tags.`mlflow.traceName` = 'my_function'"

# Metadata queries
"metadata.`mlflow.user` = 'alice@company.com'"
"metadata.`mlflow.traceOutputs` != ''"

# Combined filters
"attributes.status = 'OK' AND tags.environment = 'production'"
"attributes.timestamp_ms > 1749006880539 AND attributes.execution_time_ms > 1000"
常見陷阱
| ❌ 不對 | ✅ 正確 | 問題 |
|---|---|---|
status = 'OK' |
attributes.status = 'OK' |
遺漏前置詞 |
mlflow.user = 'alice' |
metadata.`mlflow.user` = 'alice' |
遺漏前置詞和反引號 |
timestamp > '2024-01-01' |
attributes.timestamp > 1704067200000 |
使用毫秒,而非字串 |
tags.env = "prod" |
tags.env = 'prod' |
使用單引號 |
status = 'OK' OR status = 'ERROR' |
使用個別的查詢 | 或不受支援 |
詳細的搜尋範例
依執行代碼搜尋
# Find all traces associated with a specific MLflow run
with mlflow.start_run() as run:
    # Your traced code here
    traced_result = my_traced_function()

# Search for traces from this run
run_traces = mlflow.search_traces(
    run_id=run.info.run_id,
    return_type="list"  # Get list of Trace objects
)
控制件傳回類型
# Get results as pandas DataFrame (default if pandas is installed)
traces_df = mlflow.search_traces(
    filter_string="attributes.status = 'OK'",
    return_type="pandas"
)

# Get results as list of Trace objects
traces_list = mlflow.search_traces(
    filter_string="attributes.status = 'OK'",
    return_type="list"
)

# Access trace details from list
for trace in traces_list:
    print(f"Trace ID: {trace.info.trace_id}")
    print(f"Status: {trace.info.state}")
    print(f"Duration: {trace.info.execution_duration}")
依模型標識碼搜尋
# Find traces associated with a specific MLflow model
model_traces = mlflow.search_traces(
    model_id="my-model-123",
    filter_string="attributes.status = 'OK'"
)

# Analyze model performance
print(f"Found {len(model_traces)} successful traces for model")
print(f"Average latency: {model_traces['execution_time_ms'].mean():.2f}ms")
依狀態搜尋
# Find successful traces
traces = mlflow.search_traces(filter_string="attributes.status = 'OK'")

# Find failed traces
traces = mlflow.search_traces(filter_string="attributes.status = 'ERROR'")

# Find in-progress traces
traces = mlflow.search_traces(filter_string="attributes.status = 'IN_PROGRESS'")

# Exclude errors
traces = mlflow.search_traces(filter_string="attributes.status != 'ERROR'")
依追蹤名稱搜尋
# Find traces with specific name (rarely used - legacy field)
traces = mlflow.search_traces(filter_string="attributes.name = 'foo'")

# Find traces excluding a specific name
traces = mlflow.search_traces(filter_string="attributes.name != 'test_trace'")

# Note: Most users should use tags.`mlflow.traceName` instead
traces = mlflow.search_traces(
    filter_string="tags.`mlflow.traceName` = 'process_request'"
)
依時間戳搜尋
import time
from datetime import datetime

# Current time in milliseconds
current_time_ms = int(time.time() * 1000)

# Last 5 minutes
five_minutes_ago = current_time_ms - (5 * 60 * 1000)
traces = mlflow.search_traces(
    filter_string=f"attributes.timestamp_ms > {five_minutes_ago}"
)

# Specific date range
start_date = int(datetime(2024, 1, 1).timestamp() * 1000)
end_date = int(datetime(2024, 1, 31).timestamp() * 1000)
traces = mlflow.search_traces(
    filter_string=f"attributes.timestamp_ms > {start_date} AND attributes.timestamp_ms < {end_date}"
)

# Using timestamp aliases
traces = mlflow.search_traces(filter_string=f"attributes.timestamp > {five_minutes_ago}")
依運行時間搜尋
# Find slow traces (>5 seconds)
traces = mlflow.search_traces(filter_string="attributes.execution_time_ms > 5000")

# Find fast traces (<100ms)
traces = mlflow.search_traces(filter_string="attributes.execution_time_ms < 100")

# Performance range
traces = mlflow.search_traces(
    filter_string="attributes.execution_time_ms > 100 AND attributes.execution_time_ms < 1000"
)

# Using execution time aliases
traces = mlflow.search_traces(filter_string="attributes.latency > 1000")
依標籤搜尋
# Custom tags (set via mlflow.update_current_trace)
traces = mlflow.search_traces(filter_string="tags.customer_id = 'C001'")
traces = mlflow.search_traces(filter_string="tags.environment = 'production'")
traces = mlflow.search_traces(filter_string="tags.version = 'v2.1.0'")

# MLflow system tags (require backticks)
traces = mlflow.search_traces(
    filter_string="tags.`mlflow.traceName` = 'process_chat_request'"
)
traces = mlflow.search_traces(
    filter_string="tags.`mlflow.artifactLocation` != ''"
)
依元數據搜尋
# Search by response content (exact match)
traces = mlflow.search_traces(
    filter_string="metadata.`mlflow.traceOutputs` = 'exact response text'"
)

# Find traces with any output
traces = mlflow.search_traces(
    filter_string="metadata.`mlflow.traceOutputs` != ''"
)

# Search by user
traces = mlflow.search_traces(
    filter_string="metadata.`mlflow.user` = 'alice@company.com'"
)

# Search by source file
traces = mlflow.search_traces(
    filter_string="metadata.`mlflow.source.name` = 'app.py'"
)

# Search by git information
traces = mlflow.search_traces(
    filter_string="metadata.`mlflow.source.git.branch` = 'main'"
)
使用 AND 的複雜篩選
# Recent successful production traces
current_time_ms = int(time.time() * 1000)
one_hour_ago = current_time_ms - (60 * 60 * 1000)

traces = mlflow.search_traces(
    filter_string=f"attributes.status = 'OK' AND "
                 f"attributes.timestamp_ms > {one_hour_ago} AND "
                 f"tags.environment = 'production'"
)

# Fast traces from specific user
traces = mlflow.search_traces(
    filter_string="attributes.execution_time_ms < 100 AND "
                 "metadata.`mlflow.user` = 'alice@company.com'"
)

# Specific function with performance threshold
traces = mlflow.search_traces(
    filter_string="tags.`mlflow.traceName` = 'process_payment' AND "
                 "attributes.execution_time_ms > 1000"
)
排序結果
# Most recent first
traces = mlflow.search_traces(
    filter_string="attributes.status = 'OK'",
    order_by=["attributes.timestamp_ms DESC"]
)

# Fastest first
traces = mlflow.search_traces(
    order_by=["attributes.execution_time_ms ASC"]
)

# Multiple sort criteria
traces = mlflow.search_traces(
    filter_string="attributes.status = 'OK'",
    order_by=[
        "attributes.timestamp_ms DESC",
        "attributes.execution_time_ms ASC"
    ]
)
DataFrame 作業
傳回的 mlflow.search_traces DataFrame 包含下列資料列:
traces_df = mlflow.search_traces()

# Default columns
print(traces_df.columns)
# ['request_id', 'trace', 'timestamp_ms', 'status', 'execution_time_ms',
#  'request', 'response', 'request_metadata', 'spans', 'tags']
擷取範圍字段
# Extract specific span fields into DataFrame columns
traces = mlflow.search_traces(
    extract_fields=[
        "process_request.inputs.customer_id",
        "process_request.outputs",
        "validate_input.inputs",
        "generate_response.outputs.message"
    ]
)

# Use extracted fields for evaluation dataset
eval_data = traces.rename(columns={
    "process_request.inputs.customer_id": "customer",
    "generate_response.outputs.message": "ground_truth"
})
建置動態查詢
def build_trace_filter(status=None, user=None, min_duration=None,
                      max_duration=None, tags=None, after_timestamp=None):
    """Build dynamic filter string from parameters"""
    conditions = []

    if status:
        conditions.append(f"attributes.status = '{status}'")

    if user:
        conditions.append(f"metadata.`mlflow.user` = '{user}'")

    if min_duration:
        conditions.append(f"attributes.execution_time_ms > {min_duration}")

    if max_duration:
        conditions.append(f"attributes.execution_time_ms < {max_duration}")

    if after_timestamp:
        conditions.append(f"attributes.timestamp_ms > {after_timestamp}")

    if tags:
        for key, value in tags.items():
            # Handle dotted tag names
            if '.' in key:
                conditions.append(f"tags.`{key}` = '{value}'")
            else:
                conditions.append(f"tags.{key} = '{value}'")

    return " AND ".join(conditions) if conditions else None

# Usage
filter_string = build_trace_filter(
    status="OK",
    user="alice@company.com",
    min_duration=100,
    tags={"environment": "production", "mlflow.traceName": "process_order"}
)

traces = mlflow.search_traces(filter_string=filter_string)
實用範例參考
錯誤監視
監視和分析生產環境中的錯誤:
import mlflow
import time
import pandas as pd

def monitor_errors(experiment_name: str, hours: int = 1):
    """Monitor errors in the last N hours."""

    # Calculate time window
    current_time_ms = int(time.time() * 1000)
    cutoff_time_ms = current_time_ms - (hours * 60 * 60 * 1000)

    # Find all errors
    failed_traces = mlflow.search_traces(
        filter_string=f"attributes.status = 'ERROR' AND "
                     f"attributes.timestamp_ms > {cutoff_time_ms}",
        order_by=["attributes.timestamp_ms DESC"]
    )

    if len(failed_traces) == 0:
        print(f"No errors found in the last {hours} hour(s)")
        return

    # Analyze error patterns
    print(f"Found {len(failed_traces)} errors in the last {hours} hour(s)\n")

    # Group by function name
    error_by_function = failed_traces.groupby('tags.mlflow.traceName').size()
    print("Errors by function:")
    print(error_by_function.to_string())

    # Show recent error samples
    print("\nRecent error samples:")
    for _, trace in failed_traces.head(5).iterrows():
        print(f"- {trace['request_preview'][:60]}...")
        print(f"  Function: {trace.get('tags.mlflow.traceName', 'unknown')}")
        print(f"  Time: {pd.to_datetime(trace['timestamp_ms'], unit='ms')}")
        print()

    return failed_traces
效能分析
分析效能特性並找出瓶頸:
def profile_performance(function_name: str = None, percentiles: list = [50, 95, 99]):
    """Profile performance metrics for traces."""

    # Build filter
    filter_parts = []
    if function_name:
        filter_parts.append(f"tags.`mlflow.traceName` = '{function_name}'")

    filter_string = " AND ".join(filter_parts) if filter_parts else None

    # Get traces
    traces = mlflow.search_traces(filter_string=filter_string)

    if len(traces) == 0:
        print("No traces found")
        return

    # Calculate percentiles
    perf_stats = traces['execution_time_ms'].describe(percentiles=[p/100 for p in percentiles])

    print(f"Performance Analysis ({len(traces)} traces)")
    print("=" * 40)
    for p in percentiles:
        print(f"P{p}: {perf_stats[f'{p}%']:.1f}ms")
    print(f"Mean: {perf_stats['mean']:.1f}ms")
    print(f"Max: {perf_stats['max']:.1f}ms")

    # Find outliers (>P99)
    if 99 in percentiles:
        p99_threshold = perf_stats['99%']
        outliers = traces[traces['execution_time_ms'] > p99_threshold]

        if len(outliers) > 0:
            print(f"\nOutliers (>{p99_threshold:.0f}ms): {len(outliers)} traces")
            for _, trace in outliers.head(3).iterrows():
                print(f"- {trace['execution_time_ms']:.0f}ms: {trace['request_preview'][:50]}...")

    return traces
用戶活動分析
追蹤與分析使用者行為模式:
def analyze_user_activity(user_id: str, days: int = 7):
    """Analyze activity patterns for a specific user."""

    cutoff_ms = int((time.time() - days * 86400) * 1000)

    traces = mlflow.search_traces(
        filter_string=f"metadata.`mlflow.user` = '{user_id}' AND "
                     f"attributes.timestamp_ms > {cutoff_ms}",
        order_by=["attributes.timestamp_ms DESC"]
    )

    if len(traces) == 0:
        print(f"No activity found for user {user_id}")
        return

    print(f"User {user_id} Activity Report ({days} days)")
    print("=" * 50)
    print(f"Total requests: {len(traces)}")

    # Daily activity
    traces['date'] = pd.to_datetime(traces['timestamp_ms'], unit='ms').dt.date
    daily_activity = traces.groupby('date').size()
    print(f"\nDaily activity:")
    print(daily_activity.to_string())

    # Query categories
    if 'tags.query_category' in traces.columns:
        categories = traces['tags.query_category'].value_counts()
        print(f"\nQuery categories:")
        print(categories.to_string())

    # Performance stats
    print(f"\nPerformance:")
    print(f"Average response time: {traces['execution_time_ms'].mean():.1f}ms")
    print(f"Error rate: {(traces['status'] == 'ERROR').mean() * 100:.1f}%")

    return traces
最佳做法
1.設計一致的標記策略
為您的組織建立標記分類法:
class TraceTagging:
    """Standardized tagging strategy for traces."""

    # Required tags for all traces
    REQUIRED_TAGS = ["environment", "version", "service_name"]

    # Category mappings
    CATEGORIES = {
        "user_management": ["login", "logout", "profile_update"],
        "content_generation": ["summarize", "translate", "rewrite"],
        "data_retrieval": ["search", "fetch", "query"]
    }

    @staticmethod
    def tag_trace(operation: str, **kwargs):
        """Apply standardized tags to current trace."""
        tags = {
            "operation": operation,
            "timestamp": datetime.now().isoformat(),
            "service_name": "genai-platform"
        }

        # Add category based on operation
        for category, operations in TraceTagging.CATEGORIES.items():
            if operation in operations:
                tags["category"] = category
                break

        # Add custom tags
        tags.update(kwargs)

        # Validate required tags
        for required in TraceTagging.REQUIRED_TAGS:
            if required not in tags:
                tags[required] = "unknown"

        mlflow.update_current_trace(tags=tags)
        return tags
2.建置可重複使用的搜尋公用程式
class TraceSearcher:
    """Reusable trace search utilities."""

    def __init__(self, experiment_ids: list = None):
        self.experiment_ids = experiment_ids

    def recent_errors(self, hours: int = 1) -> pd.DataFrame:
        """Get recent error traces."""
        cutoff = int((time.time() - hours * 3600) * 1000)
        return mlflow.search_traces(
            experiment_ids=self.experiment_ids,
            filter_string=f"attributes.status = 'ERROR' AND "
                         f"attributes.timestamp_ms > {cutoff}",
            order_by=["attributes.timestamp_ms DESC"]
        )

    def slow_operations(self, threshold_ms: int = 5000) -> pd.DataFrame:
        """Find operations slower than threshold."""
        return mlflow.search_traces(
            experiment_ids=self.experiment_ids,
            filter_string=f"attributes.execution_time_ms > {threshold_ms}",
            order_by=["attributes.execution_time_ms DESC"]
        )

    def by_user(self, user_id: str, days: int = 7) -> pd.DataFrame:
        """Get traces for a specific user."""
        cutoff = int((time.time() - days * 86400) * 1000)
        return mlflow.search_traces(
            experiment_ids=self.experiment_ids,
            filter_string=f"tags.user_id = '{user_id}' AND "
                         f"attributes.timestamp_ms > {cutoff}",
            order_by=["attributes.timestamp_ms DESC"]
        )

    def by_category(self, category: str, status: str = None) -> pd.DataFrame:
        """Get traces by category with optional status filter."""
        filters = [f"tags.category = '{category}'"]
        if status:
            filters.append(f"attributes.status = '{status}'")

        return mlflow.search_traces(
            experiment_ids=self.experiment_ids,
            filter_string=" AND ".join(filters)
        )

    def performance_report(self, function_name: str = None) -> dict:
        """Generate performance report."""
        filter_parts = []
        if function_name:
            filter_parts.append(f"tags.`mlflow.traceName` = '{function_name}'")

        filter_string = " AND ".join(filter_parts) if filter_parts else None
        traces = mlflow.search_traces(
            experiment_ids=self.experiment_ids,
            filter_string=filter_string
        )

        if len(traces) == 0:
            return {"error": "No traces found"}

        return {
            "total_traces": len(traces),
            "error_rate": (traces['status'] == 'ERROR').mean(),
            "avg_duration_ms": traces['execution_time_ms'].mean(),
            "p50_duration_ms": traces['execution_time_ms'].quantile(0.5),
            "p95_duration_ms": traces['execution_time_ms'].quantile(0.95),
            "p99_duration_ms": traces['execution_time_ms'].quantile(0.99)
        }

# Usage example
searcher = TraceSearcher()
errors = searcher.recent_errors(hours=24)
slow_ops = searcher.slow_operations(threshold_ms=10000)
user_traces = searcher.by_user("U001", days=30)
report = searcher.performance_report("process_request")