教學課程:使用受控私人端點連線到 AKS 叢集上的自我裝載 Prometheus 服務
本指南會逐步引導您在 Azure Kubernetes Service (AKS) 叢集上安裝 Prometheus、開放原始碼監視和警示工具組的步驟。 然後使用 Azure Managed Grafana 的受控私人端點來連線到此 Prometheus 伺服器,並在 Grafana 儀錶板中顯示 Prometheus 數據。
在本教學課程中,您會了解如何:
- 建立 Azure Kubernetes Service 叢集
- 安裝 Prometheus
- 將私人連結服務新增至 Prometheus 伺服器
- 使用受控私人端點 連線
- 在 Grafana 儀錶板中顯示 Prometheus 數據
必要條件
開始之前,請確定您有下列專案:
建立 Azure Kubernetes Service 叢集
執行
az login命令來登入 Azure CLI。az login如果您有多個 Azure 訂用帳戶,請使用 命令
az account set -s <your-azure-subscription-id>來選取您的 Azure 訂用帳戶。安裝或更新 kubectl。
az aks install-cli建立兩個bash/zsh變數,我們將在後續命令中使用。 如果您使用另一個殼層,請變更下列語法。
RESOURCE_GROUP=myResourceGroup
AKS_NAME=myaks
建立資源群組。 在此範例中,我們會在美國中西部 Azure 區域中建立資源群組。
az group create --name $RESOURCE_GROUP --location westcentralus使用 az aks create 命令建立新的 AKS 叢集。 在這裡,我們會使用 B 系列高載虛擬機類型建立三個節點的叢集,此類型符合成本效益,適用於這類小型測試/開發工作負載。
az aks create --resource-group $RESOURCE_GROUP \
  --name $AKS_NAME \
  --node-count 3 \
  --node-vm-size Standard_B2s \
  --generate-ssh-keys
此作業可能需要幾分鐘才能完成。
向您所建立的叢集進行驗證。
az aks get-credentials \
  --resource-group $RESOURCE_GROUP \
  --name $AKS_NAME
您現在可以使用 kubectl 存取 Kubernetes 叢集。
使用 kubectl 查看您已建立的節點。
kubectl get nodes
安裝 Prometheus
安裝 Prometheus 的熱門方式是透過 prometheus-operator,其提供 Prometheus 的 Kubernetes 原生部署和管理和相關監視元件。 在本教學課程中,我們會使用 kube-prometheus-stack Helm 圖表來部署 prometheus-operator。
新增 helm-charts 存放庫,然後更新您的存放庫清單。
helm repo add prometheus-community https://prometheus-community.github.io/helm-charts
helm repo update
將 Helm 圖表安裝到稱為監視的命名空間中。 此命名空間會自動建立。
helm install prometheus \
  prometheus-community/kube-prometheus-stack \
  --namespace monitoring \
  --create-namespace
helm 命令會提示您檢查已部署 Pod 的狀態。 執行下列命令。
kubectl --namespace monitoring get pods繼續之前,請確定Pod全部「執行中」。 如果在不太可能的情況下,它們無法達到執行中狀態,您可能會想要針對它們進行疑難解答。
將私人連結服務新增至 Prometheus 伺服器
Azure Private Link 服務 可讓您透過不同 Azure 虛擬網路之間的私人連結來取用 Kubernetes 服務。 AKS 與 Azure Private Link Service 有原生整合,可協助您標註 Kubernetes 服務物件,以在 Azure 中建立對應的私人連結服務。
請參閱下列 pls-prometheus-svc.yaml 檔案的內容:
apiVersion: v1
kind: Service
metadata:
  name: prom-pls-svc
  annotations:
    service.beta.kubernetes.io/azure-load-balancer-internal: "true" # Use an internal LB with PLS
    service.beta.kubernetes.io/azure-pls-create: "true"
    service.beta.kubernetes.io/azure-pls-name: promManagedPls
    service.beta.kubernetes.io/azure-pls-proxy-protocol: "false"
    service.beta.kubernetes.io/azure-pls-visibility: "*"
spec:
  type: LoadBalancer
  selector:
    # app: myApp
    app.kubernetes.io/name: prometheus
    prometheus: prometheus-kube-prometheus-prometheus # note that this is related to the release name
  ports:
    - name: http-web
      protocol: TCP
      port: 9090
      targetPort: 9090
執行下列命令,將私人鏈接服務新增至 Prometheus 伺服器。
kubectl --namespace monitoring apply -f pls-prometheus-svc.yaml具有名稱
promManagedPls的私人連結服務會在 AKS 受控資源群組中建立。 此程序會需要幾分鐘的時間。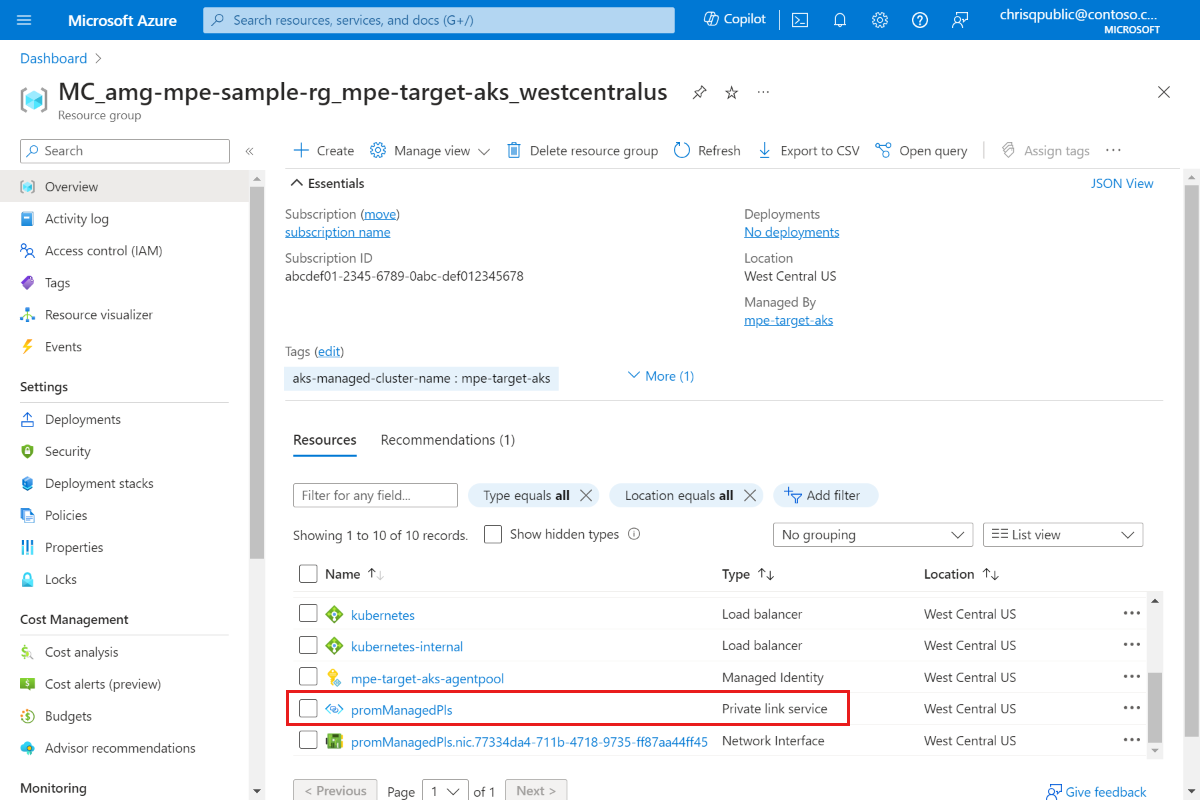
使用受控私人端點 連線
如果您還沒有 Azure 受控 Grafana 工作區,請遵循 Azure 受控 Grafana 快速入門建立一個工作區。
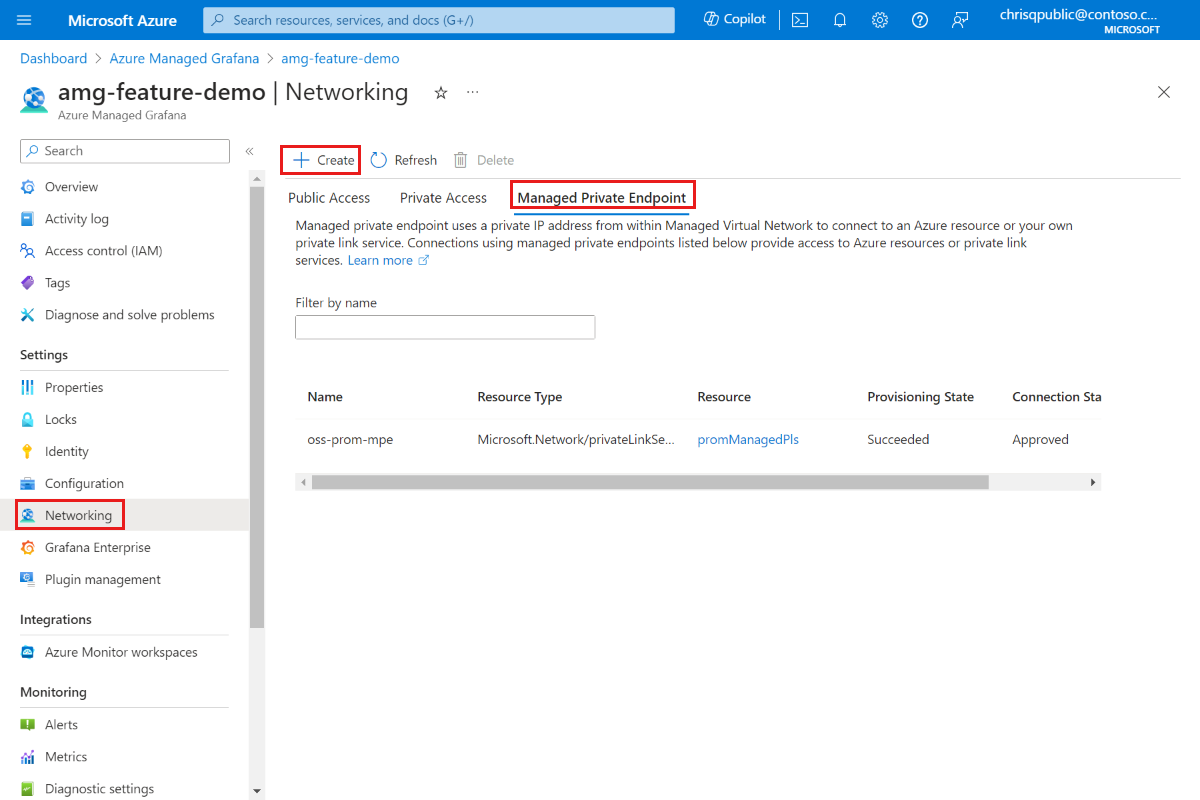
開啟您的 Azure 受控 Grafana 工作區,然後移至 [網络>受控私人端點>建立]。
輸入受控私人端點的名稱,然後選取您的 Azure 訂用帳戶。
針對 [資源類型 ] 選取 [Microsoft.Network/privateLinkServices ][私人鏈接服務],針對 [ 目標資源],選取
promManagedPls在上述步驟中建立的私人鏈接服務。 每個受控私人端點都會取得私人IP位址。 您也可以提供此受控私人端點的功能變數名稱。 Azure 受控 Grafana 服務可確保此網域解析為 Azure 受控 Grafana 環境內的受控私人端點私人 IP。 例如,將網域設定為*.prom.my-own-domain.com。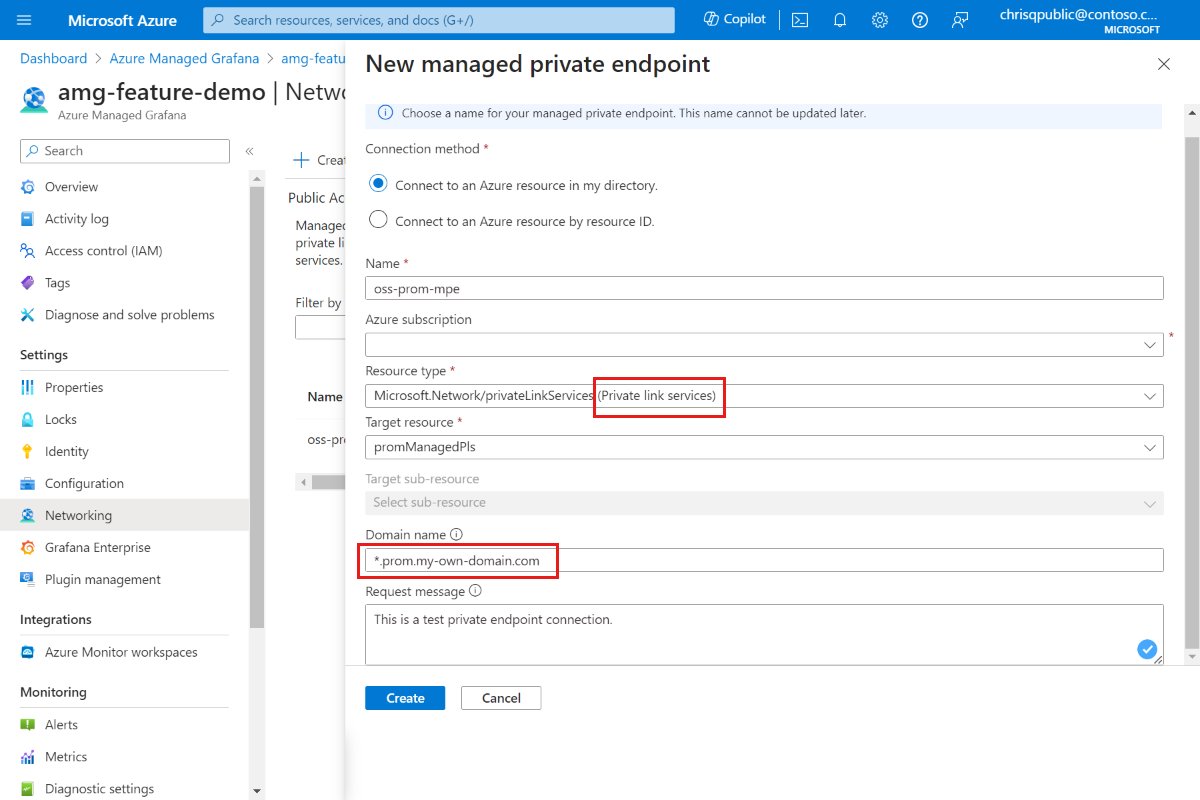
移至 promManagedPls 資源以核准私人端點連線。 在 [設定] 下,移至 [私人端點連線],使用複選框選取您的聯機並核准。
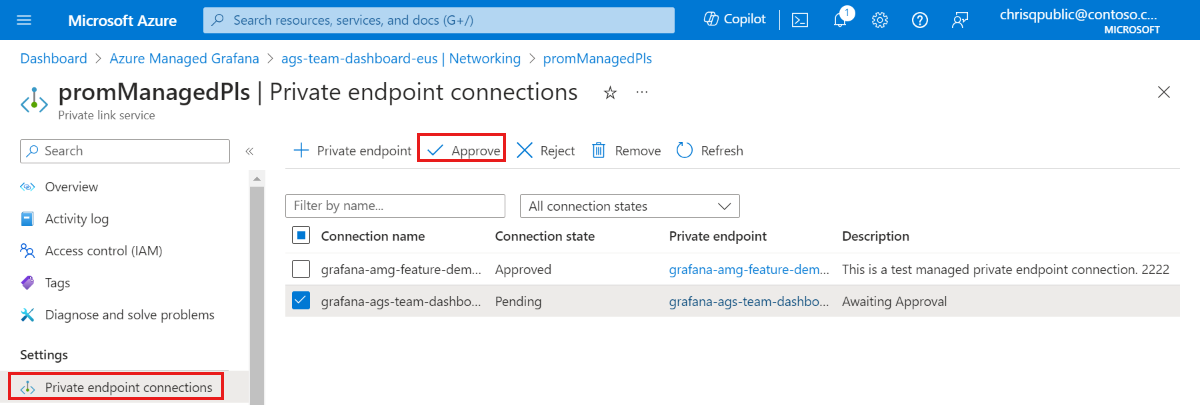
核准私人端點連線之後,請返回您的 Azure 受控 Grafana 資源,然後選取 [受控私人端點] 索引標籤標的 [重新 整理] 按鈕,以同步
Connection state處理 。 它現在應該會顯示為 [已核准]。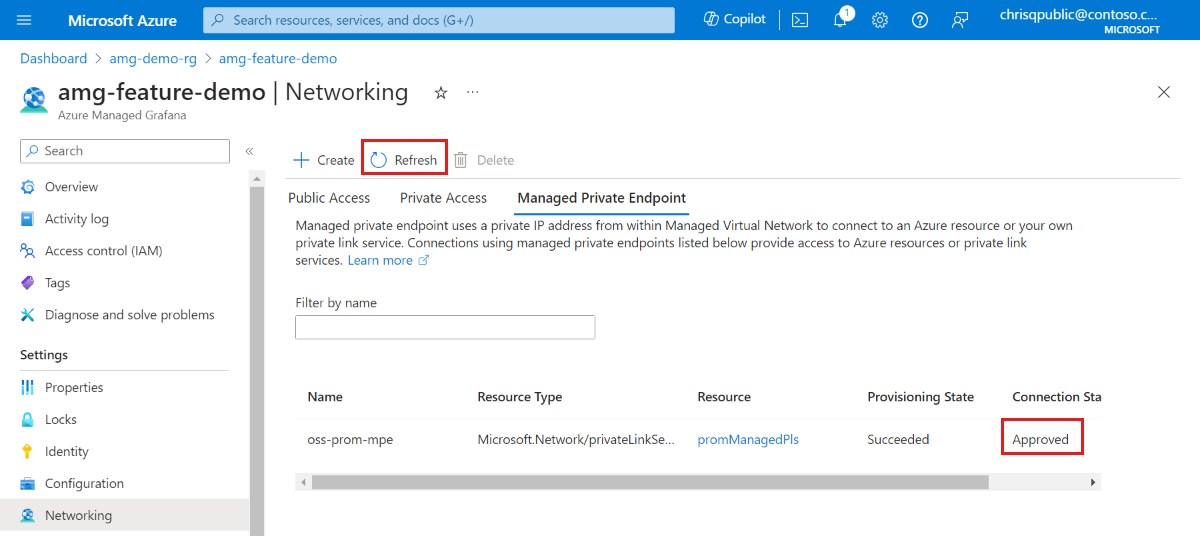
在 Grafana 儀錶板中顯示 Prometheus 數據
從 Grafana 入口網站將 Prometheus 數據源新增至 Grafana。 如需詳細資訊,請移至新增 數據源。 我們的 Prometheus URL 是
http://prom-service.prom.my-own-domain.com:9090。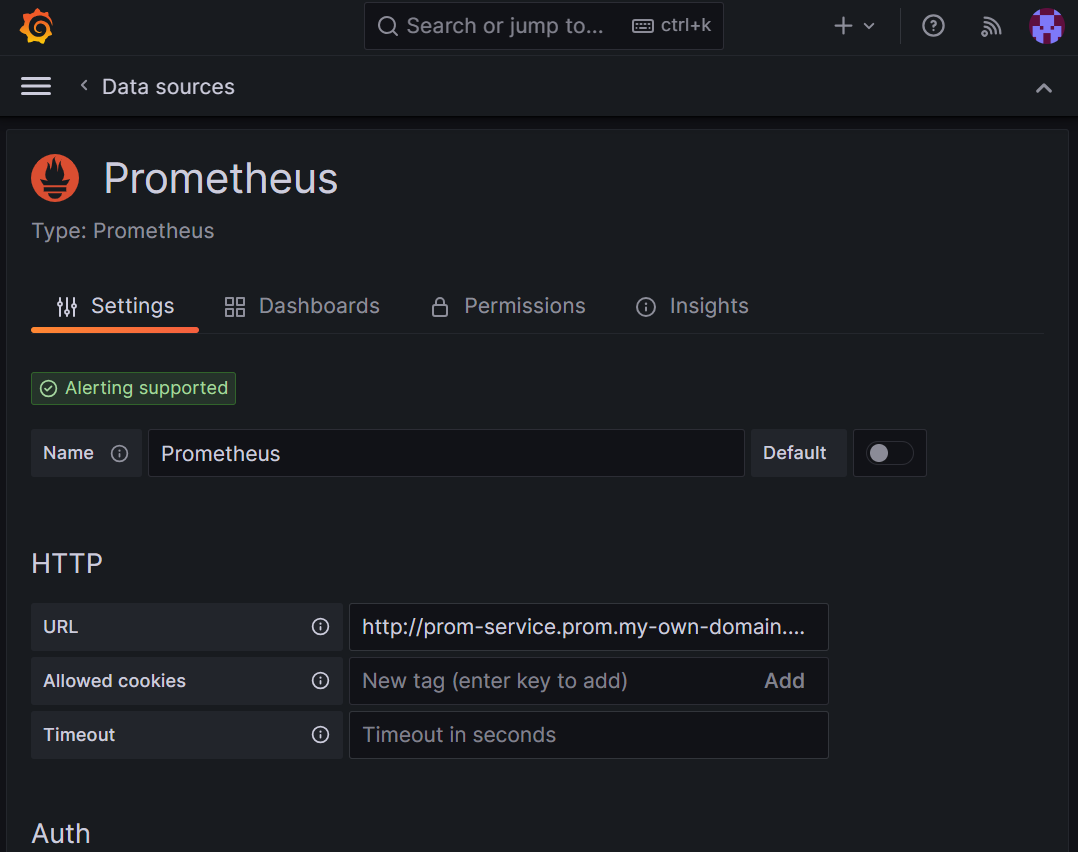
若要利用自我載入 Prometheus 資料來源,請嘗試使用 節點匯出工具完整 儀錶板識別碼
1860。 如需更多指導方針,請移至 從 Grafana Labs 匯入儀錶板。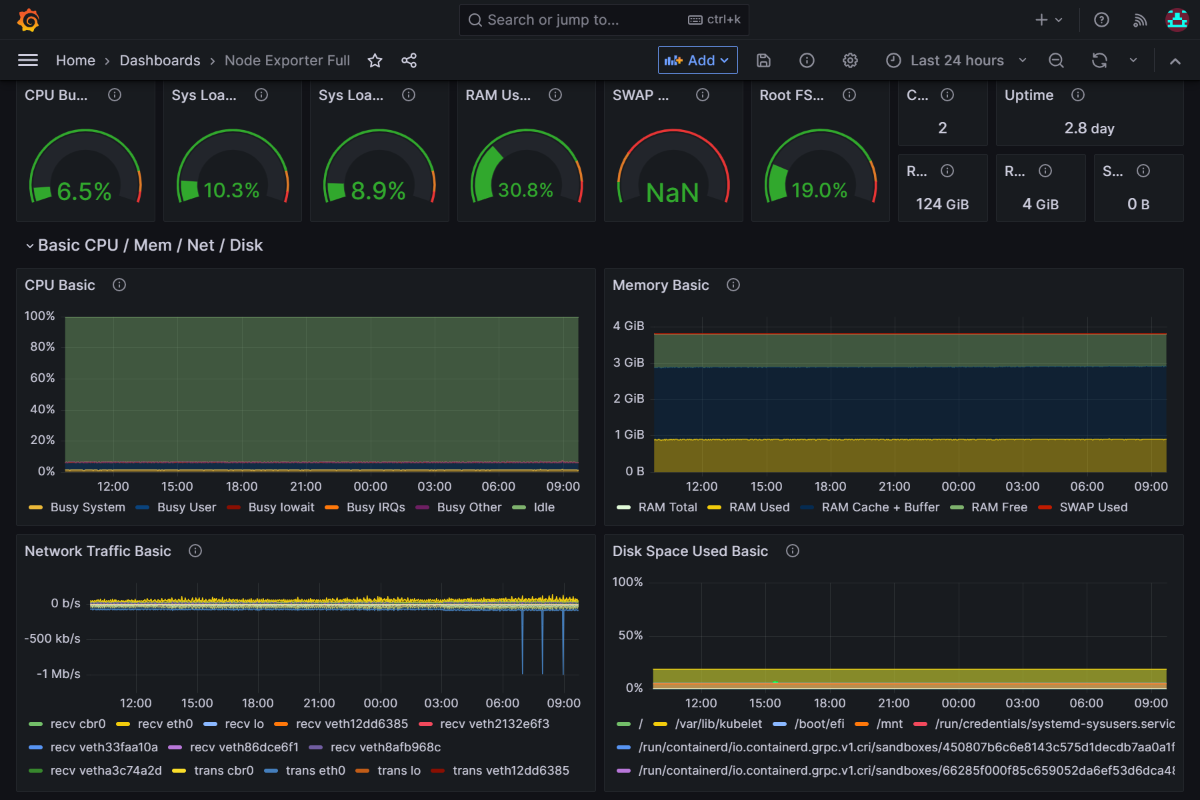
後續步驟
瞭解如何 使用服務帳戶。
意見反應
即將登場:在 2024 年,我們將逐步淘汰 GitHub 問題作為內容的意見反應機制,並將它取代為新的意見反應系統。 如需詳細資訊,請參閱:https://aka.ms/ContentUserFeedback。
提交並檢視相關的意見反應