適用於 Apache Cassandra 的 Azure 受控執行個體 會透過 Azure 監視器提供計量和診斷記錄。
適用於 Apache Cassandra 計量的 Azure 受控執行個體
您可以移至叢集資源,然後選取 [計量],以可視化 Azure 入口網站 中適用於 Apache Cassandra 的 Azure 受控執行個體 計量。 然後,您可以從可用的計量和匯總中選擇。
![顯示 Azure 入口網站中 [計量] 窗格的螢幕快照。](media/azure-monitor/metrics.png#lightbox)
Azure 中的診斷設定
Azure 監視器會使用診斷設定來收集資源記錄,也稱為 數據平面記錄。 Azure 資源會發出資源記錄,以提供其作業的豐富且頻繁的數據。 Azure 監視器會為每個要求擷取這些記錄。 數據平面作業的範例包括 刪除、 插入和 readFeed。 這些記錄的內容會依資源類型而有所不同。
系統會自動收集平台計量和活動記錄。 您必須建立診斷設定來收集資源記錄,或將它們轉送至 Azure 監視器外部。 您可以對 Azure Managed Instance for Apache Cassandra 叢集資源啟用診斷設定,並將資源記錄傳送至下列來源:
- Log Analytics 工作區。 傳送至 Log Analytics 工作區的數據會寫入 Azure 診斷(舊版)或資源特定(預覽)數據表。
- 事件中樞。
- 「儲存體帳戶」。
注意
建議您在資源特定模式中建立診斷設定。
使用 Azure 入口網站建立診斷設定
登入 Azure 入口網站。
移至適用於 Apache Cassandra 叢集資源的 Azure 受控執行個體。
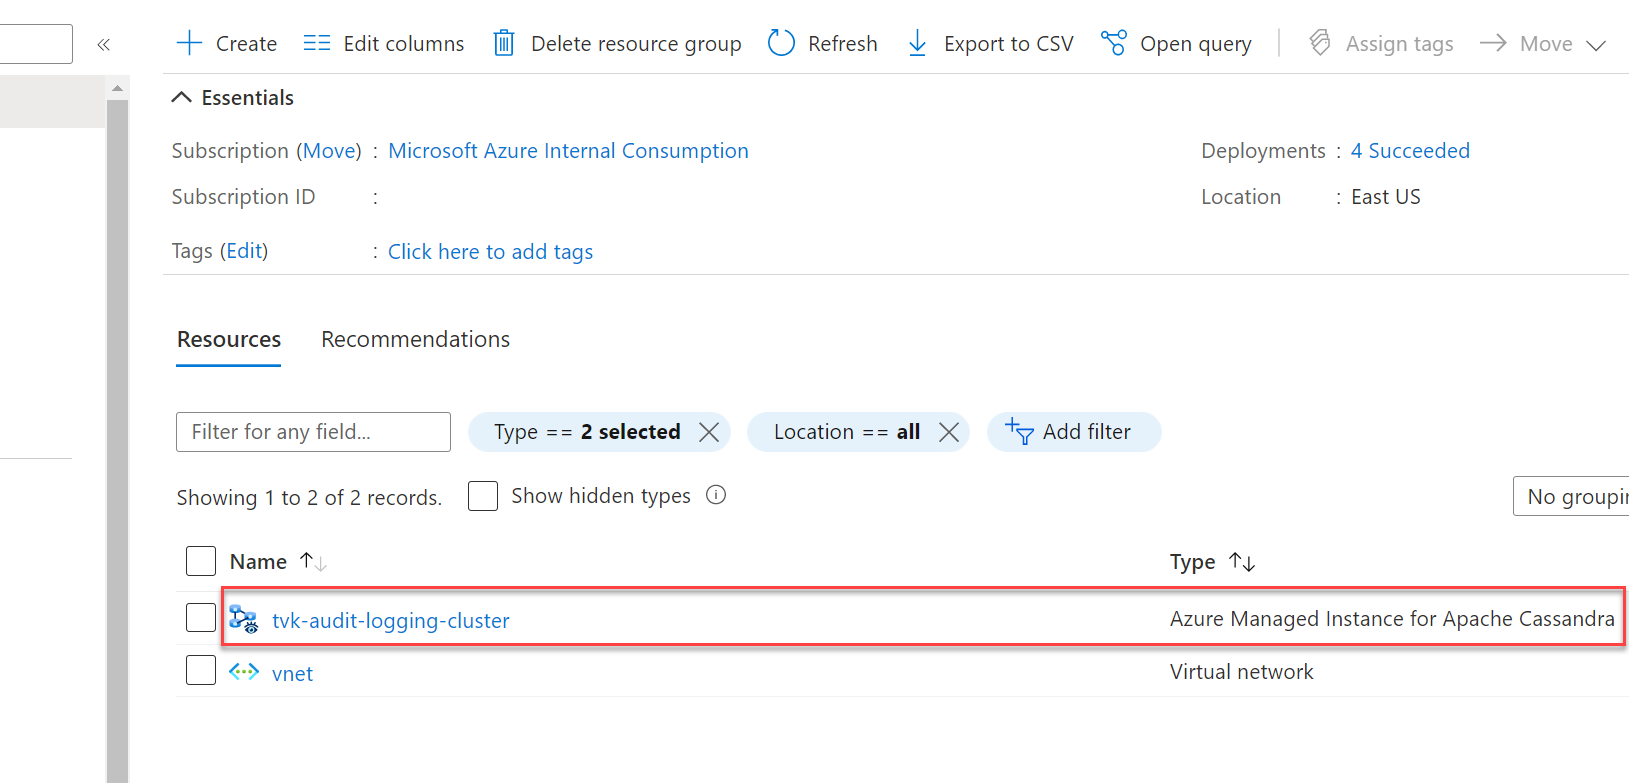
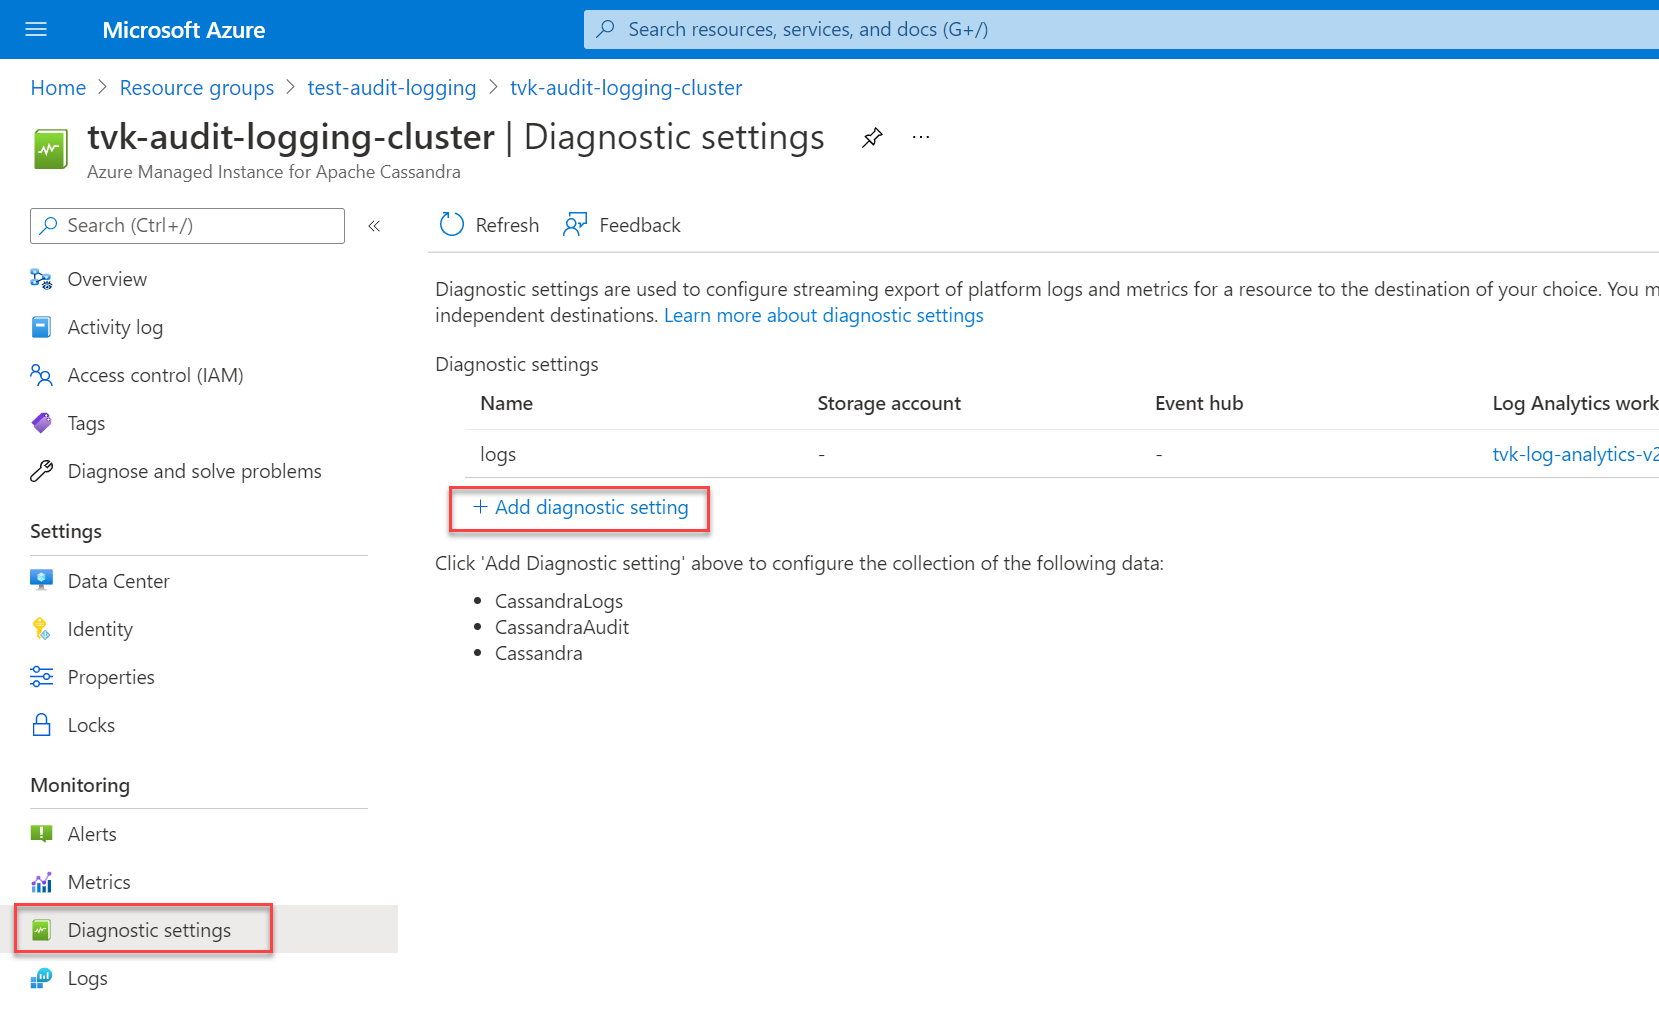
在 [監視] 區段中選取 [診斷設定],然後選取 [新增診斷設定]。
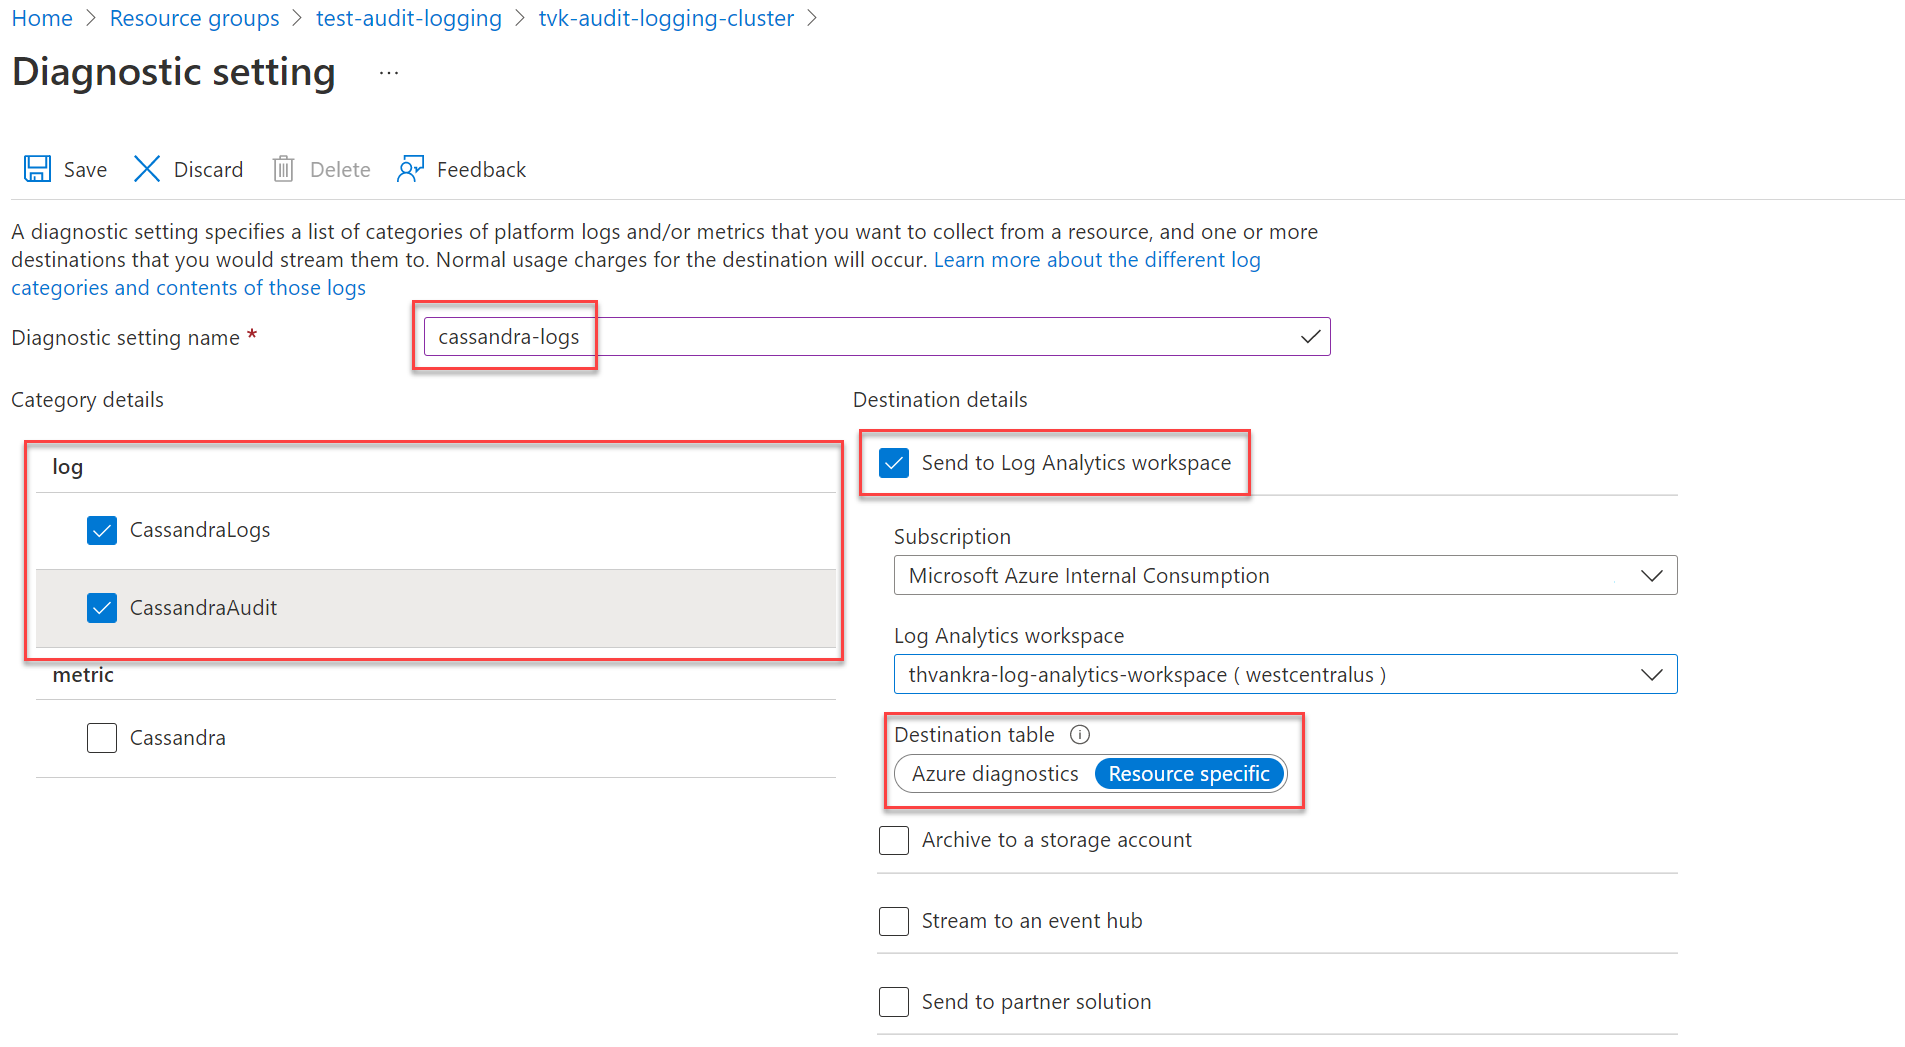
在 [ 診斷設定 ] 窗格上,選擇您設定的名稱。
在 [類別詳細數據] 底下,選取您的類別。 CassandraLogs 類別會記錄 Cassandra 伺服器作業。 CassandraAudit 類別會記錄稽核和 Cassandra 查詢語言 (CQL) 作業。
在 [目的地詳細數據] 下,選擇您記錄的慣用目的地。 若要將記錄傳送至 Log Analytics 工作區,請務必選取 [ 資源特定 ] 作為目的地數據表。
注意
如果您要將記錄傳送至 Log Analytics 工作區,最多可能需要 20 分鐘的時間才會出現。 在此之前,不會顯示 Azure 受控實例 for Apache Cassandra 底下的資源特定數據表。
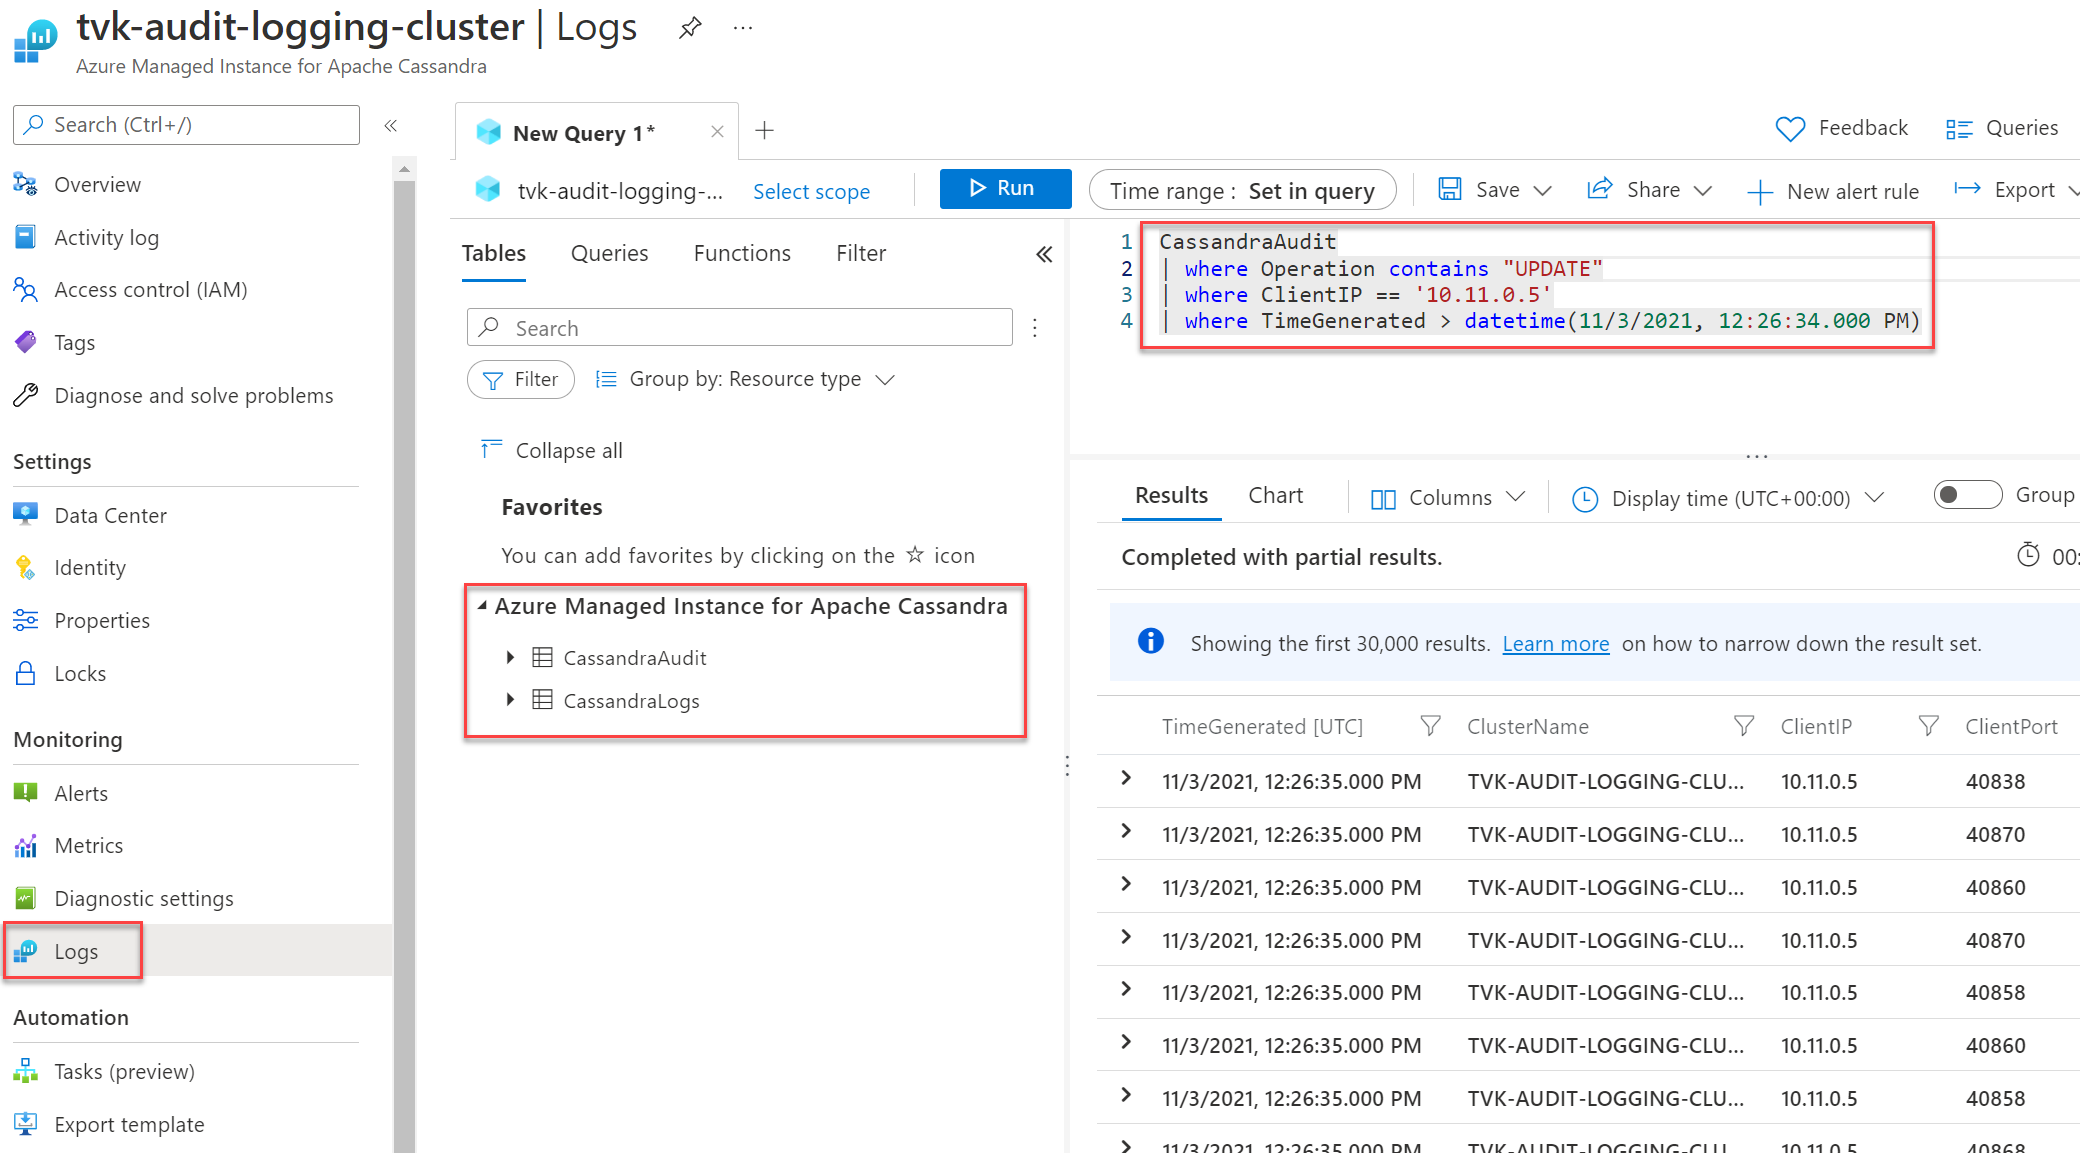
設定診斷記錄和數據流動之後,您可以使用 Azure 數據總管選取 [記錄 ] 並查詢可用的診斷記錄。 如需 Azure 監視器和 Kusto 查詢語言 的詳細資訊,請參閱 Azure 監視器中的記錄查詢。


使用 Azure CLI 建立診斷設定
若要使用 Azure CLI 建立診斷設定,請使用 az monitor diagnostic-settings create 命令:
logs='[{"category":"CassandraAudit","enabled":true,"retentionPolicy":{"enabled":true,"days":3}},{"category":"CassandraLogs","enabled":true,"retentionPolicy":{"enabled":true,"days":3}}]'
resourceId='/subscriptions/{SUBSCRIPTION_ID}/resourceGroups/{RESOURCE_GROUP}/providers/Microsoft.DocumentDB/cassandraClusters/{CLUSTER_NAME}'
workspace='/subscriptions/{SUBSCRIPTION_ID}/resourcegroups/{RESOURCE_GROUP}/providers/microsoft.operationalinsights/workspaces/{WORKSPACE_NAME}'

az monitor diagnostic-settings create  --name tvk-diagnostic-logs-cassandra --resource $resourceId --logs  $logs --workspace $workspace --export-to-resource-specific true
使用 REST API 建立診斷設定
使用 Azure 監視器 REST API 來建立診斷設定,方法是使用互動式控制台。 如需詳細資訊,請參閱 診斷設定。
注意
建議將 logAnalyticsDestinationType 屬性 Dedicated 設定為 ,以啟用資源特定的數據表。
請求
PUT
https://management.azure.com/{resource-id}/providers/microsoft.insights/diagnosticSettings/service?api-version={api-version}
標頭
| 參數/標頭 | 值/描述 |
|---|---|
name |
診斷設定的名稱 |
resourceUri |
subscriptions/{SUBSCRIPTION_ID}/resourceGroups/{RESOURCE_GROUP}/providers/Microsoft.DocumentDb/databaseAccounts/{ACCOUNT_NAME}/providers/microsoft.insights/diagnosticSettings/{DIAGNOSTIC_SETTING_NAME} |
api-version |
2017-05-01-preview |
Content-Type |
application/json |
本文
{
    "id": "/subscriptions/{SUBSCRIPTION_ID}/resourceGroups/{RESOURCE_GROUP}/providers/Microsoft.DocumentDb/databaseAccounts/{ACCOUNT_NAME}/providers/microsoft.insights/diagnosticSettings/{DIAGNOSTIC_SETTING_NAME}",
    "type": "Microsoft.Insights/diagnosticSettings",
    "name": "name",
    "location": null,
    "kind": null,
    "tags": null,
    "properties": {
        "storageAccountId": null,
        "serviceBusRuleId": null,
        "workspaceId": "/subscriptions/{SUBSCRIPTION_ID}/resourcegroups/{RESOURCE_GROUP}/providers/microsoft.operationalinsights/workspaces/{WORKSPACE_NAME}",
        "eventHubAuthorizationRuleId": null,
        "eventHubName": null,
        "logs": [
            {
                "category": "CassandraAudit",
                "categoryGroup": null,
                "enabled": true,
                "retentionPolicy": {
                    "enabled": false,
                    "days": 0
                }
            },
            {
                "category": "CassandraLogs",
                "categoryGroup": null,
                "enabled": true,
                "retentionPolicy": {
                    "enabled": false,
                    "days": 0
                }
            }
        ],
        "logAnalyticsDestinationType": "Dedicated"
    },
    "identity": null
}
稽核白名單
注意
本文包含字詞白名單的參考,Microsoft不再使用。 從軟體中移除該字詞時,我們也會將其從本文中移除。
根據預設,稽核記錄會為每個登入嘗試和 CQL 查詢建立記錄。 結果可能會造成壓倒性,並增加額外負荷。 若要管理這種情況,您可以使用允許清單選擇性地包含或排除特定的稽核記錄。
Cassandra 3.11
在 Cassandra 3.11 中,您可以使用稽核白名單功能,設定哪些作業不會建立稽核記錄。 Cassandra 3.11 中預設啟用稽核白名單功能。 若要了解如何設定白名單,請參閱角色型白名單管理。
範例:
若要從稽核記錄篩選出使用者
bob的所有SELECT和MODIFY作業,請執行下列語句:cassandra@cqlsh> ALTER ROLE bob WITH OPTIONS = { 'GRANT AUDIT WHITELIST FOR SELECT' : 'data' }; cassandra@cqlsh> ALTER ROLE bob WITH OPTIONS = { 'GRANT AUDIT WHITELIST FOR MODIFY' : 'data' };若要從稽核記錄中篩選出keyspace中
design使用者jim之數據表上decisions的所有SELECT作業,請執行下列語句:cassandra@cqlsh> ALTER ROLE jim WITH OPTIONS = { 'GRANT AUDIT WHITELIST FOR SELECT' : 'data/design/decisions' };若要撤銷使用者
bob在所有SELECT作業上的允許清單,請執行下列指令:cassandra@cqlsh> ALTER ROLE bob WITH OPTIONS = { 'REVOKE AUDIT WHITELIST FOR SELECT' : 'data' };若要檢視目前的允許清單,請執行下列語句:
cassandra@cqlsh> LIST ROLES;
Cassandra 4 和更新版本
在 Cassandra 4 和更新版本中,您可以在 Cassandra 組態中設定白名單。 如需詳細資訊,請參閱 更新 Cassandra 設定。 可用的選項如下(參考: 用於稽核記錄的 Cassandra 檔):
audit_logging_options:
    included_keyspaces: <Comma separated list of keyspaces to be included in audit log, default - includes all keyspaces>
    excluded_keyspaces: <Comma separated list of keyspaces to be excluded from audit log, default - excludes no keyspace except system, system_schema and system_virtual_schema>
    included_categories: <Comma separated list of Audit Log Categories to be included in audit log, default - includes all categories>
    excluded_categories: <Comma separated list of Audit Log Categories to be excluded from audit log, default - excludes no category>
    included_users: <Comma separated list of users to be included in audit log, default - includes all users>
    excluded_users: <Comma separated list of users to be excluded from audit log, default - excludes no user>
可用的類別包括:QUERY、、DML、、DDLDCL、OTHER、AUTHERROR、 PREPARE。
以下是範例組態:
audit_logging_options:
    included_keyspaces: keyspace1,keyspace2
    included_categories: AUTH,ERROR,DCL,DDL
根據預設,組態會將 included_categories 設定為 AUTH,ERROR,DCL,DDL。
後續步驟
- 如需如何使用 Azure 入口網站、Azure CLI 或 PowerShell 建立診斷設定的詳細資訊,請參閱 Azure 監視器中的診斷設定。