使用 Application Insights 進行事件分析和視覺效果
Azure 監視器的組件,Application Insights 是監視和診斷應用程式的擴充式平台。 它包含強大的分析和查詢工具、可自訂的儀表板和視覺效果,以及包括自動化警示的進一步選項。 Application Insights 與 Service Fabric 的整合包括 Visual Studio 和 Azure 入口網站的工具體驗,以及 Service Fabric 特有計量,可提供完整而立即可用的記錄體驗。 Application Insights 雖然會自動為您建立和收集許多記錄,但我們建議您為應用程式新增進一步的自訂記錄,以打造更豐富的診斷體驗。
此文章可協助您解決下列常見問題:
- 我該如何知道應用程式和服務內發生的事情及收集遙測資料?
- 如何針對我的應用程式進行疑難排解,尤其是針對彼此通訊的多個服務?
- 如何取得有關服務執行方式的計量資訊,例如頁面載入時間、HTTP 要求?
本文旨在說明如何從 Application Insights 內取得見解並進行移難排解。 如果您想要了解如何透過 Service Fabric 安裝及設定 Application Insights,請參閱此教學課程。
Application Insights 中的監視功能
Application Insights 具有許多使用 Service Fabric 時可使用的現成功能。 在概觀頁面中,Application Insights 會提供您有關服務的重要資訊,例如回應時間和處理的要求數目。 按一下頂端 [搜尋] 按鈕,您可以看見應用程式中的最新要求清單。 此外,您也可以在此查看失敗的要求,並診斷可能發生哪些錯誤。
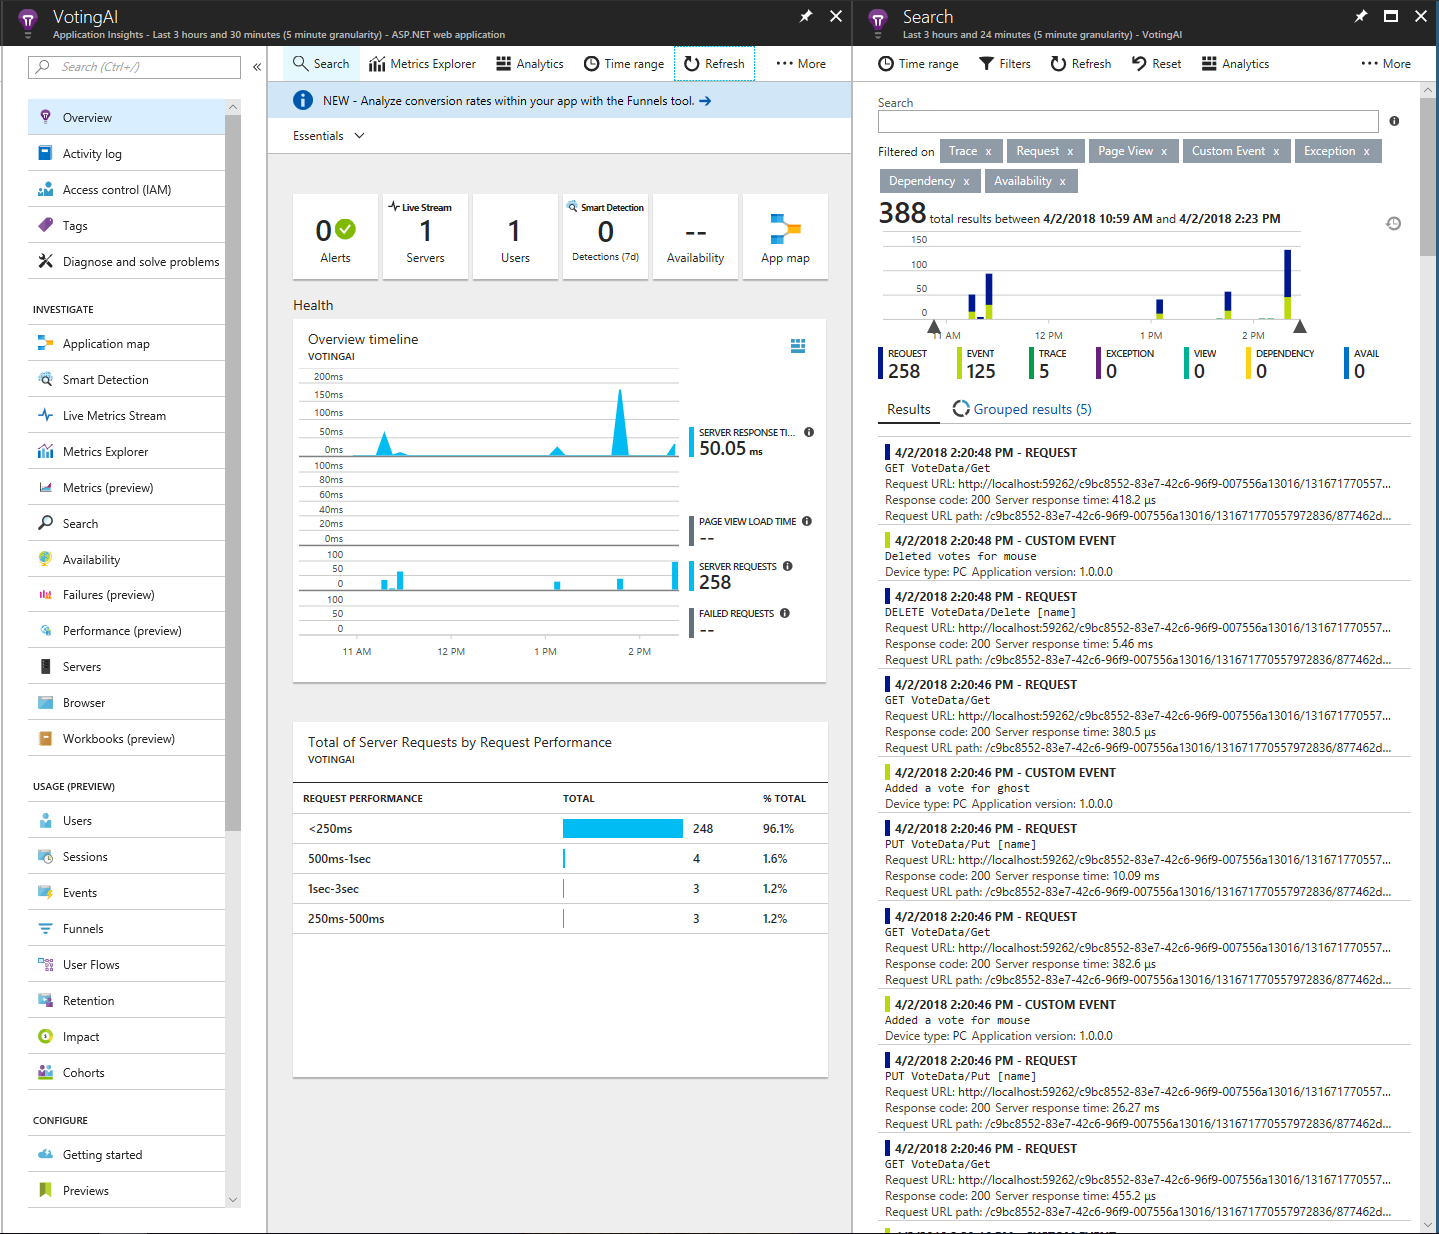
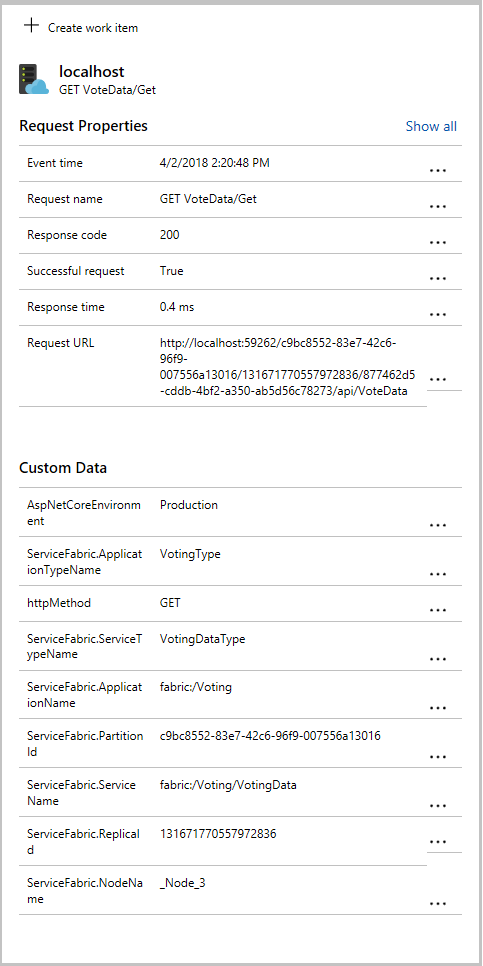
在上方影像的右側面板上,清單中有兩種類型的項目:要求和事件。 在此案例中,要求是指透過 HTTP 要求對應用程式 API 發出的呼叫,而事件是指自訂事件,您可以將其當作遙測資料新增到程式碼中的任何位置。 您可以進一步探索自訂事件和計量的 Application Insights API,來檢測應用程式。 按一下要求會顯示更多詳細資料,如下圖所示,包括收集 Application Insights Service Fabric Nuget 套件中的 Service Fabric 專屬資料。 此資訊可用於疑難排解及了解應用程式的狀態為何,而所有這些資訊都可在 Application Insights 中搜尋到
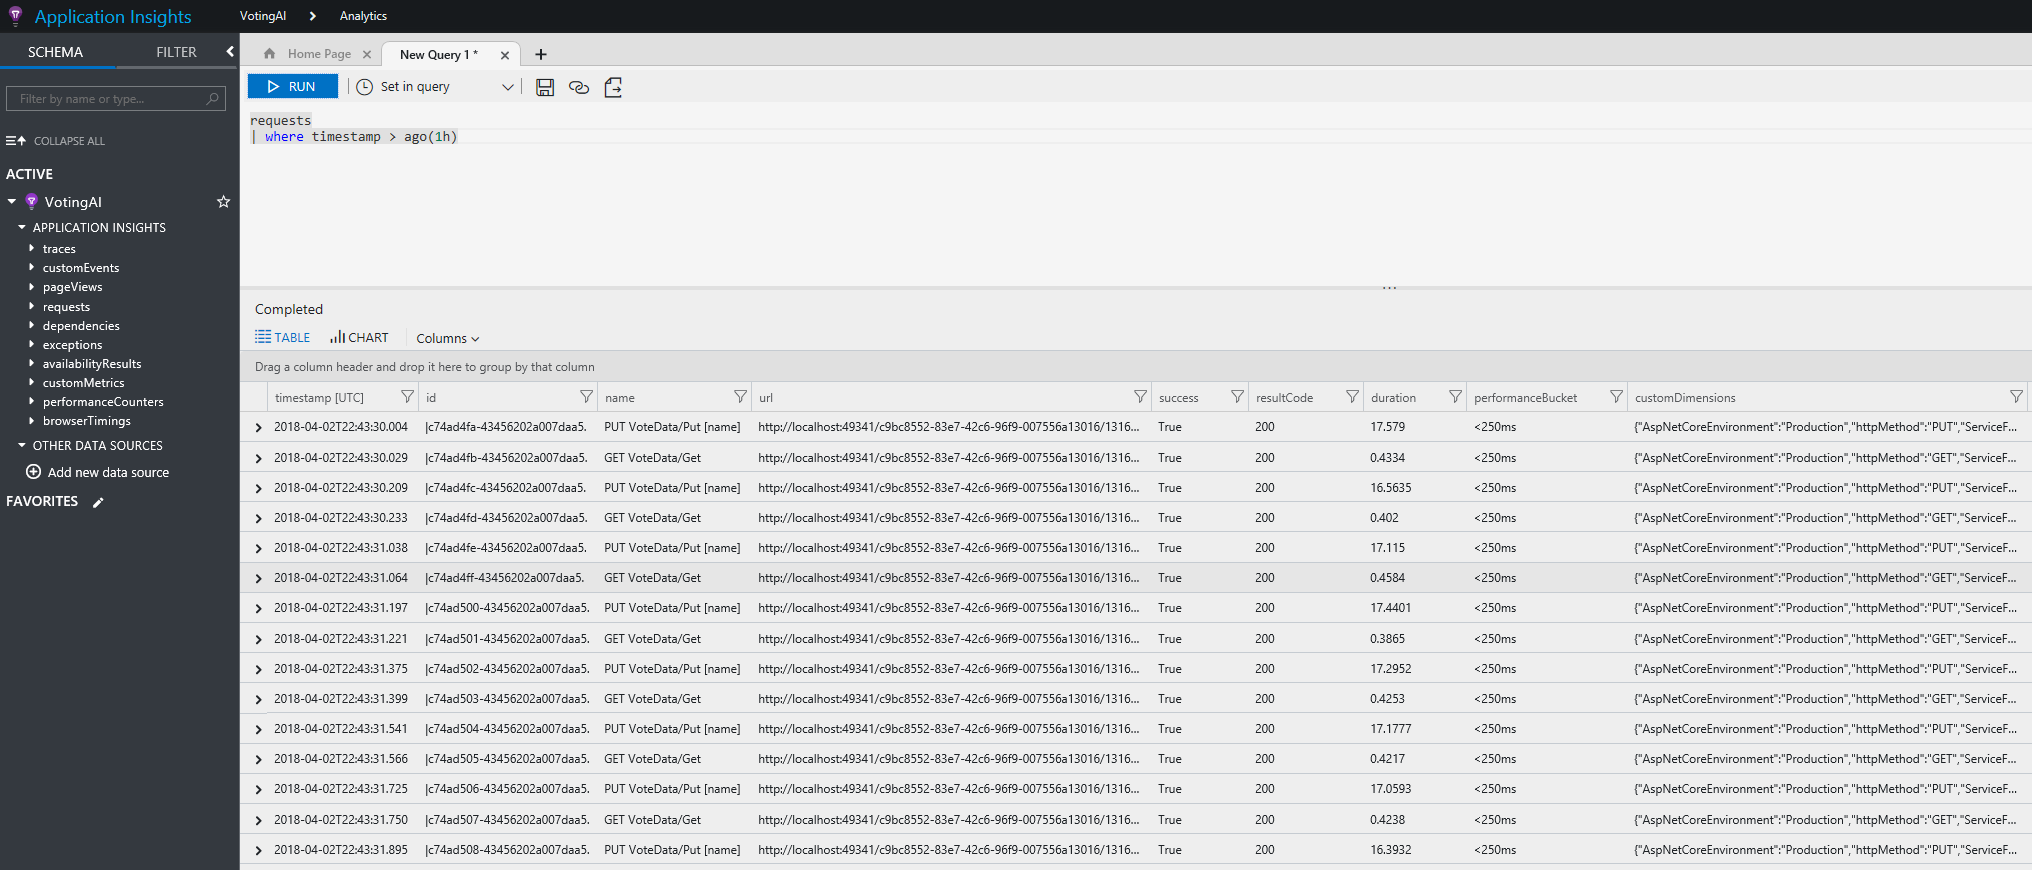
Application Insights 有用於查詢所有傳入資訊的指定檢視。 選取概觀頁面頂端的 [計量瀏覽器] 以瀏覽至 Application Insights 入口網站。 在此,您可以使用 Kusto 查詢語言對先前所述的自訂事件、要求、例外狀況、效能計數器和其他計量執行查詢。 下列範例會顯示過去 1 小時內的所有要求。
若要進一步探索 Application Insights 入口網站的功能,請前往 Application Insights 入口網站文件。
使用 EventFlow 設定 Application Insights
如要使用 EventFlow 來彙總事件,請務必匯入 Microsoft.Diagnostics.EventFlow.Outputs.ApplicationInsightsNuGet 套件。 eventFlowConfig.json 的 [輸出] 區段中必須有以下程式碼:
"outputs": [
    {
        "type": "ApplicationInsights",
        "instrumentationKey": "***ADD INSTRUMENTATION KEY HERE***"
    }
]
請務必在您的篩選中進行必要的變更,以及包含任何其他輸入 (以及其個別的 NuGet 套件)。
Application Insights SDK
建議使用 EventFlow 和 WAD 做為彙總解決方案,因為它們允許以更接近模組化的方法來診斷和監視,亦即,如果您想要變更來自 EventFlow 的輸出,不必變更實際的檢測,只要簡單修改組態檔即可。 如果決定投資使用 Application Insights,而且不太可能變更到不同的平台,您應該考慮使用 Application Insights 的新 SDK 來彙總事件,並將它們傳送到 Application Insights。 這表示您不必再設定 EventFlow 將資料傳送至 Application Insights,而是改為安裝 ApplicationInsight 的 Service Fabric NuGet 套件。 套件的詳細資訊位於這裡。
微服務與容器的 Application Insights 支援會顯示一些開發中的新功能 (目前仍為 beta 版),讓您有更多的 Application Insights 立即可用監視選項。 包括相依性追蹤 (用於建置叢集中所有服務和應用程式的 AppMap 及它們之間的通訊),以及來自服務的追蹤有更好的相互關聯 (更有助於查明應用程式或服務工作流程中的問題)。
如果您是在 .NET 中進行開發,可能會使用一些 Service Fabric 的程式設計模型,而且是願意使用 Application Insights 做視覺化和分析事件和記錄檔資料的平台,我們建議您在監視和診斷工作流程時透過 Application Insights SDK 路由。 請閱讀 Application Insights 文件和追蹤記錄文件,以開始使用 Application Insights 來收集和顯示記錄。
在 Azure 入口網站中瀏覽 Application Insights 資源
一旦將 Application Insights 設定為事件和記錄的輸出,資訊就會在幾分鐘內開始出現在 Application Insights 資源中。 瀏覽至 Application Insights 資源,它會帶您到 Application Insights 資源儀表板。 選取 Application Insights 工作列的 [搜尋],可查看它接收到的最新追蹤,並可從中進行篩選。
計量瀏覽器是很有用的工具,它可根據應用程式、服務和叢集可能報告的計量,建立自訂的儀表板。 請參閱在 Application Insights 中探索計量,根據您所收集的資料自行設定幾個圖表。
按一下 [分析] 會帶您到 Application Insights 的 Analytics 入口網站中,您可以在這裡查詢更大範圍和選擇性的事件和追蹤。 在 Application Insights 的 Analytics 中了解更多。
下一步
- 在 AI 中設定警示以收到效能或使用方式的變更通知
- Application Insights 的智慧偵測會對傳送至 Application Insights 的遙測資料執行主動式分析,對可能的效能問題提出警告