在本教學課程中,您將瞭解如何使用 Microsoft Fabric 來準備、載入及建立 Power BI 報告的模型數據。 您將使用 Dataflows Gen2 將數據內嵌並轉換成 Lakehouse、使用管線協調數據重新整理,以及使用 Direct Lake 模式建置維度模型。 最後,您會自動產生報表,以可視化最新的銷售數據。
完成本教學課程時,您將能夠:
- 準備資料並將資料載入到 Lakehouse
- 協調數據管線以重新整理數據,並在失敗時傳送電子郵件
- 在 Lakehouse 中建立語意模型
- 使用快速建立來自動建立報表
必要條件
開始之前,請確定您有下列專案:
- 如果您尚未啟用,請為組織啟用 Fabric。
- 如果您沒有存取權,請註冊免費試用。
- 建立新工作區 (部分機器翻譯),並指派 Fabric 容量。 您可以使用現有的工作區,但本教學課程建議使用非生產工作區。
- 下載 Power Query 範本 檔案,其中包含 Contoso 資料的範例查詢。
建立 Lakehouse 以儲存資料
首先,建立 Lakehouse 來儲存您的數據。 您將使用 Dataflows Gen2 來準備和轉換資料,並使用管線來安排定期刷新以及協調電子郵件通知。
在您的工作區中,選取頁面頂端的 [ 新增專案 ]。
![在工作區中選取 [新增專案] 的螢幕快照。](media/fabric-get-started/new-item.png)
在 [ 新增 專案建立] 畫面上,搜尋或選取 [Lakehouse]。
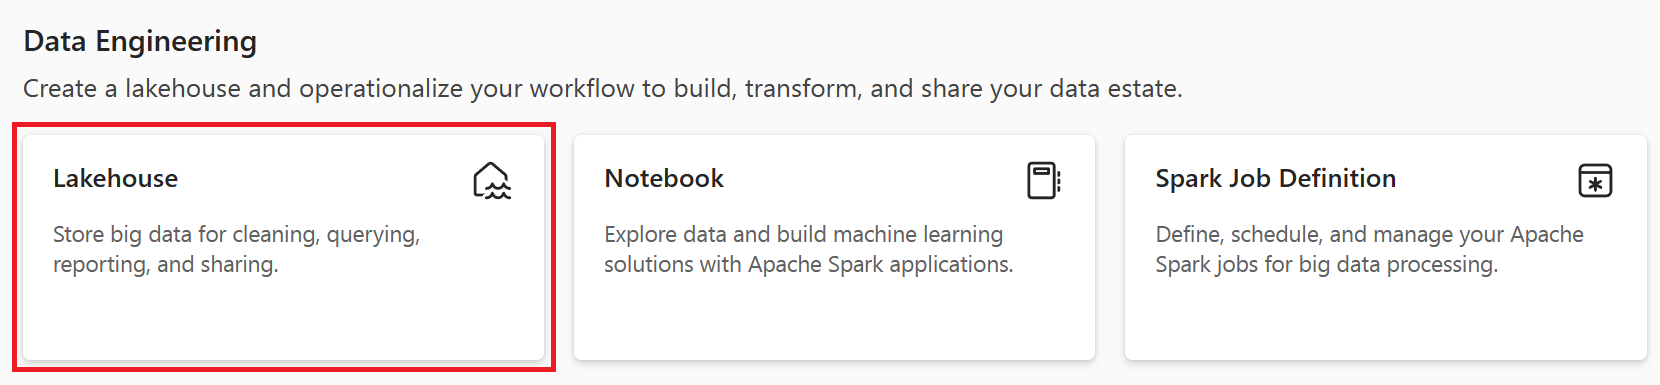
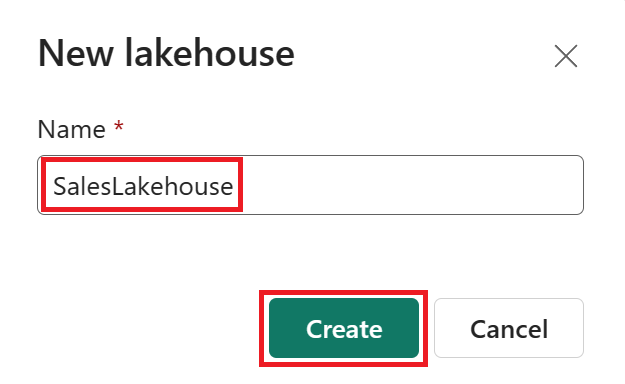
輸入 SalesLakehouse 作為名稱(名稱可以包含字母、數位和底線,但不是特殊字元或空格),然後選取 [建立]。
在 Lakehouse 編輯器中,從功能區選取 [新增數據流 Gen2 ]。
注意
或者,從功能區選取 [ 取得數據 ],然後選擇 [ 新增數據流 Gen2]。
![顯示 [取得數據] 下拉式清單的螢幕快照,其中已醒目提示 [新增數據流 Gen2]。](media/fabric-get-started/new-dataflow-gen2.png)
將數據流命名為 OnlineSalesDataflow (只使用字母、數位和底線),然後選取 [ 建立]。
使用 Dataflows Gen2 準備資料並將其載入 Lakehouse
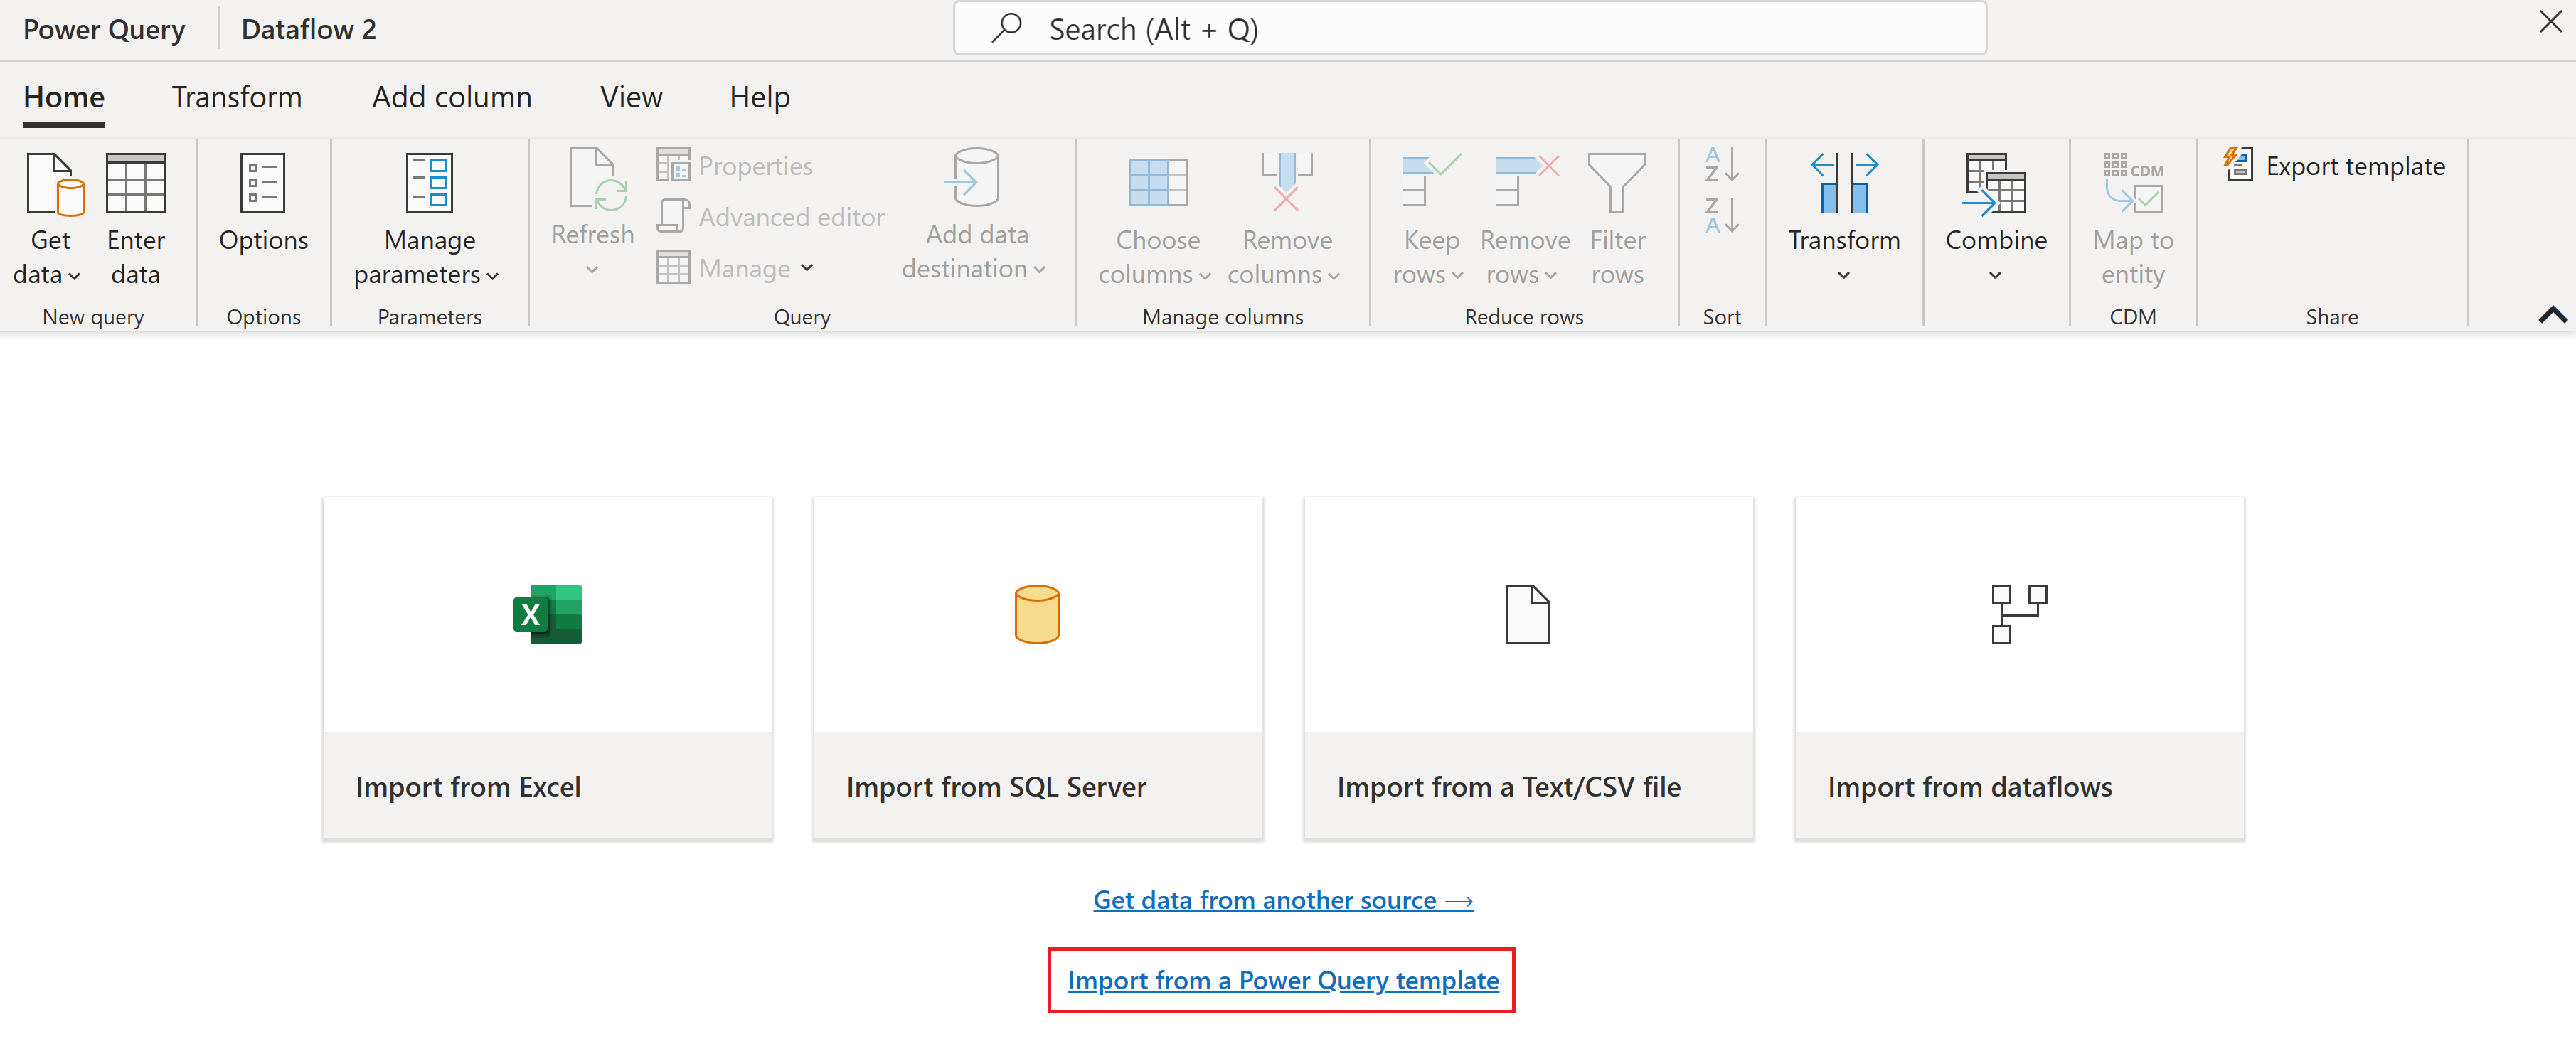
在數據流 Gen2 的 Power Query Online 編輯器中,從 Power Query 樣本選取 [匯入],然後選擇您在必要條件中下載的 ContosoSales.pqt 範本檔案。
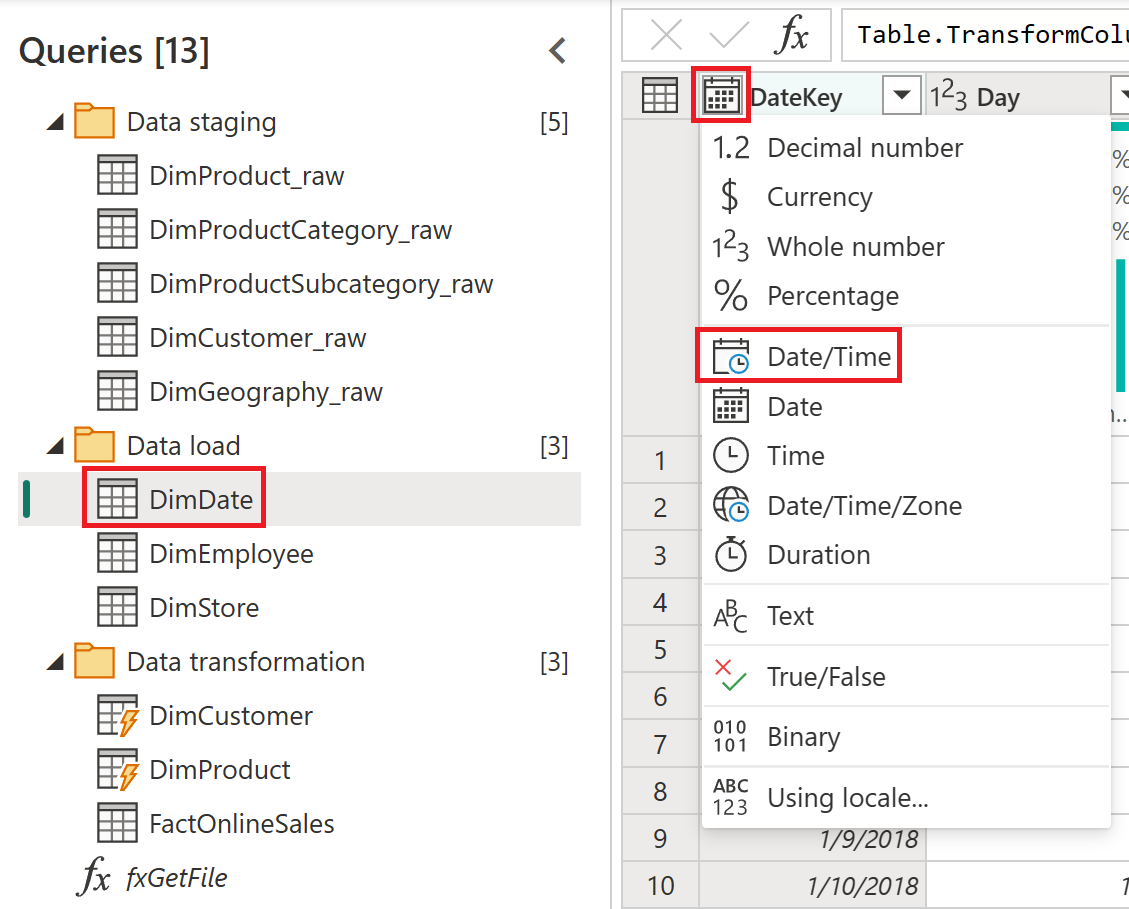
選取 [數據載入] 群組底下的 DimDate 查詢。 如果出現提示,請選取 [ 設定連線]、將驗證設定為 [匿名],然後選取 [ 聯機]。
選取 DimDate 之後,在數據預覽中尋找 DateKey 數據行。 選取資料行標頭中的數據類型圖示,然後從下拉式清單中選擇 [日期/時間 ]。
在 [ 變更數據行類型 ] 視窗中,選取 [ 取代目前]。
設定數據目的地
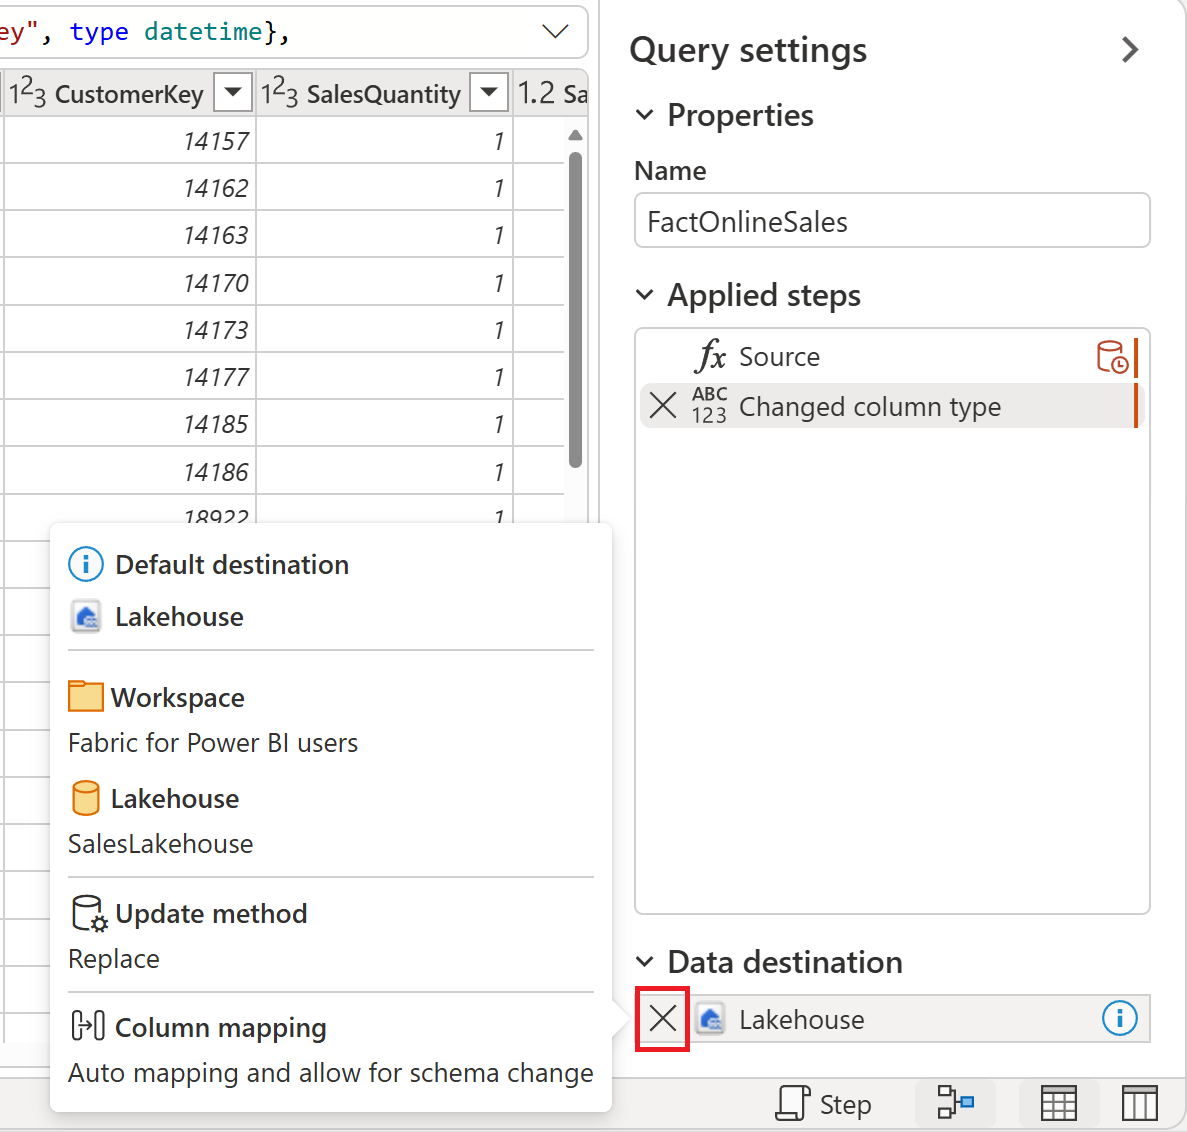
選取 DimDate 之後,請檢閱右下角的數據目的地設定。 將滑鼠停留在設定的 Lakehouse 上,以檢視其屬性。
您所建立的 Lakehouse 是所有資料表的最終目的地。 默認更新方法為 Replace,會在每次重新整理期間覆寫先前的數據。
![[資料目的地] 區段和組態選項的螢幕快照。](media/fabric-get-started/default-destination.png)
選取 FactOnlineSales 數據表,並檢閱其數據目的地設定。
因為 FactOnlineSales 來源經常變更,因此藉由附加新數據來優化重新整理。 選取 X 圖示來移除其目前的數據目的地。 請勿移除其他數據表的目的地。
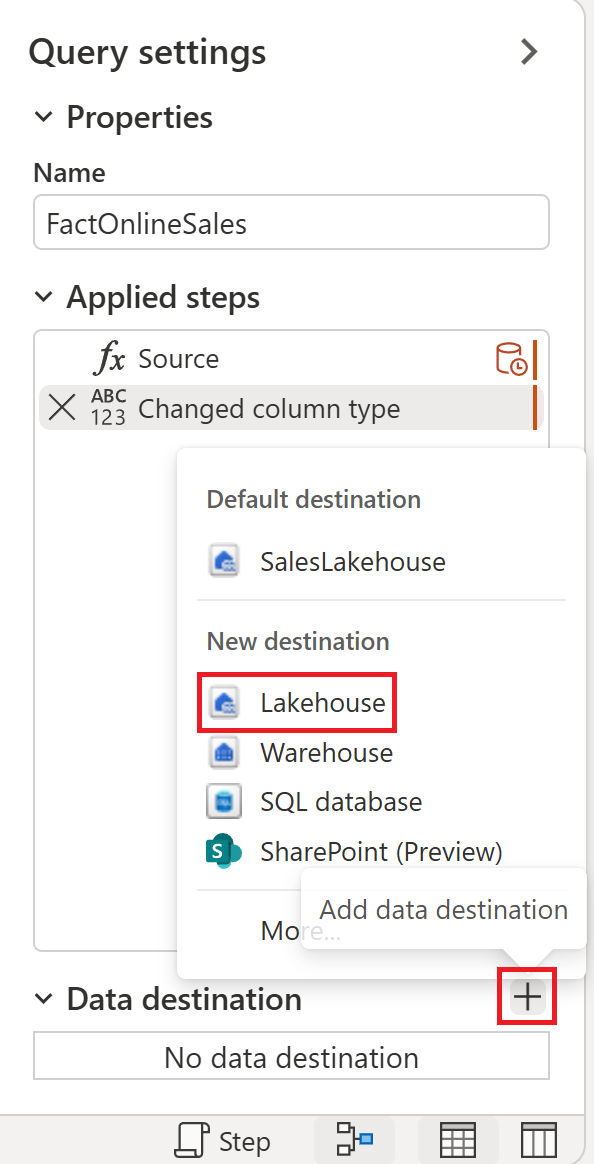
保持選取 FactOnlineSales,然後選取 + 圖示以新增數據目的地,接著選擇 Lakehouse。
如果出現提示,請將驗證設定為 [組織帳戶 ],然後選取 [ 下一步]。
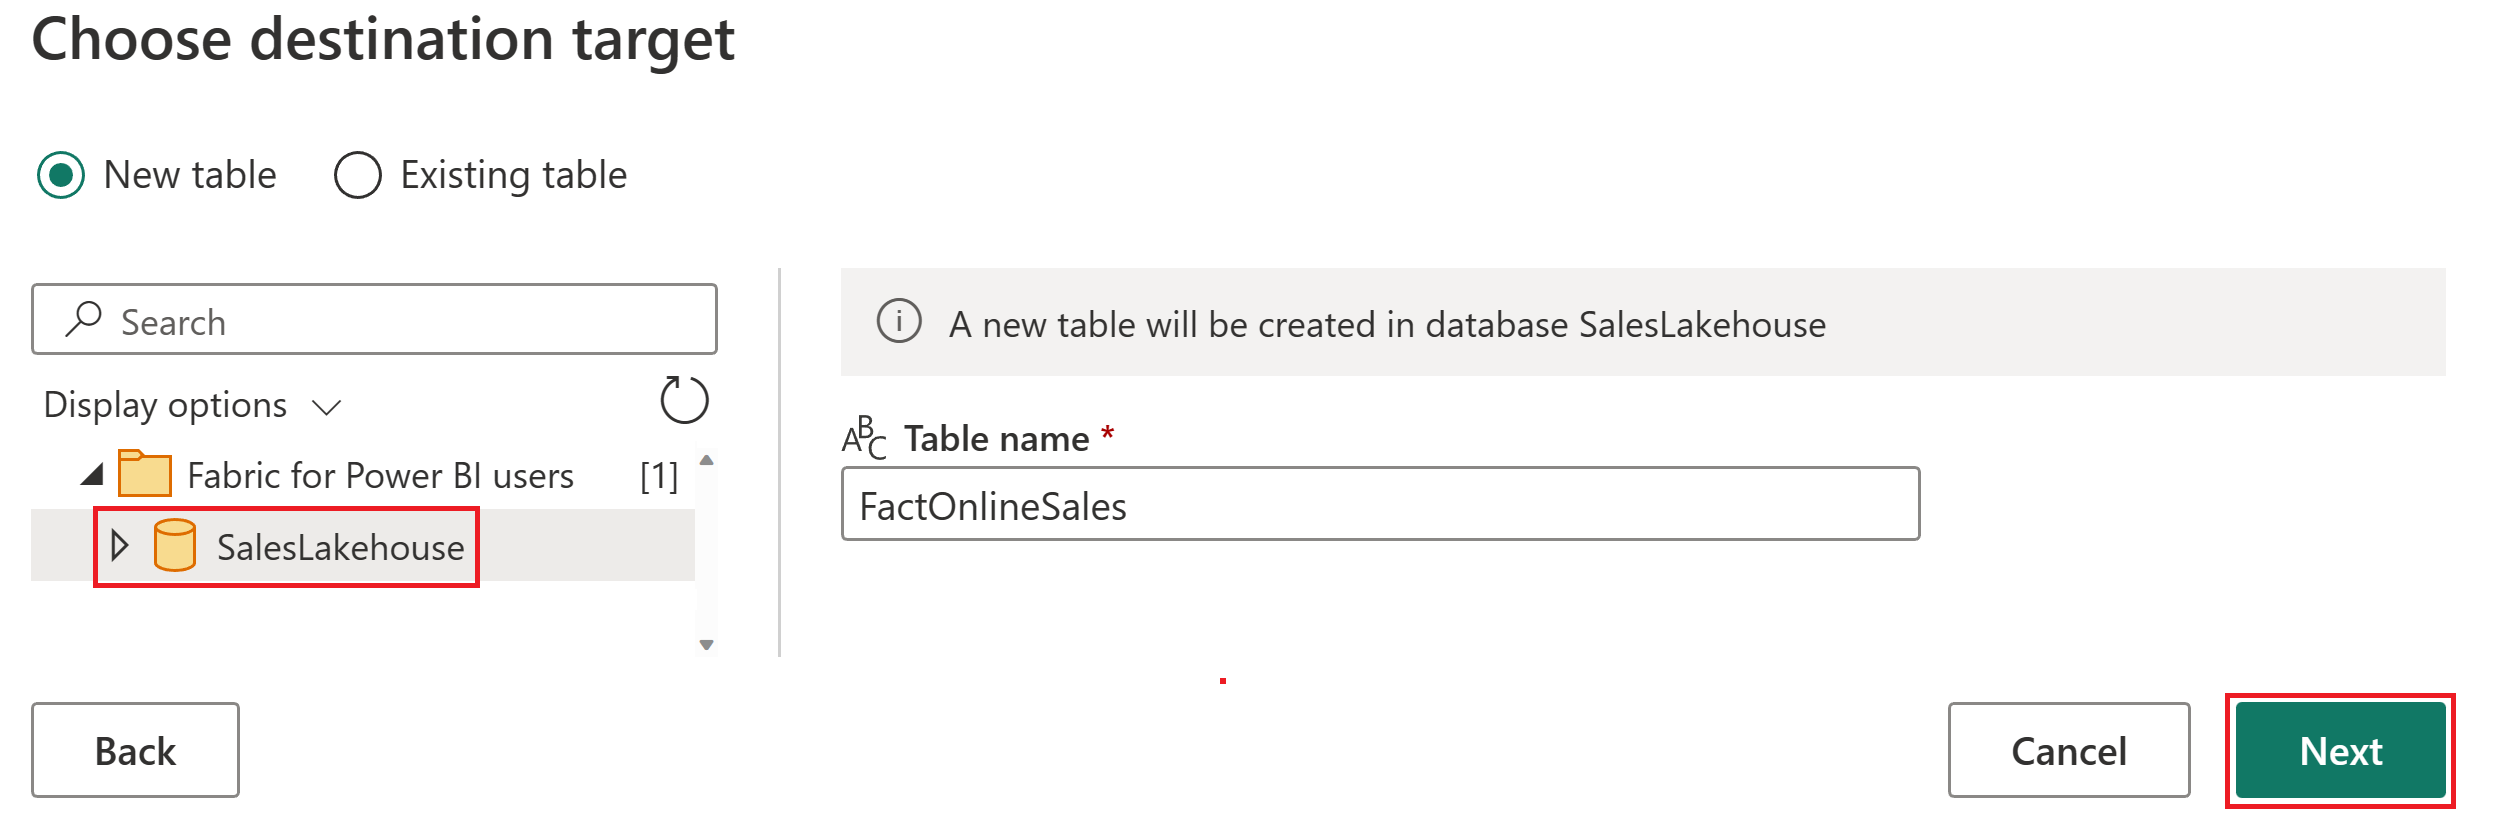
在導覽器中,選取您的工作區並展開以檢視所有 Lakehouse 專案。 選取 [SalesLakehouse ],並確定已選取 [新增數據表 ],然後選取 [ 下一步]。
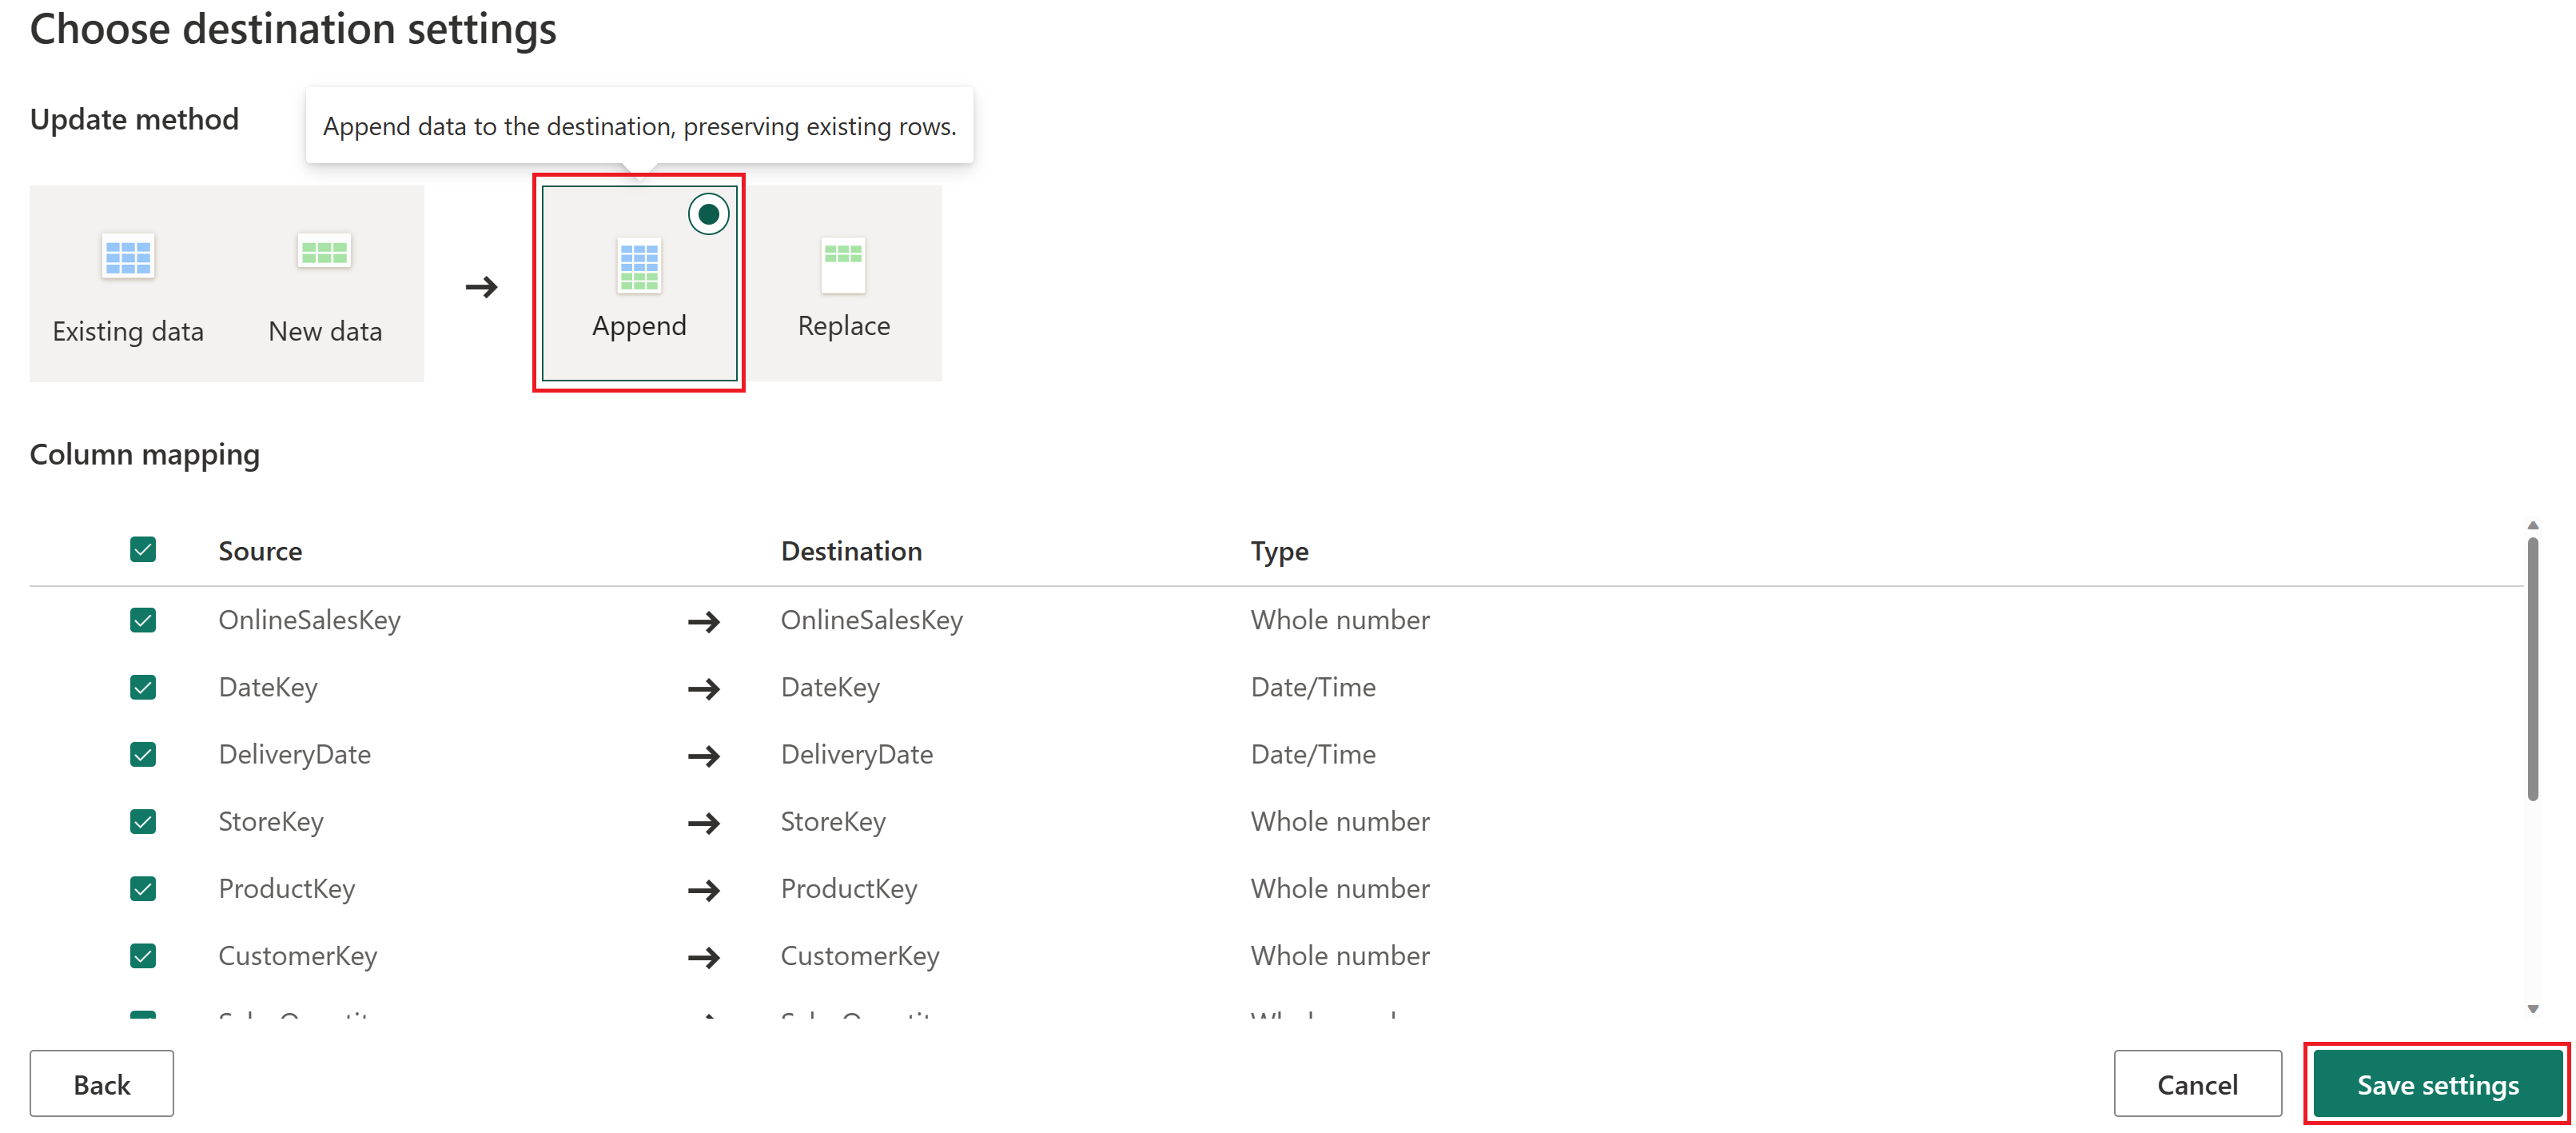
在 [數據目的地設定] 面板中,清除 [ 使用自動設定]、將 [更新方法] 設定為 [附加],然後選取 [ 儲存設定]。
注意
Append 方法會在每次重新整理期間,將新的數據列新增至數據表,並保留現有的數據。
從 [ 首頁] 索引標籤中,選取 [ 儲存並執行]。
![Power Query Online 內 [儲存並執行] 按鈕的螢幕快照。](media/fabric-get-started/save-and-run.png)
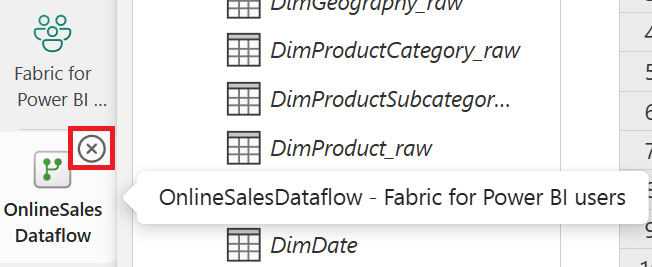
若要結束Power Query Online 編輯器,請選取左側滑軌中 OnlineSalesDataflow 專案上的 X。
注意
選取 X 會關閉編輯器,但不會刪除資料流。
協調資料管線
透過傳送具有重要詳細數據的自定義 Outlook 電子郵件,自動重新整理資料流並處理錯誤。
在您的工作區中,選取 [新增專案]。
在 [ 新增 專案建立] 畫面上,搜尋或選取 [數據管線]。
![選取 [數據管線] 作為新項目的螢幕快照。](media/fabric-get-started/new-item-data-pipeline.png)
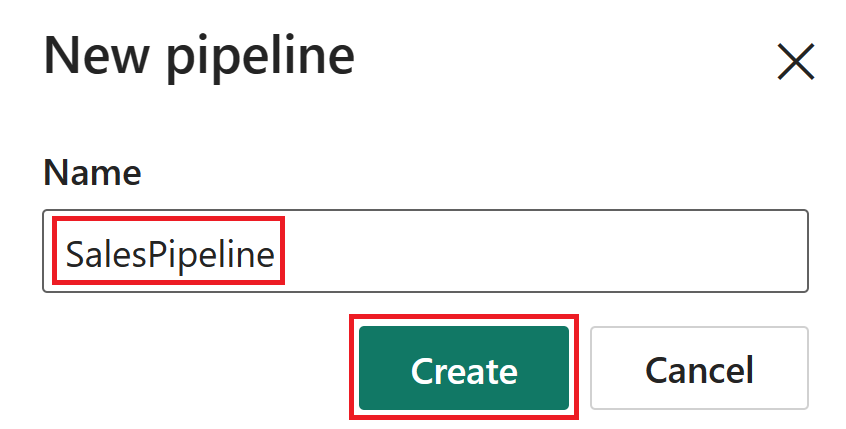
將管線命名為 SalesPipeline ,然後選取 [建立]。
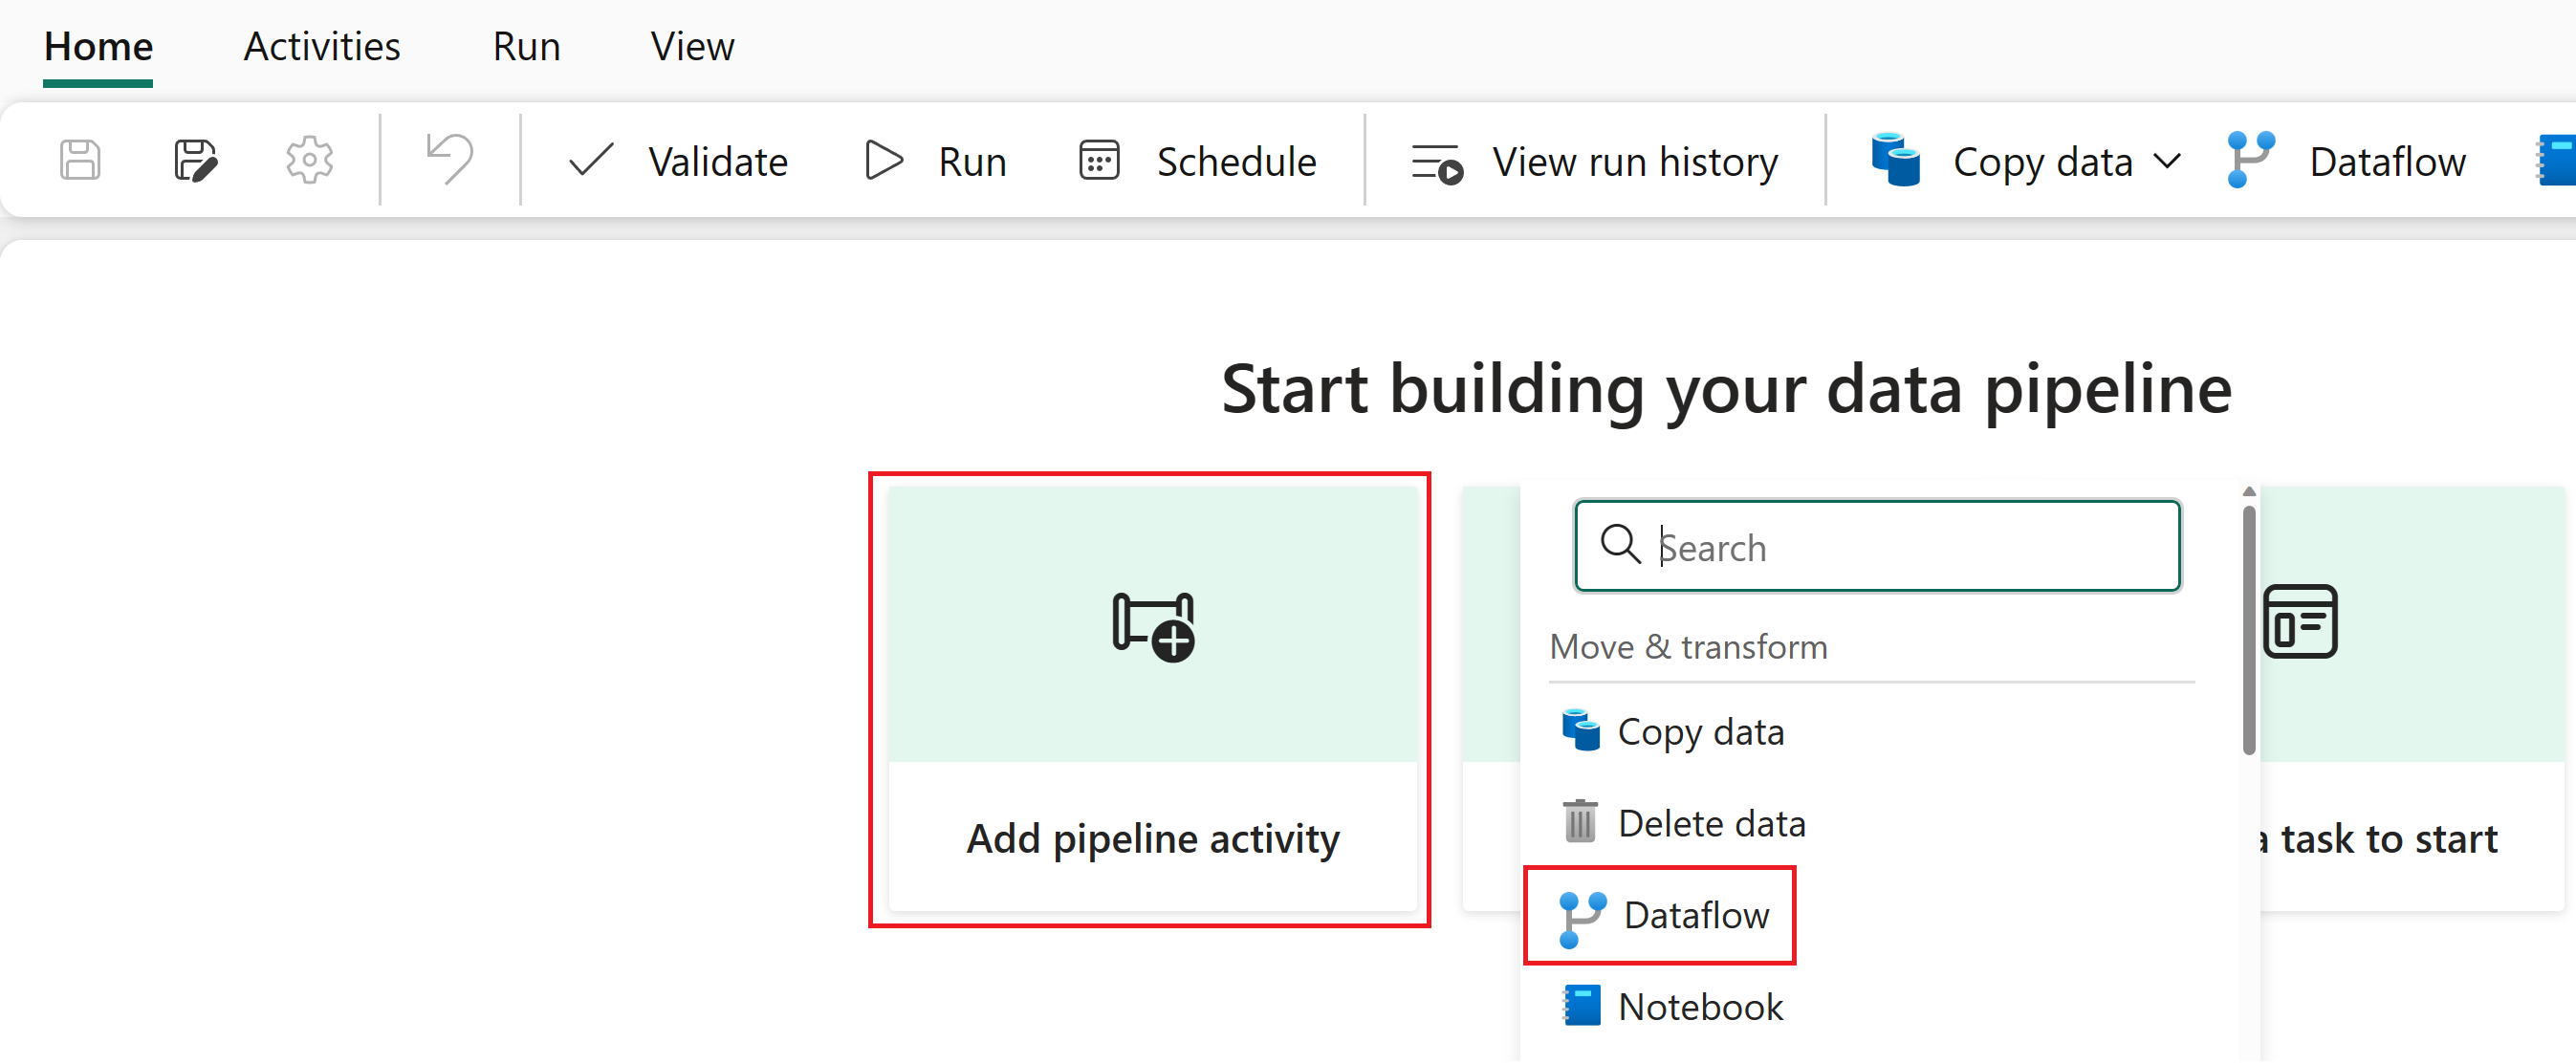
在管線編輯器中,選取 [ 管線活動],然後選擇 [ 數據流]。
注意
您也可以從功能區選取 [資料流程]。
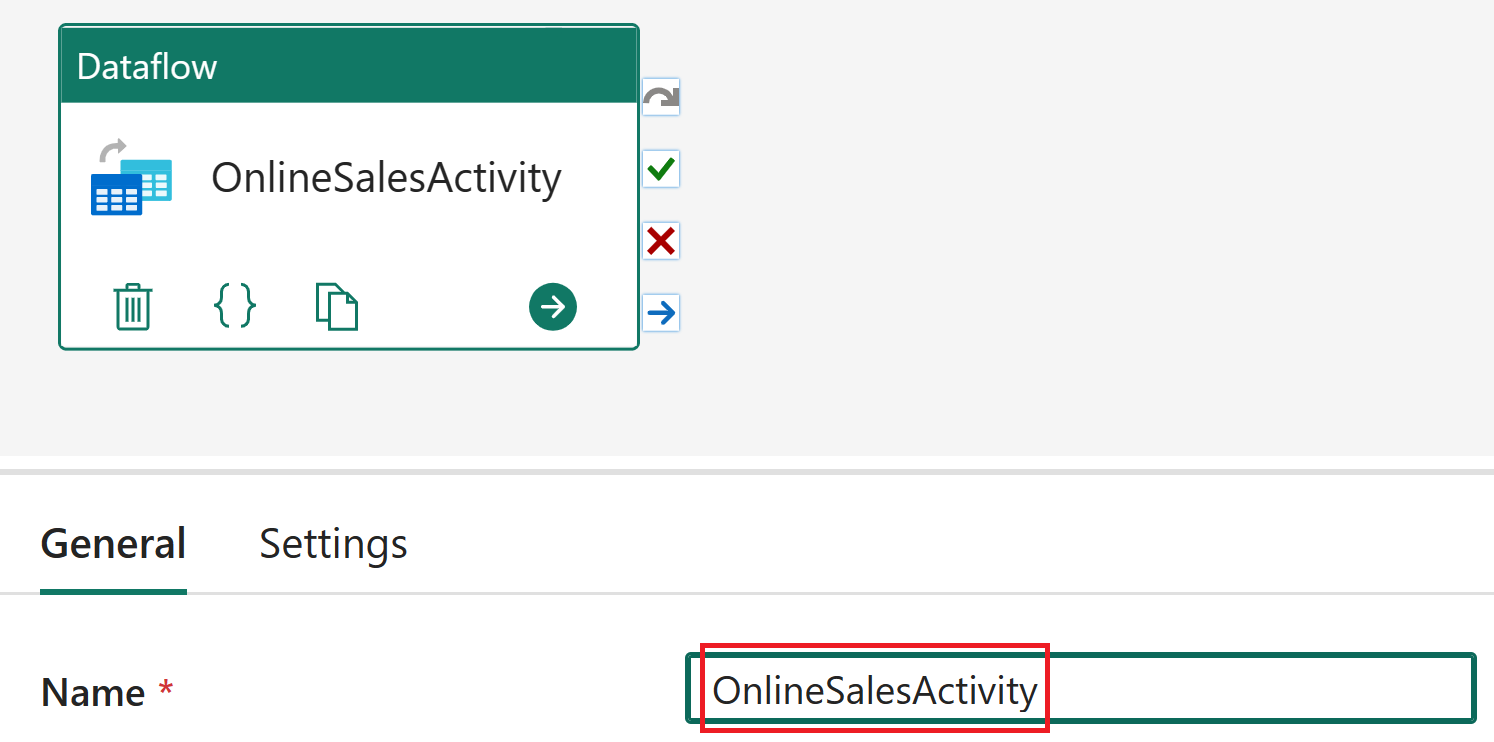
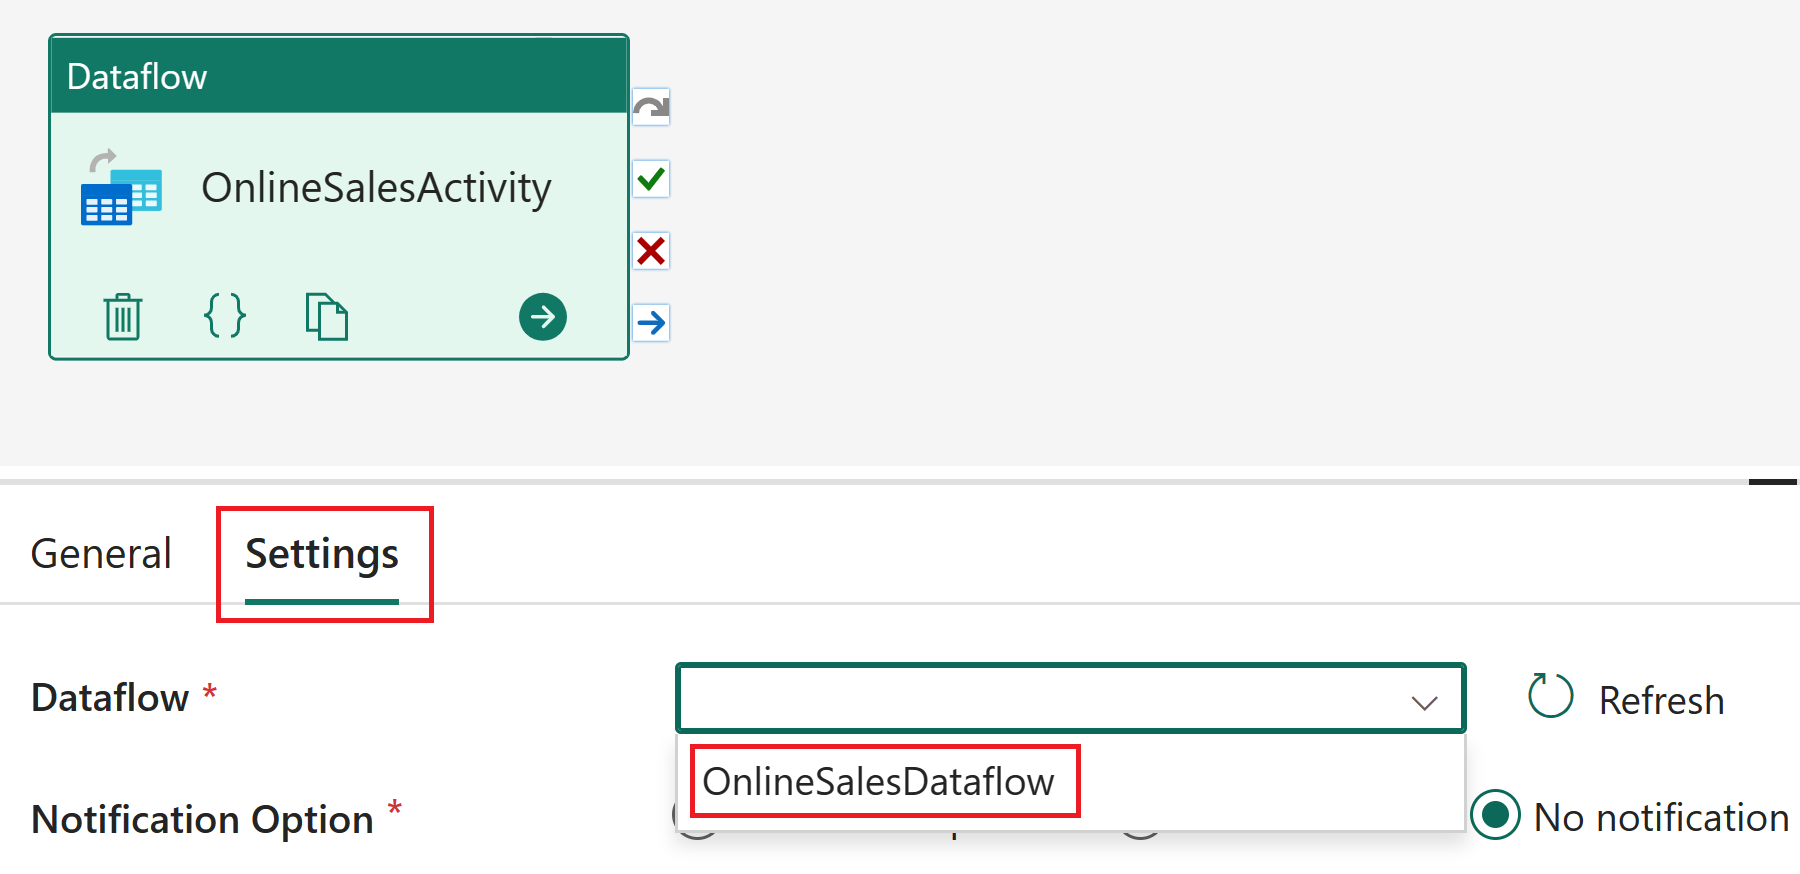
在管線編輯器中選取數據流活動。 在 [ 一般] 區段中,將 [名稱 ] 設定為 OnlineSalesActivity。
選取數據流活動后,移至 [ 設定 ],然後從 [數據流] 列表中選擇 [OnlineSalesDataflow ]。 如有需要,請選取 [ 重新 整理] 圖示以更新清單。
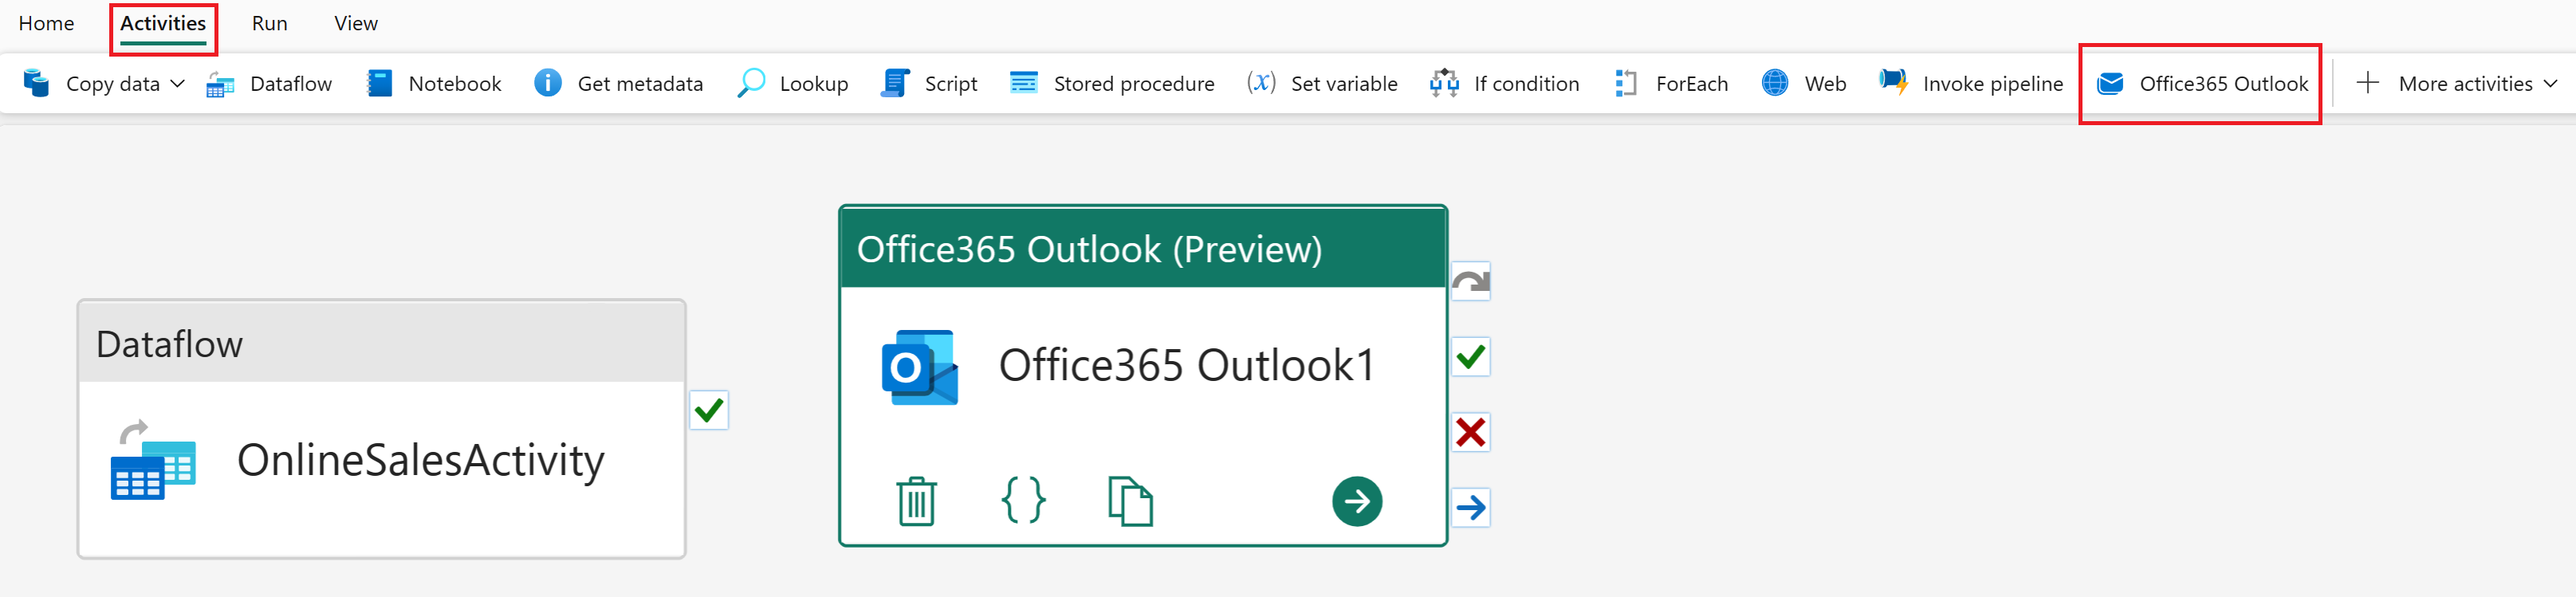
選取 [ 活動] 索引標籤,然後新增 Office365 Outlook 活動。
注意
如果出現 [授與同意 ] 視窗的提示,請選取 [ 確定]、使用您的組織帳戶登入,並允許存取。
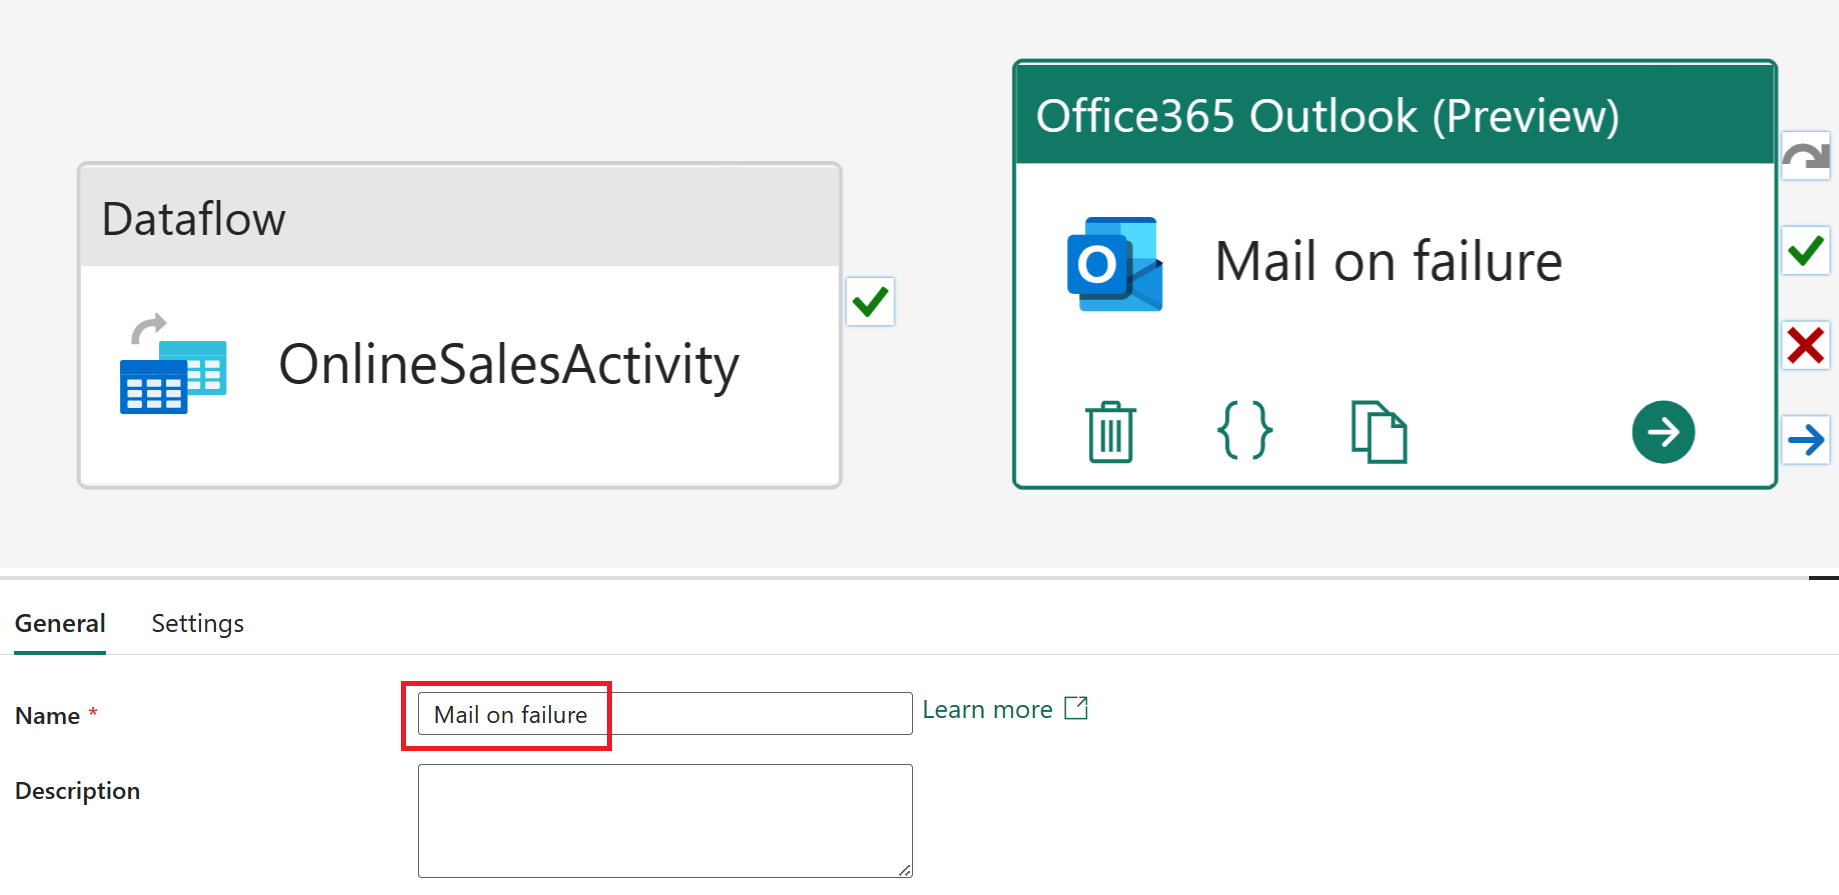
在管線編輯器中選取 Office365 Outlook 活動。 在 [ 一般] 區段中,將 [ 名稱 ] 設定為 [失敗時的郵件]。
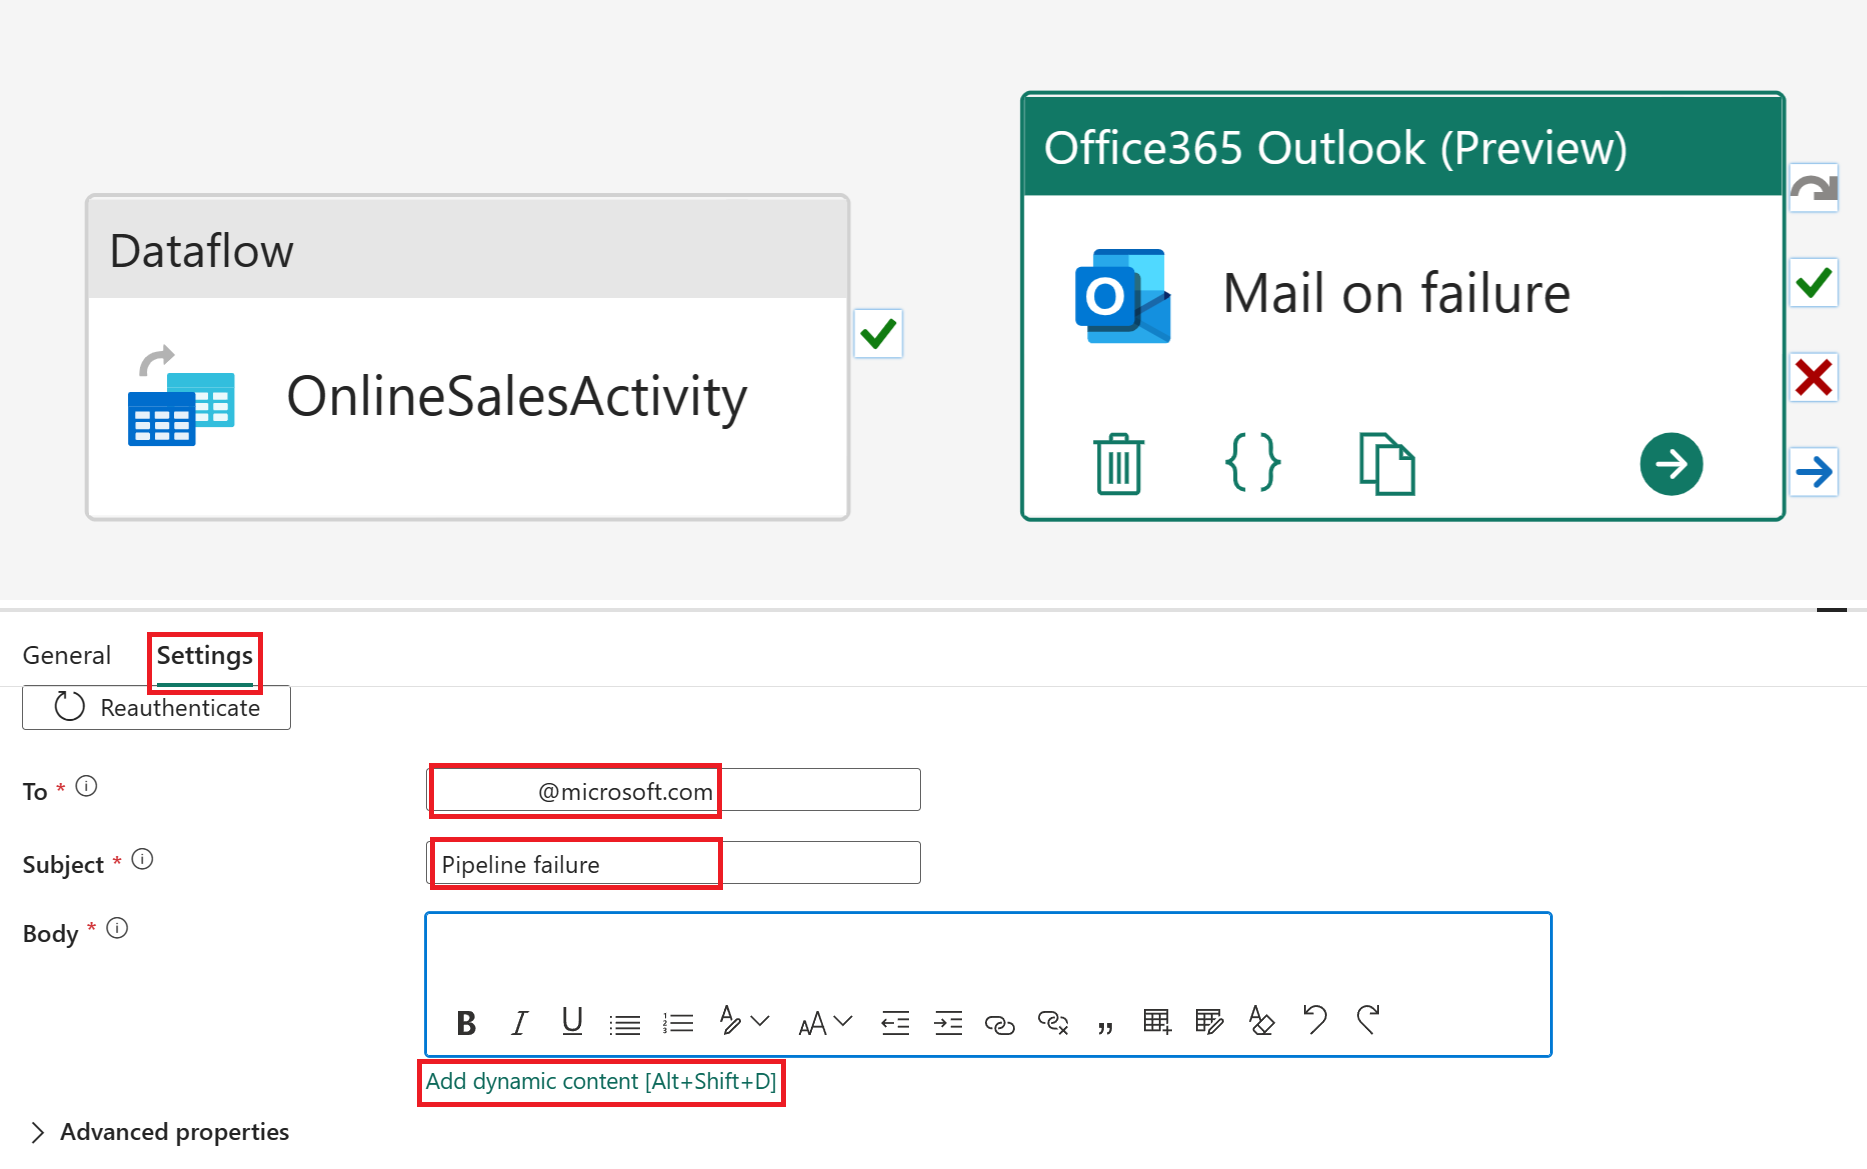
選取 Office365 Outlook 活動后,移至 [ 設定]。 在 收件者 欄位中輸入您的電子郵件地址,並將 主旨 設定為 管線錯誤。 針對郵件 本文,選擇在 表示式產生器中檢視。
注意
進階屬性中提供的其他電子郵件選項有: 寄件者(以... 的名義發送)、副本、密件抄送和敏感度標籤。
在 [管線表達式產生器] 中,將下列表達式貼到頁面頂端的文字塊中:
@concat(
    'Pipeline: '
    , pipeline().PipelineId
    , '<br>'
    , 'Workspace: '
    , pipeline().WorkspaceId
    , '<br>'
    , 'Time: '
    , utcnow()
)
此表達式會動態將管線標識碼、工作區標識碼和目前的UTC時間插入電子郵件本文中。
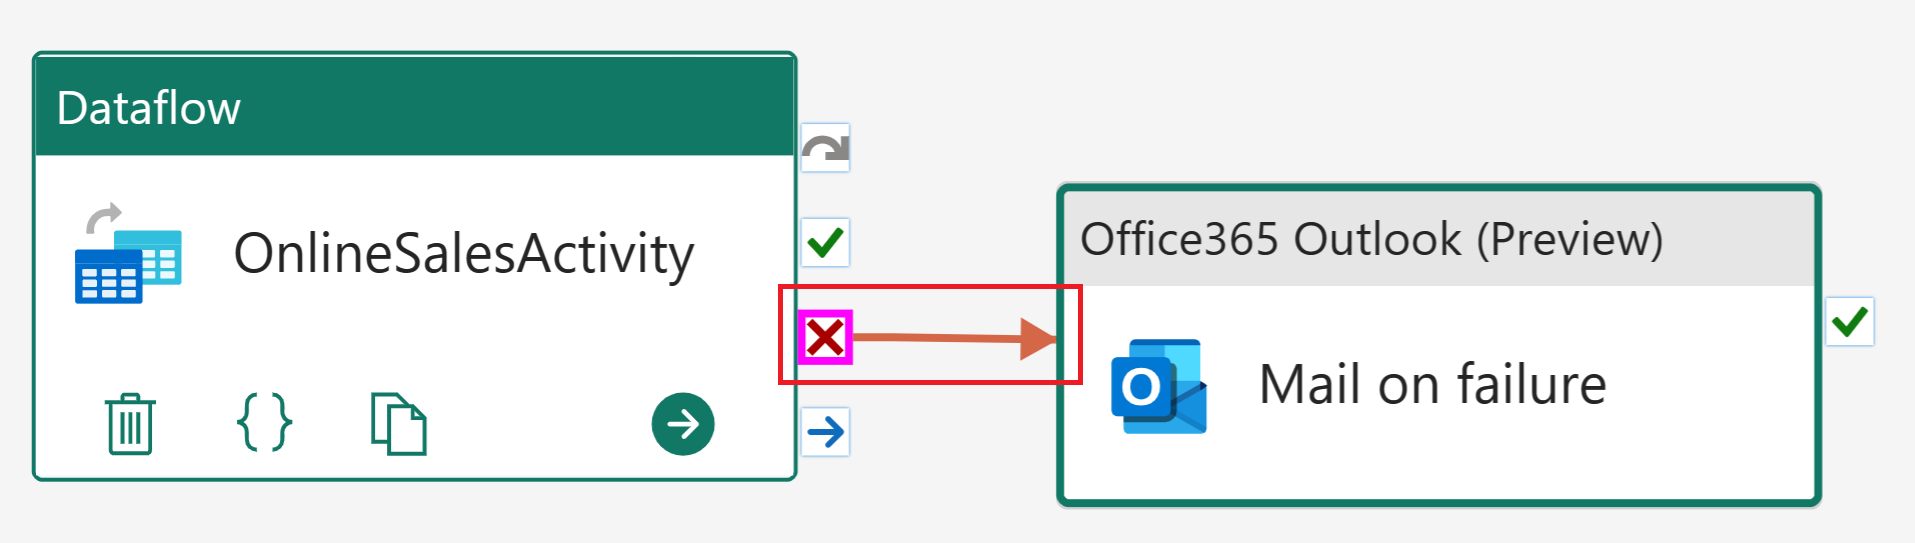
在管線編輯器中,選取 [OnlineSalesActivity]。 從 「X」 (On fail) 句柄拖曳,然後將它放入 [失敗時的郵件] 活動。 這可確保如果數據流活動失敗,就會傳送電子郵件。
從 [首頁] 索引標籤中,選取 [排程]。 如下所示設定排程,然後選取 [ 套用]:
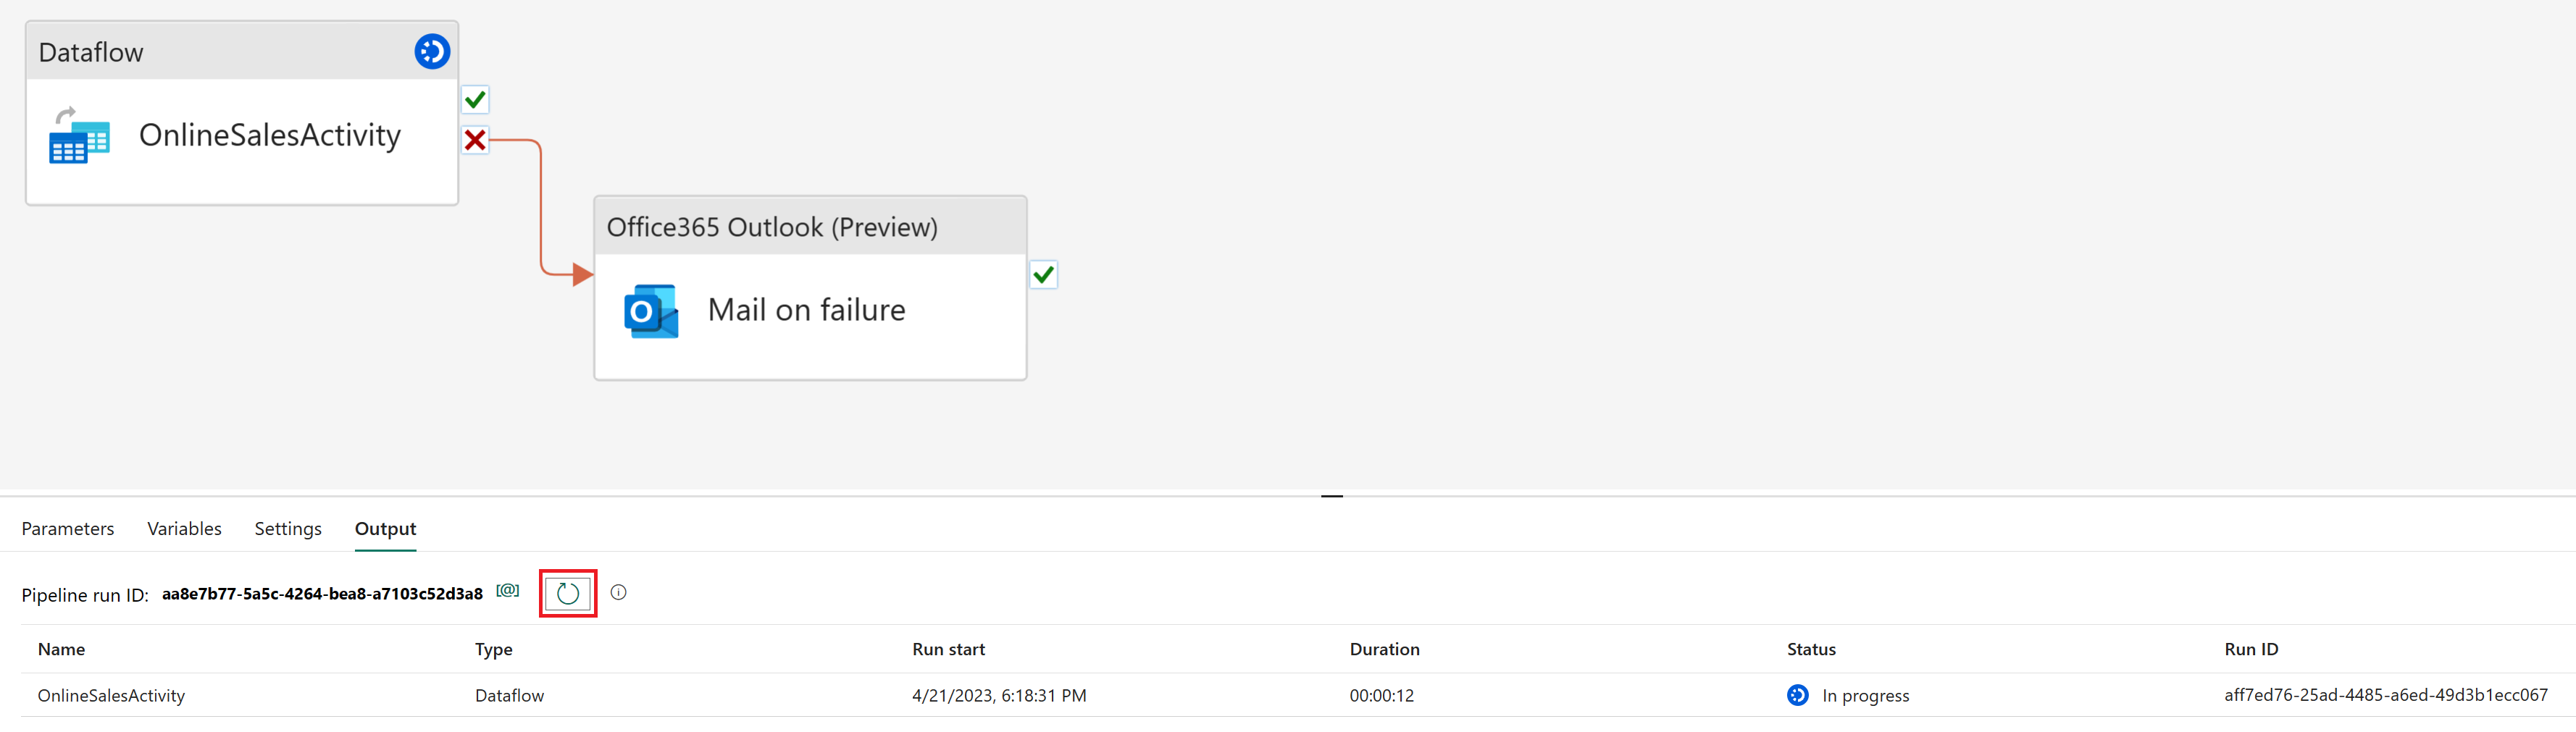
名稱 值 已排程的執行 另一 重複 每日 時間 當時或之後 從 [首頁] 索引標籤中,選取 [執行]。 如果出現提示,請選取 [ 儲存並執行 ] 以繼續。
若要監視管線的狀態,請檢視 [輸出 ] 資料表,以顯示活動進度。 數據表會自動重新整理,或者您可以選取重新整理圖示以手動更新。
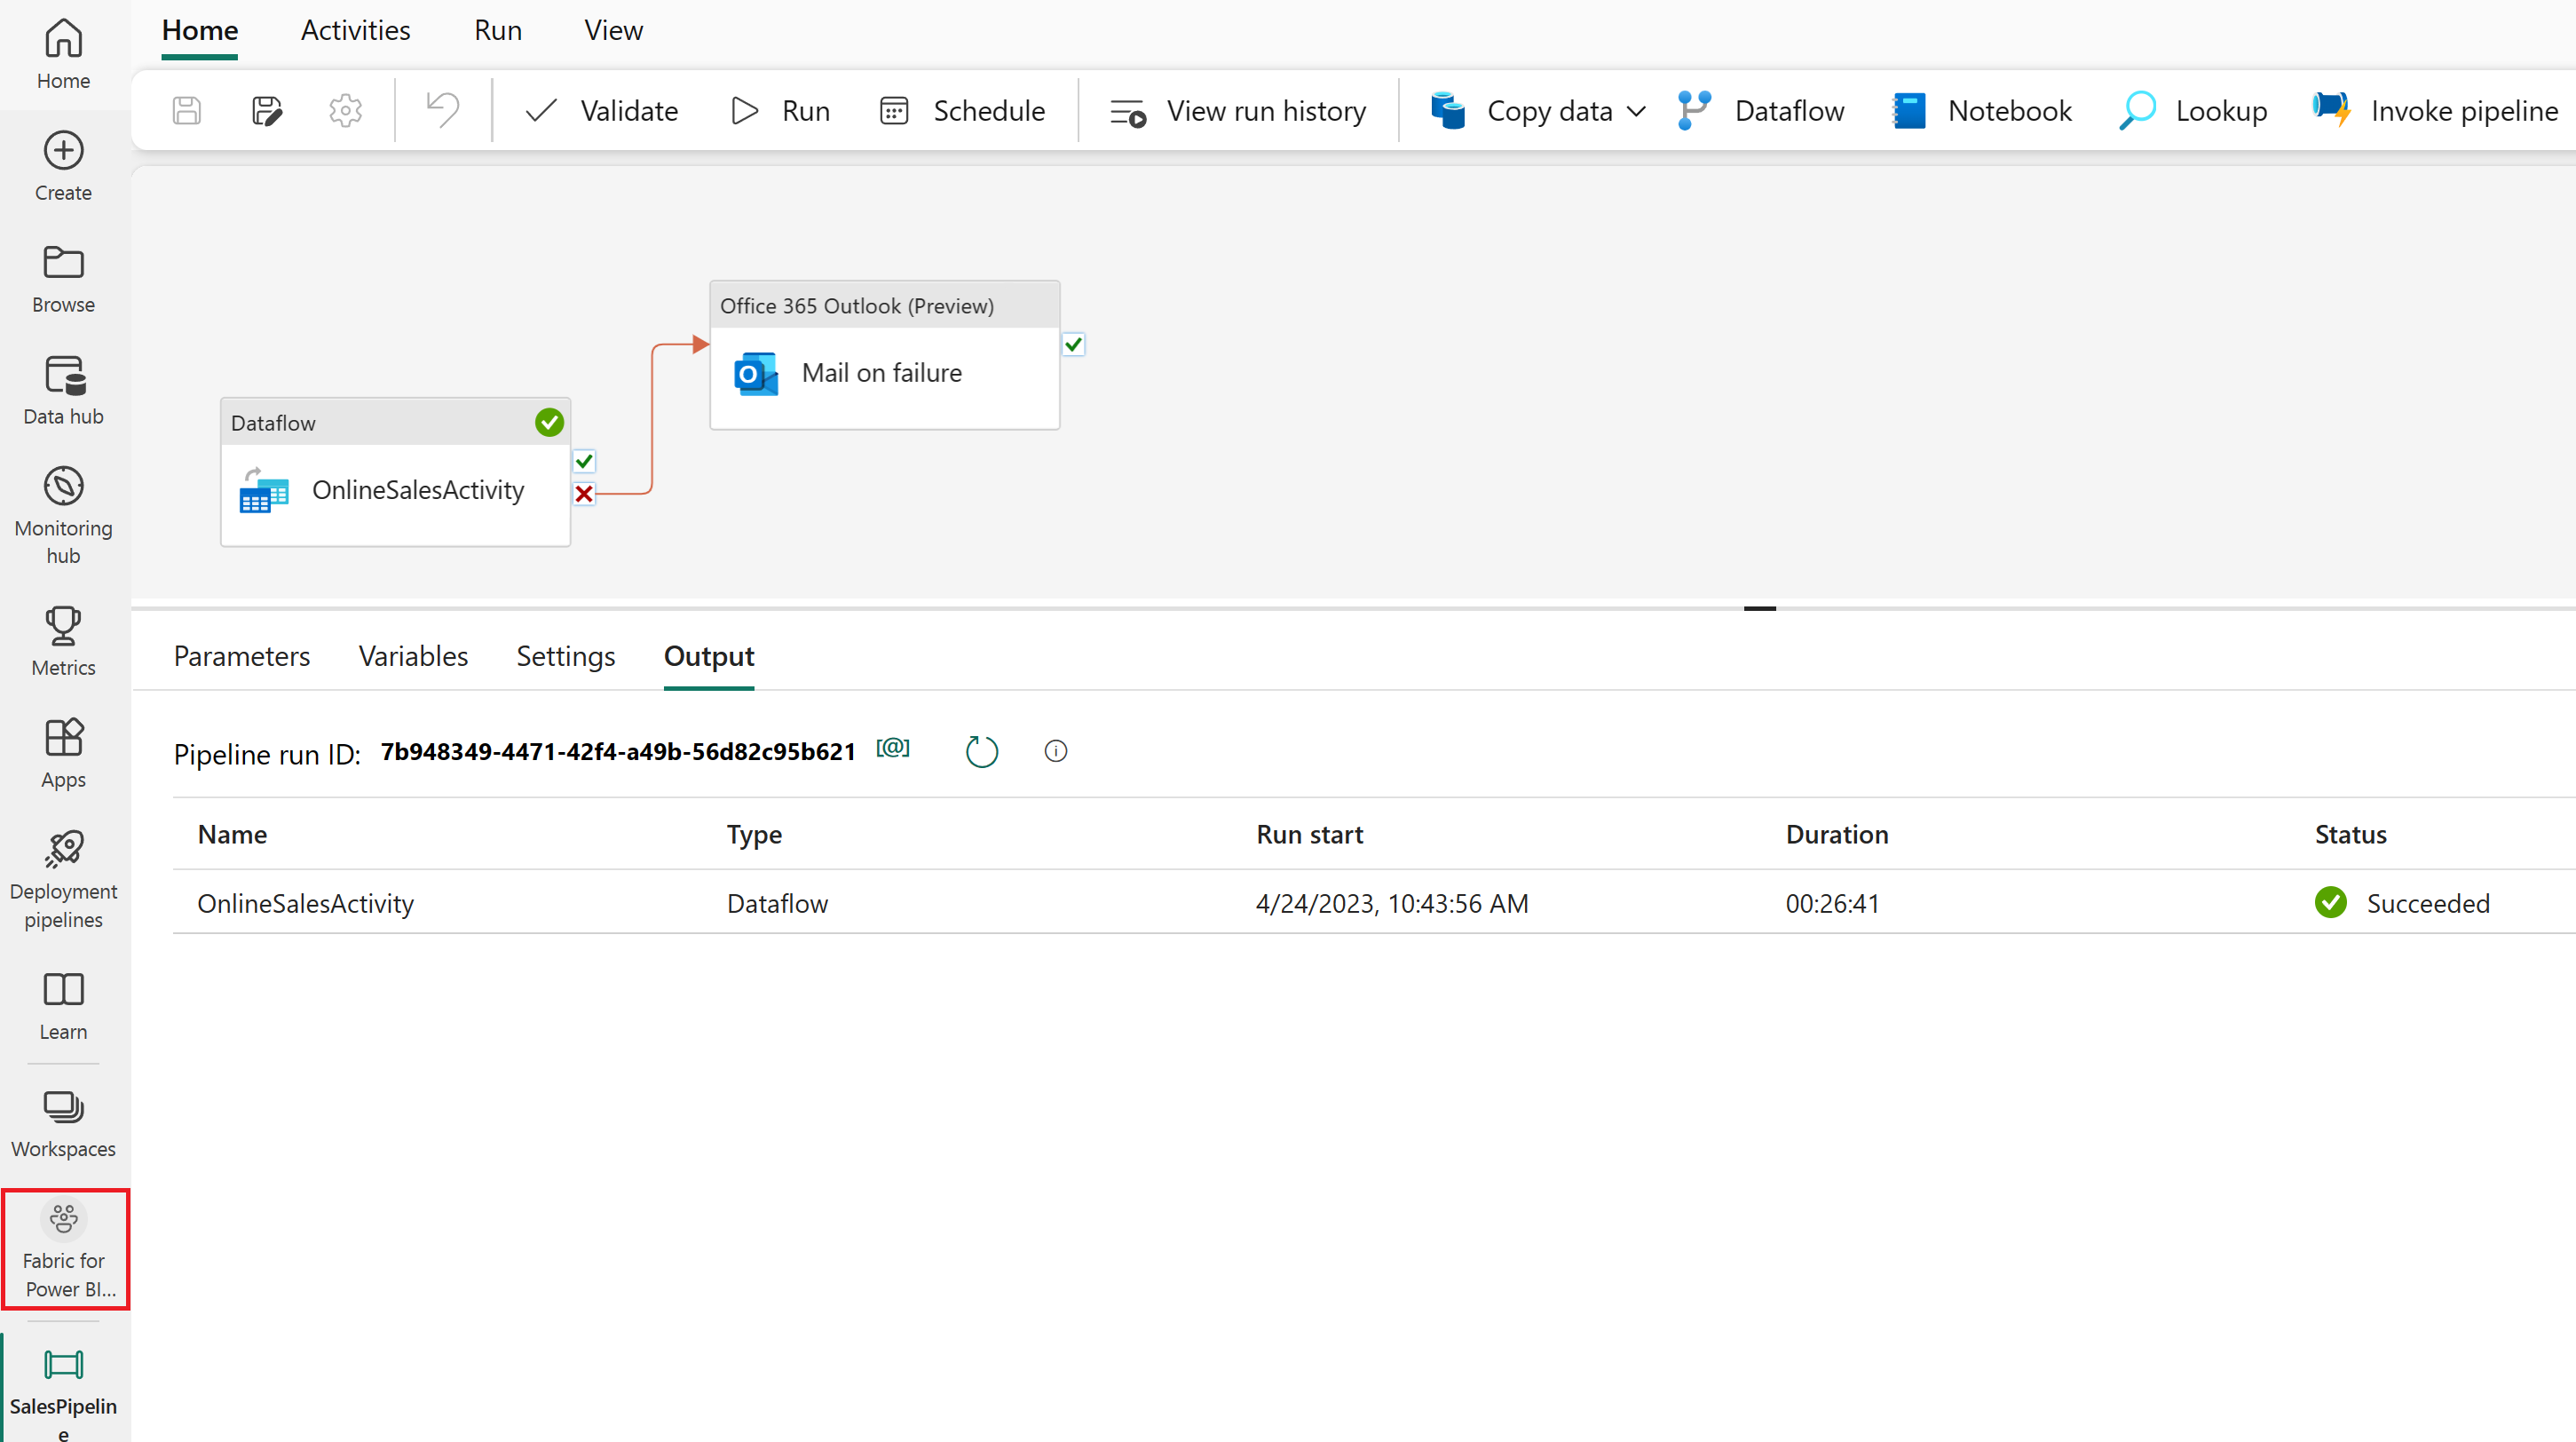
當狀態顯示 [成功] 時,返回工作區以繼續進行教學課程。
在 Lakehouse 中建立語意模型
您載入的資料就快準備好用於報表了。 接下來,使用 Lakehouse 中的數據表來建立語意模型,這是一個元數據層,可組織實體數據並將其轉換成邏輯物件。 語意模型的設計目的是要反映您的商務結構,並讓數據更容易分析。
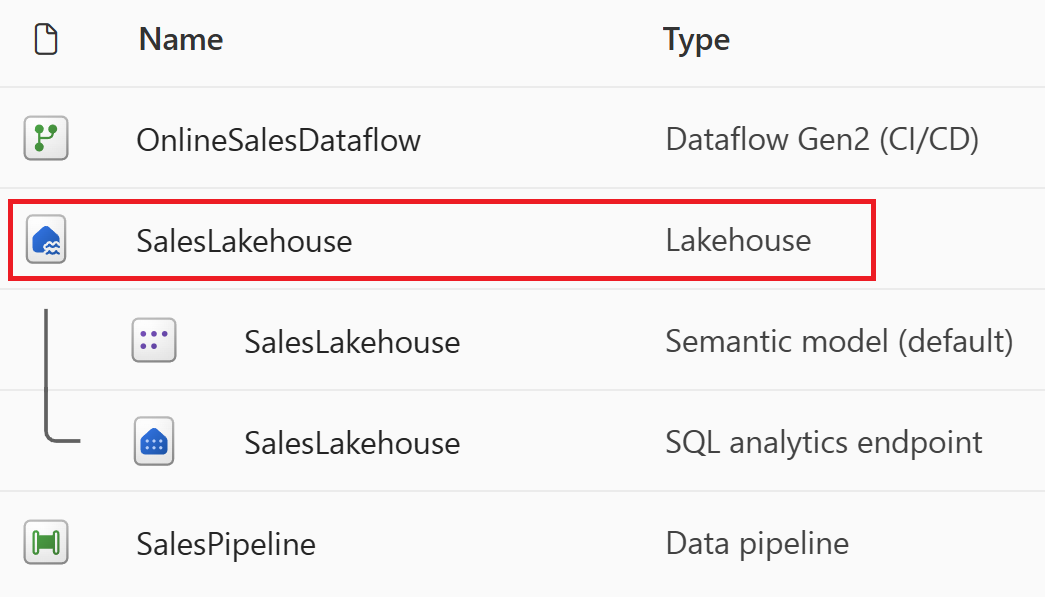
在工作區檢視中,選取 SalesLakehouse 專案。
在資源管理器中,從 常用 索引標籤選取 新增語意模型。
在 [新增語意模型] 視窗中,將模型命名為 SalesModel。 然後,展開 dbo 架構和 數據表 群組。 選取下表,然後選取 [ 確認]:
數據表名稱 DimCustomer DimDate DimEmployee DimProduct DimStore FactOnlineSales 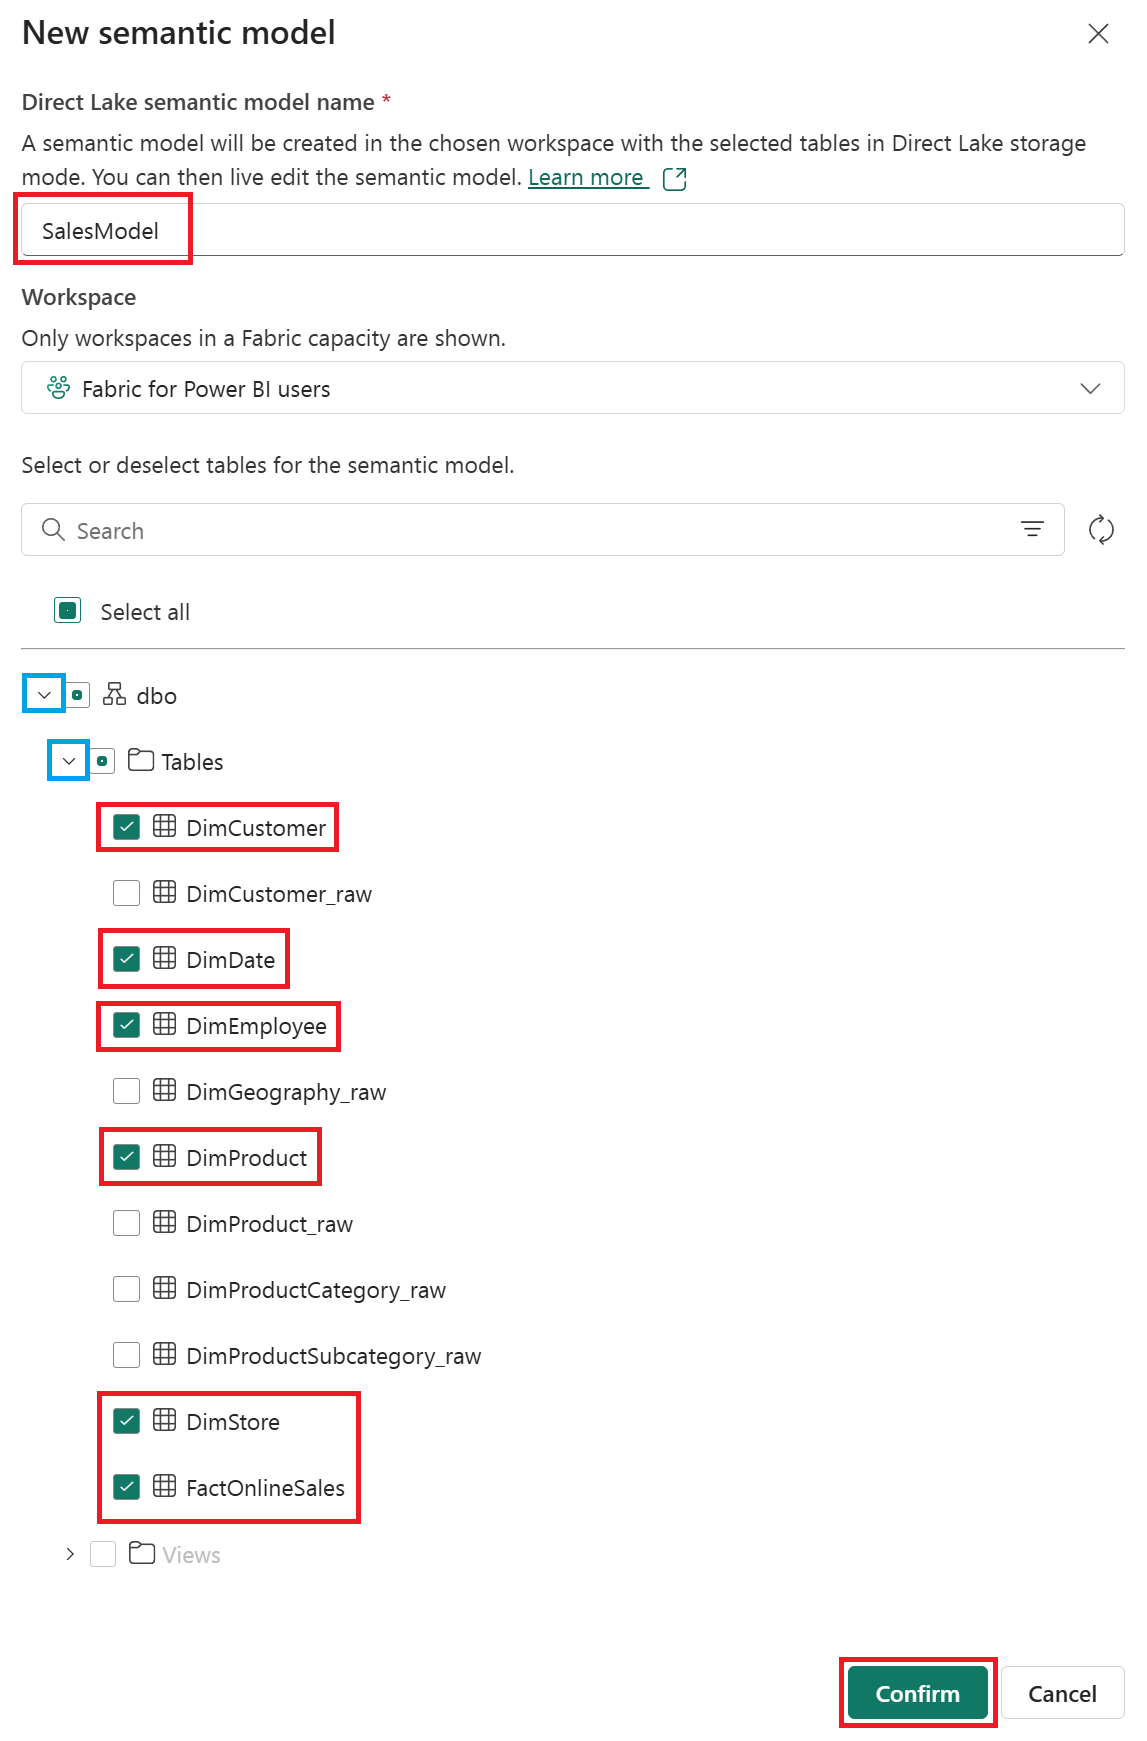
建立關聯
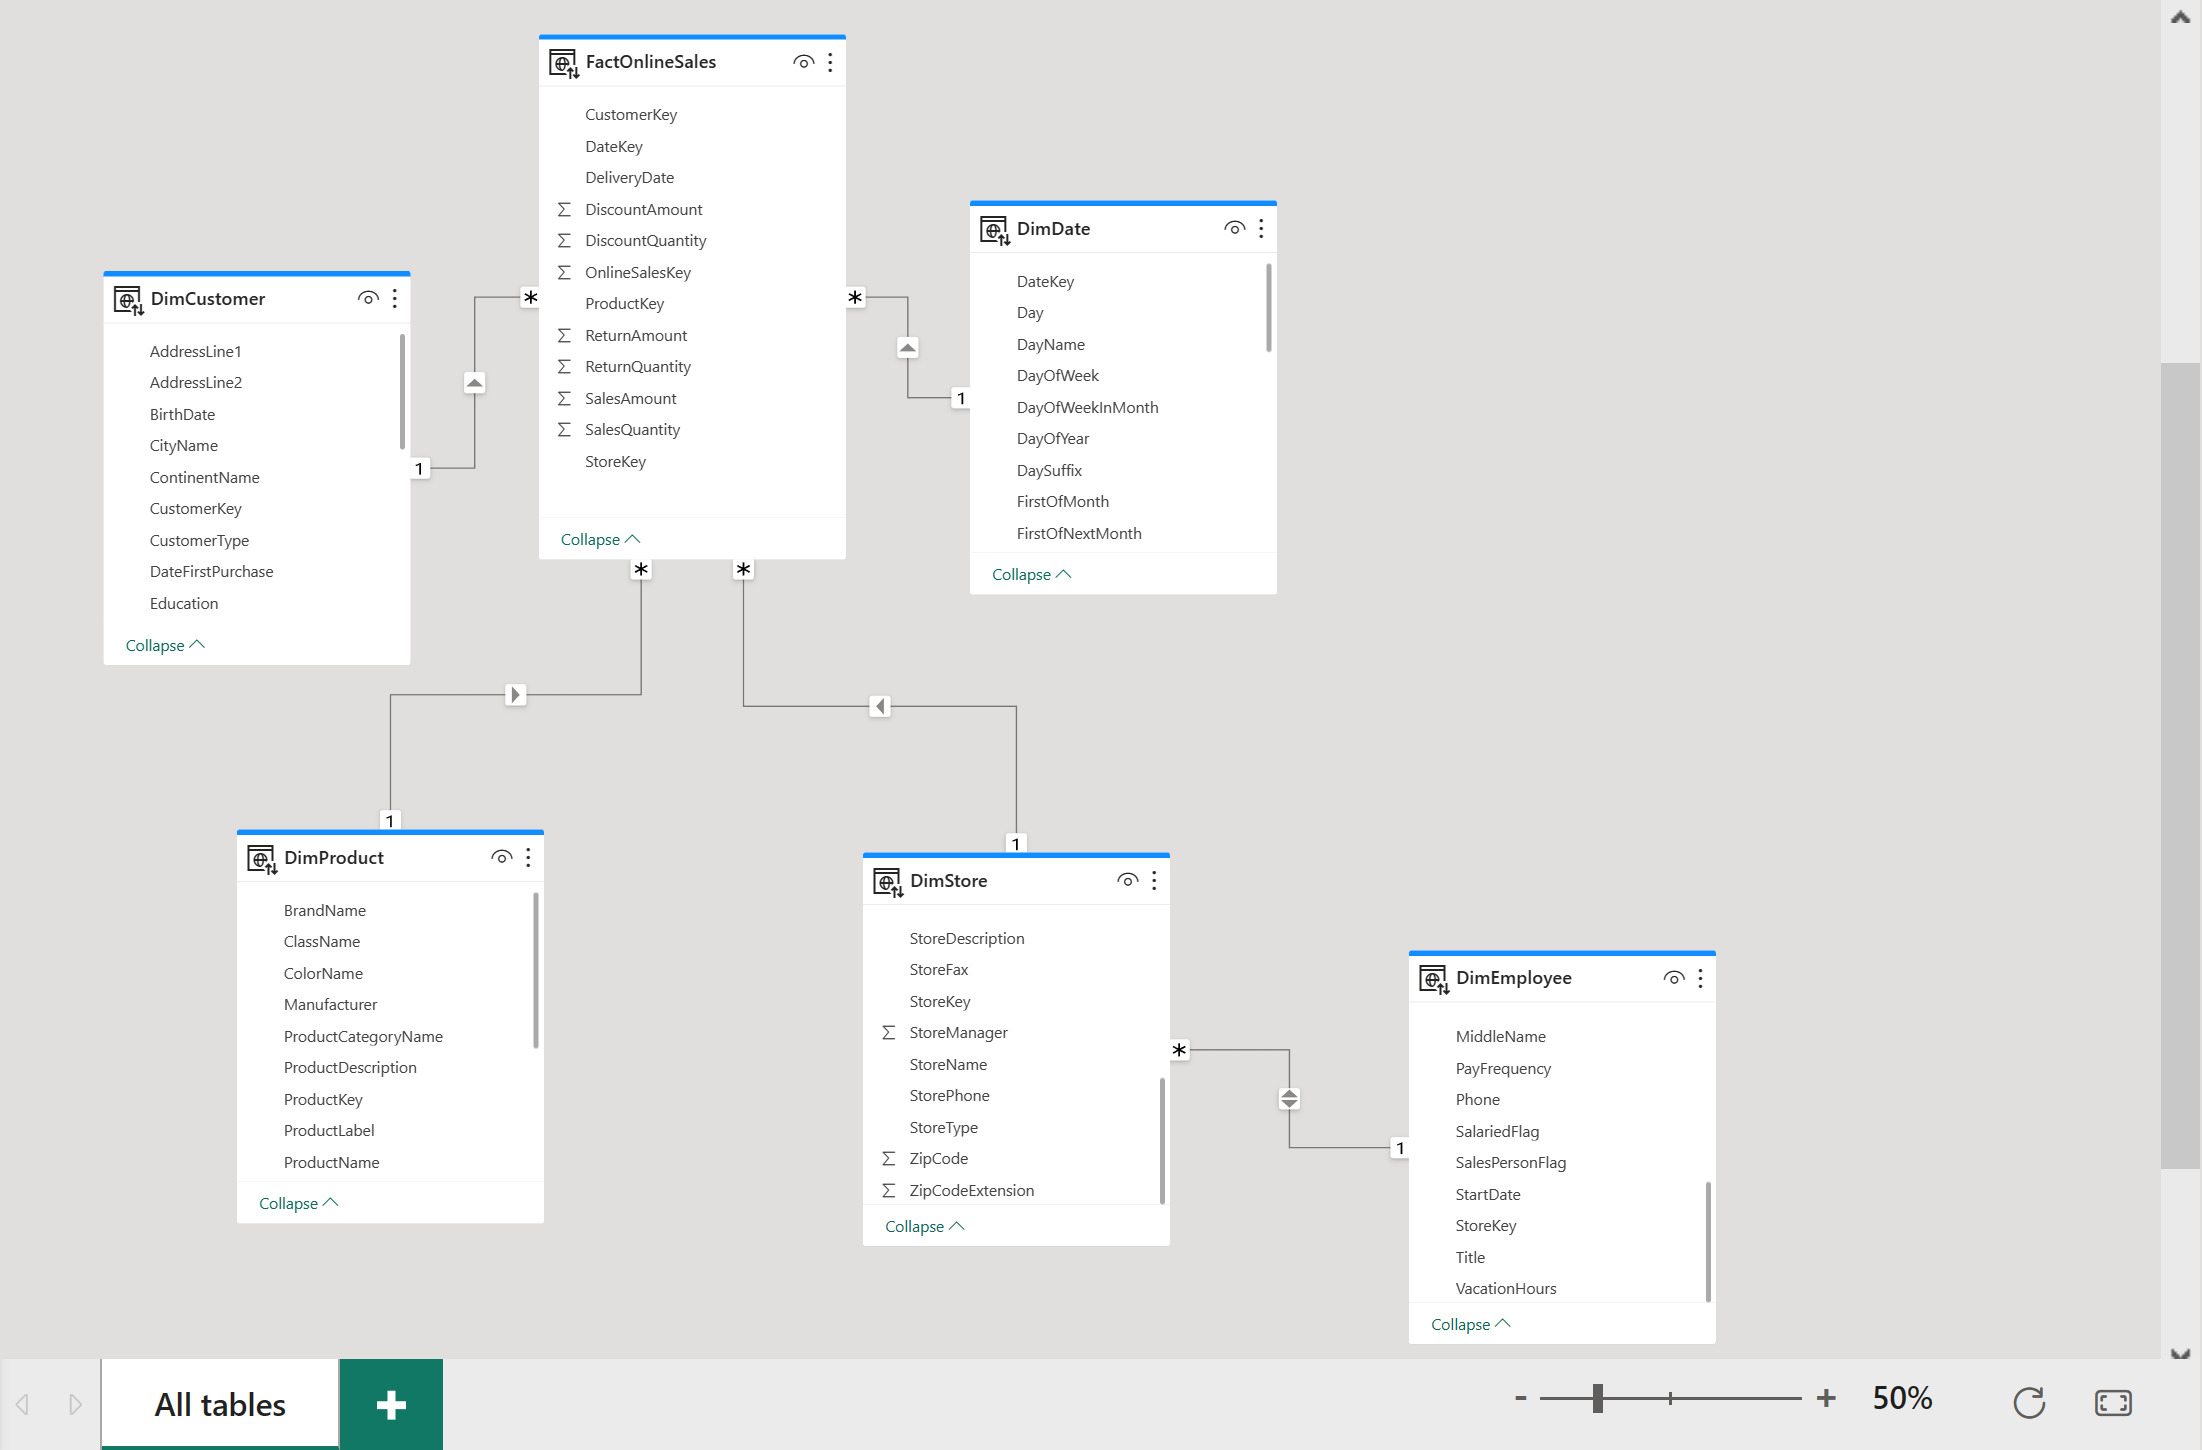
此模型使用星型架構,在數據倉儲中很常見。 星形的中心是一個 Fact 數據表,以 Dimension 數據表括住,這些數據表與 Fact 數據表相關。
藉由將 CustomerKey 數據行從 FactOnlineSales 數據表拖放至 DimCustomer 數據表上的 CustomerKey 數據行,以建立關聯性。
在 [ 建立關聯性] 視窗中,確定下列設定,然後選取 [ 確認]:
設為使用中的關聯性 從:表 1 (資料行) 到:表 2 (資料行) 基數 交叉篩選方向 ☑ FactOnlineSales (CustomerKey) DimCustomer (CustomerKey) 多對一 (*:1) 單身 針對下列每個關聯性重複這些步驟:
設為使用中的關聯性 從:表 1 (資料行) 到:表 2 (資料行) 基數 交叉篩選方向 ☑ FactOnlineSales(ProductKey) DimProduct(ProductKey) 多對一 (*:1) 單身 ☑ FactOnlineSales (StoreKey) DimStore(StoreKey) 多對一 (*:1) 單身 ☑ FactOnlineSales (DateKey) DimDate (DateKey) 多對一 (*:1) 單身 ☑ DimStore(StoreKey) DimEmployee (StoreKey) 多對一 (*:1) 兩者 下圖顯示語意模型的完整檢視,其中包含所有關聯性。

撰寫 DAX 量值
建立基本量值以計算總銷售額。
選取 FactOnlineSales 數據表,然後在 [ 首頁 ] 索引標籤上,選取 [ 新增量值]。
在公式編輯器中,輸入下列 DAX 度量值,然後選取 核對標記 以提交。
Total Sales Amount = SUM(FactOnlineSales[SalesAmount])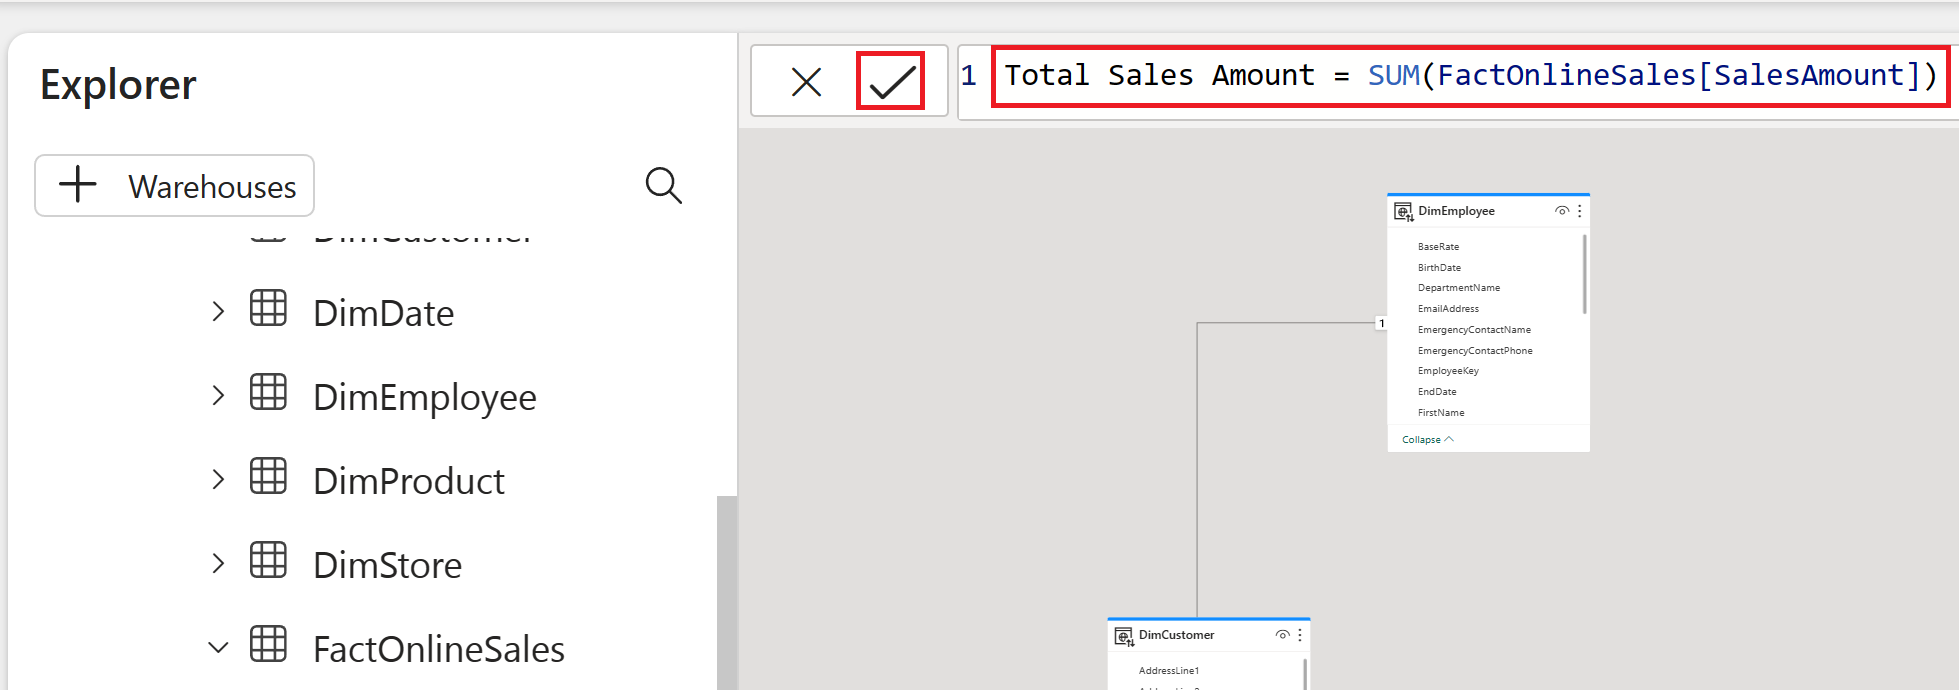
自動建立報表
既然您已建立數據模型,您可以使用快速建立來快速可視化和探索數據。
從左側邊欄選取工作區,返回您的工作區。 將滑鼠停留在 SalesModel 專案上,選取省略號 (... ),然後選擇 [ 自動建立報表]。
![[自動建立報表] 選項與工作區的螢幕擷取畫面。](media/fabric-get-started/auto-create-report.png)
報表會自動產生,並根據 您的數據 窗格中的欄位選取動態更新。
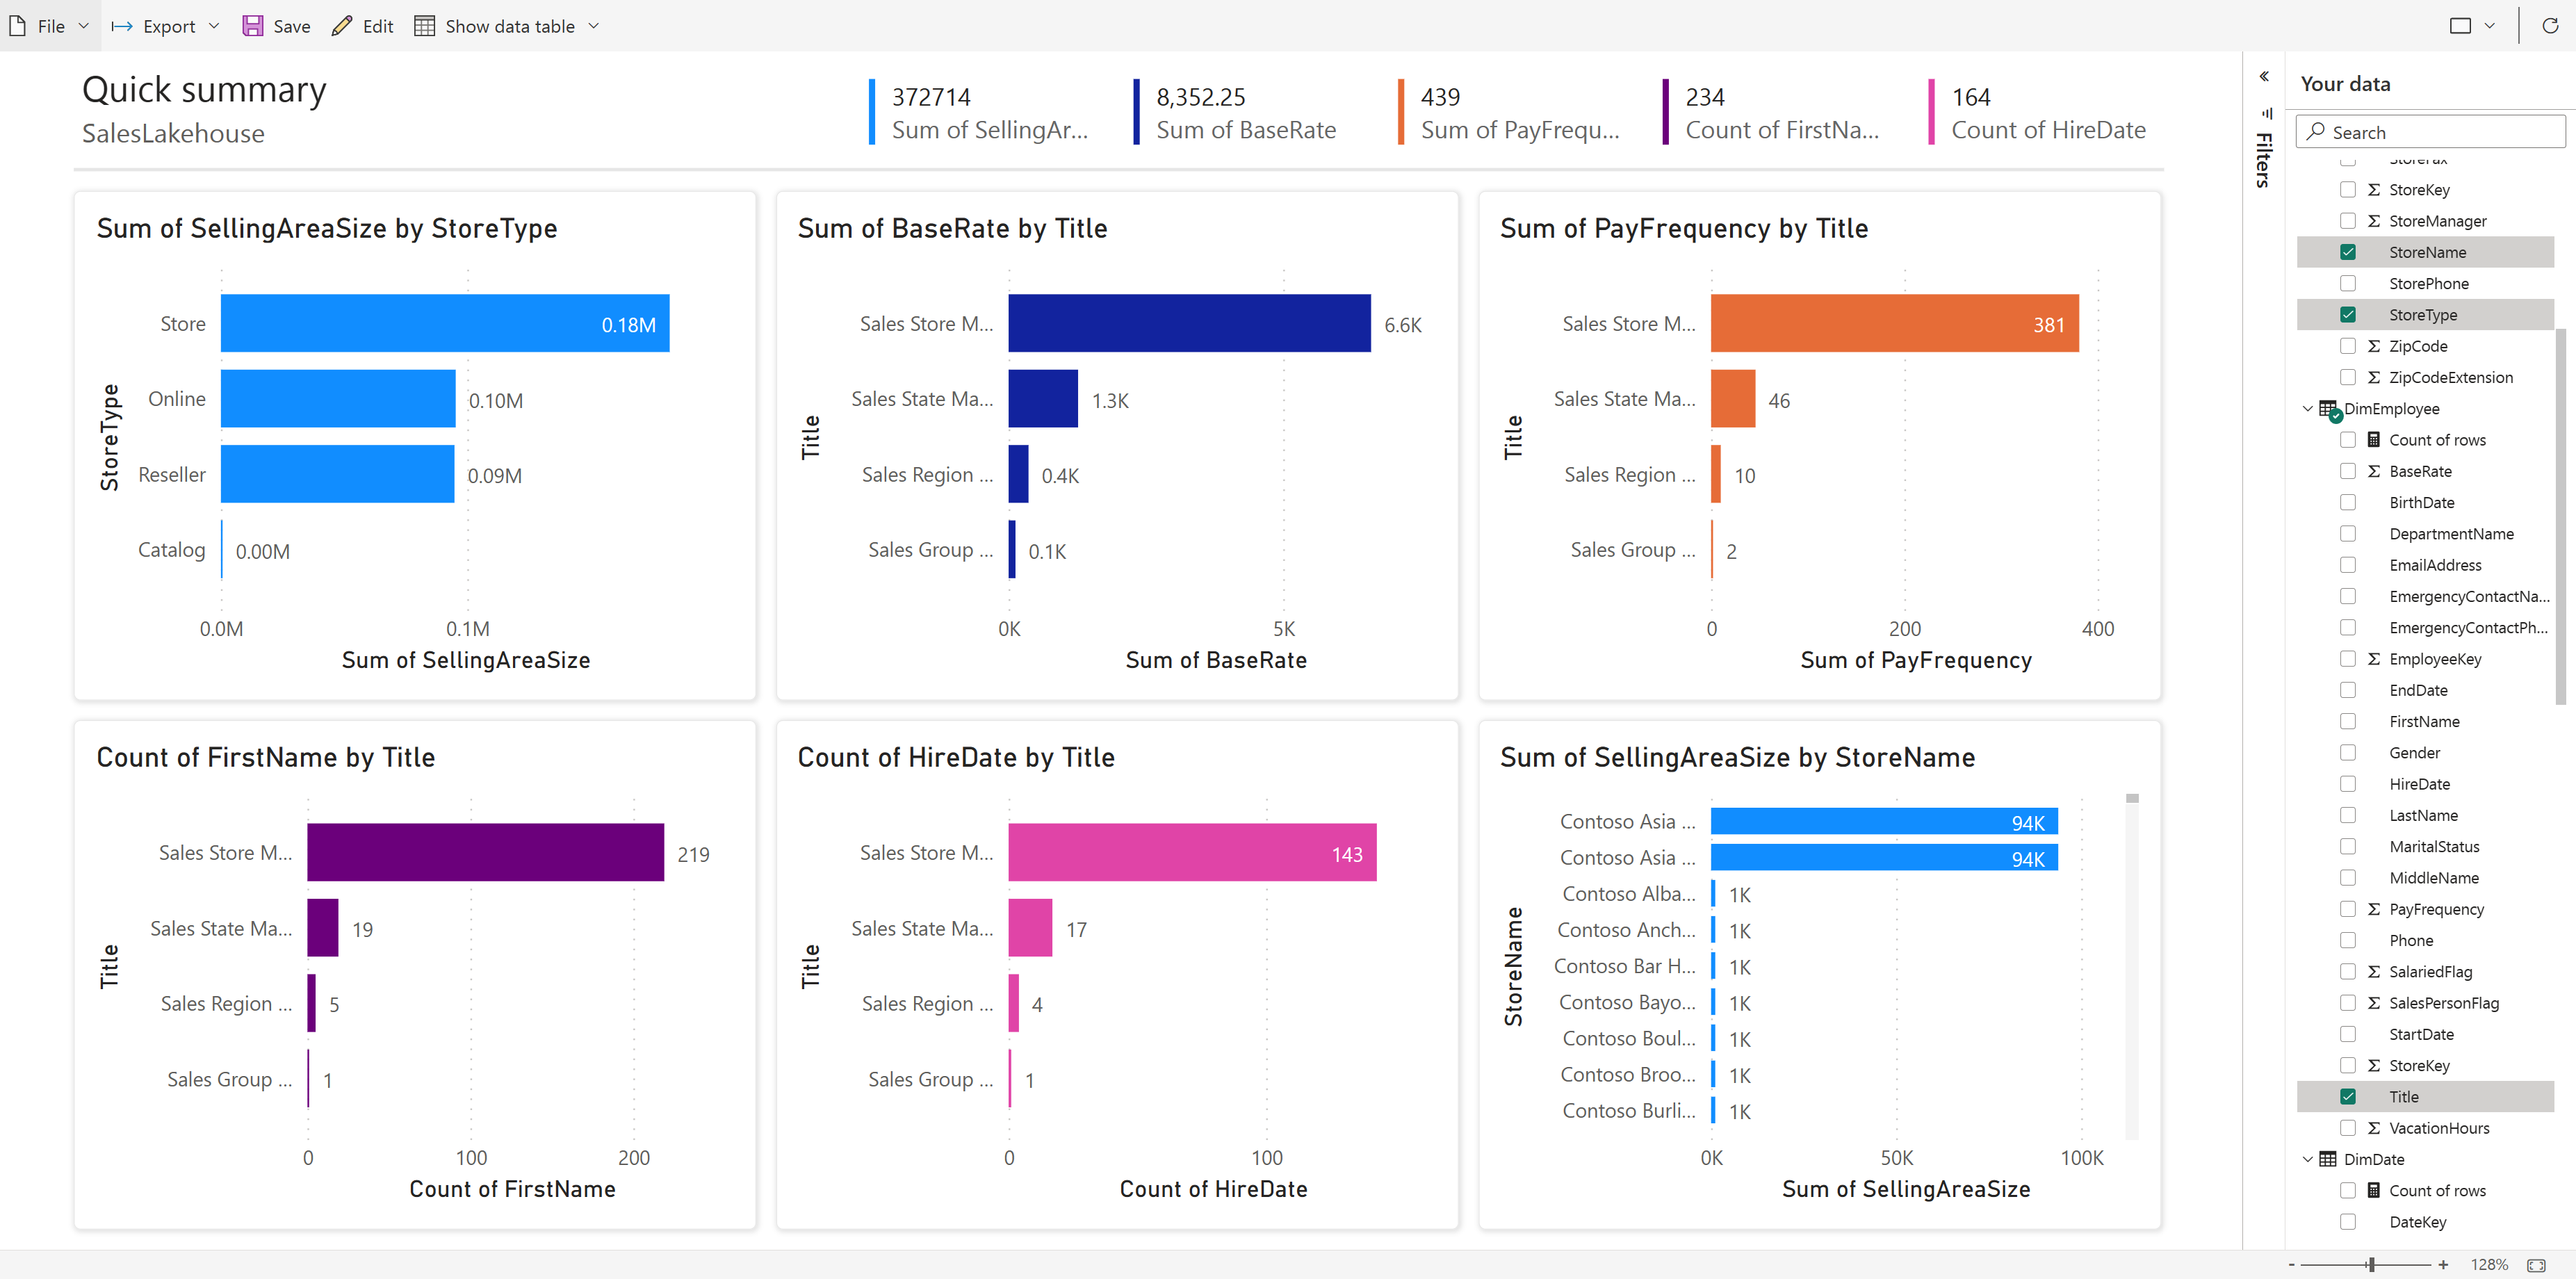
從功能區選取 [ 儲存 ],將複本儲存至目前的工作區。
注意
若要輸入完整的視覺製作體驗,請選取功能區上的 [ 編輯 ]。
![[自動建立報表] 選項與工作區的螢幕擷取畫面。](media/fabric-get-started/auto-create-report.png#lightbox)
進一步了解 快速建立。
相關內容
恭喜您完成教學課程! 如果您已建立本教學課程的專用工作區,您現在可以選擇將其刪除,或移除程式期間建立的個別專案。
本教學課程示範 Power BI 使用者如何使用 Microsoft Fabric,輕鬆地探索任何規模的深入解析。