إشعار
يتطلب الوصول إلى هذه الصفحة تخويلاً. يمكنك محاولة تسجيل الدخول أو تغيير الدلائل.
يتطلب الوصول إلى هذه الصفحة تخويلاً. يمكنك محاولة تغيير الدلائل.
Power BI can be integrated with Real-Time Intelligence to provide enhanced performance for users who need high refresh rates or high volumes of data. This article describes the Real-Time Intelligence sample experience, which is an entry point from Power BI to Real-Time Intelligence.
When integrated with Real-Time Intelligence, Power BI can use streaming data to provide up-to-the-minute insights. Real-Time Intelligence manages the ingestion, transformation, and storage of streaming data, and makes it available for analysis and visualization in Power BI. This integration provides a comprehensive and fully integrated solution for real-time data analysis and visualization for use cases with high volumes of data or high refresh rates.
Real-Time Intelligence is a powerful service in the Fabric product suite that can help you extract insights and visualize your data in motion. It offers an end-to-end solution for event-driven scenarios, streaming data, and data logs.
Learn more about Real-Time Intelligence.
Create a sample
When your semantic model refresh rate is higher than a certain threshold, you see a bubble pop-up inviting you to try a sample experience in Real-Time Intelligence.
Select Try a sample to start building a sample end-to-end solution in Real-Time Intelligence. The following components are created:
- Event stream
- Eventhouse
- KQL Database
- KQL Queryset
- Real-Time Dashboard
- Power BI report
This solution is based on streaming sample data, to show you the ease and power of the solution in Real-Time Intelligence. Once the build is completed, a dialogue box opens with individual links to each of the sample items, which open in a new tab in the navigation bar.
- Select the name of an item to open it in Real-Time Intelligence.
- Select Explore to close the dialogue box and go to the KQL database window for the sample.

The histogram and tables in the main view pane update automatically as the data refreshes.
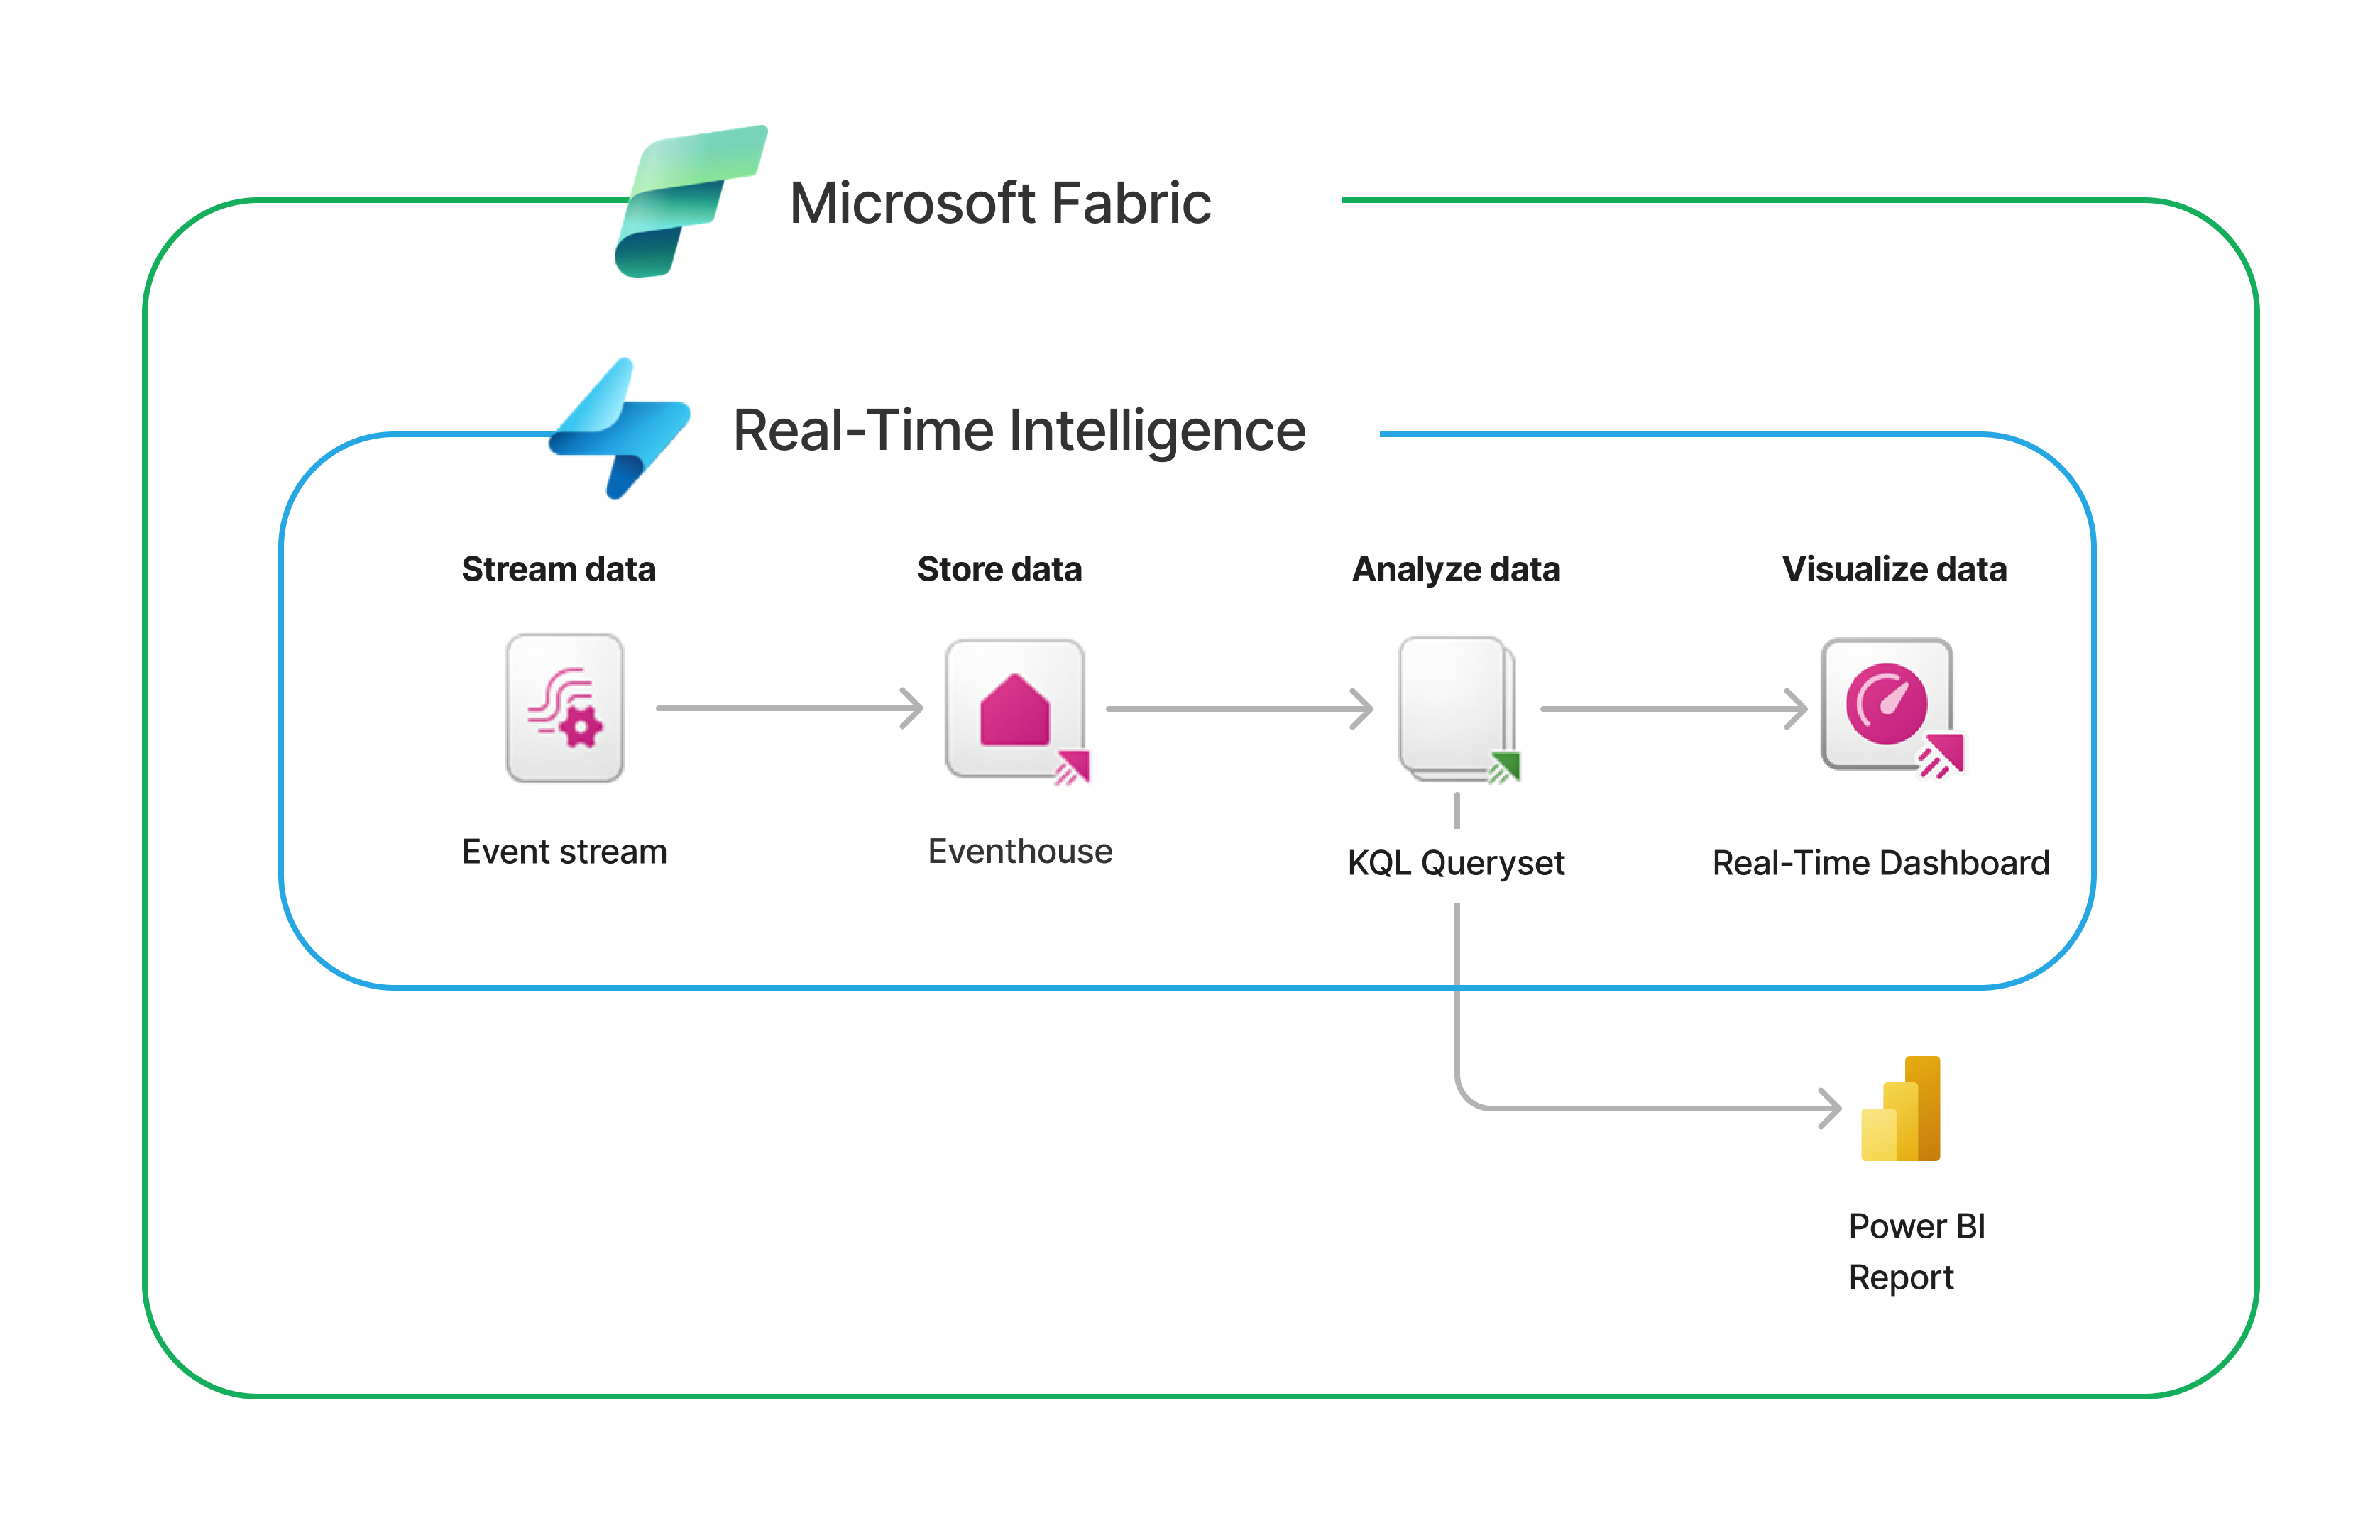
Components of the Real-Time Intelligence solution
The components of the Real-Time Intelligence sample experience are:
Event stream: An event stream is the engine for data ingestion and processing of your real-time data into Microsoft Fabric. You can transform your data and route it via filters to various destinations. Read more about event streams.
Eventhouse: An eventhouse is where data is stored and analyzed. An eventhouse is designed to handle real-time data streams efficiently. An eventhouse can hold one or more KQL databases. They're tailored to large volumes of time-based, streaming events with structured, semi structured, and unstructured data. Read more about Eventhouse.
KQL Database: A KQL database is where data is stored and managed. It allows you to query data in real-time, providing a powerful tool for data exploration and analysis. The KQL database supports various data policies and transformations. Read more about KQL databases.
KQL Queryset: A KQL queryset is used to run queries, view, and customize query results on data from a KQL database. Read more about KQL queryset.
Real-Time Dashboard: A Real-Time dashboard provides an up-to-the-second snapshot of various goals and data points in a collection of tiles. Each tile has an underlying query and a visual representation. It allows you to visualize data in real-time, providing insights and enabling data exploration. Read more about Real-Time dashboards.
Power BI: Creates real-time reports that display data from event streams and KQL databases managed by Real-Time Intelligence. Reports connect to the KQL database via DirectQuery using the Azure Data Explorer (Kusto) connector, which supports both Azure Data Explorer and Fabric KQL databases. Dynamic M query parameters push filters and time-grain parameters down to the KQL database, so visuals receive aggregated results rather than raw events.
Create your own solution in Real-Time Intelligence
You can implement this solution with your own data. Before you begin, you need a workspace with a Microsoft Fabric-enabled capacity.
To set up our own real-time dashboard, follow the Real-Time Intelligence tutorials. Here's a summary of the steps:
- Create an eventhouse and set up your environment.
- Create an event stream and bring your data into a KQL database.
- Create a KQL queryset and query your data.
- Create a real-time dashboard and explore your data visually.
- Build a Power BI report.
- Connect to the KQL database using DirectQuery via the Azure Data Explorer (Kusto) connector, which supports both Azure Data Explorer and Fabric KQL databases.
- Use dynamic M query parameters to pass time range and bin size into KQL queries, so Power BI receives aggregated series (for example,
make-seriesorsummarizeoutput) rather than raw events. - Perform anomaly detection in KQL using functions like
series_decompose_anomalies, and return the computed results to Power BI visuals.
Tip
For large volumes of time-series data, use query folding with parameterized M queries so filters and aggregations execute in KQL. Avoid importing raw high-volume event data — return only aggregated datasets to visuals for interactive performance.