Data collection for advanced troubleshooting on Windows
Applies to:
Microsoft Defender for Business
Microsoft Defender Antivirus
When collaborating with Microsoft support professionals, you might be asked to use the client analyzer to collect data for troubleshooting of more complex scenarios. The analyzer script supports other parameters for that purpose and can collect a specific log set based on the observed symptoms that need to be investigated.
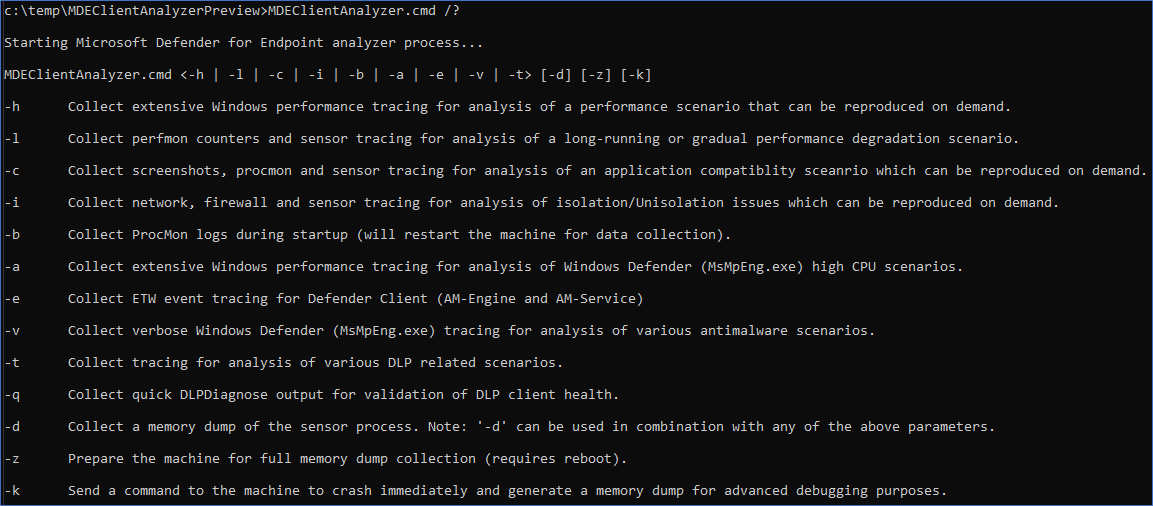
Run MDEClientAnalyzer.cmd /? to see the list of available parameters and their description:
| Switch | Description | When to use | Process that you're troubleshooting. |
|---|---|---|---|
-h |
Calls into Windows Performance Recorder to collect a verbose general performance trace in addition to the standard log set. | Slow application start/launch. When clicking on a button on the app, taking x seconds longer. | One of the following: - MSSense.exe- MsSenseS.exe- SenseIR.exe- SenseNdr.exe- SenseTVM.exe- SenseAadAuthenticator.exe- SenseGPParser.exe- SenseImdsCollector.exe- SenseSampleUploader.exe - MsMpEng.exe - NisSrv.exe |
-l |
Calls into built-in Windows Performance Monitor to collect a lightweight perfmon trace. This scenario can be useful when diagnosing slow performance degradation issues that occur over time but hard to reproduce on demand. | Troubleshooting application performance that could be slow to reproduce (manifest) itself. We recommend capturing up to three minutes (at most five minutes), because your data set could get too large. | One of the following: - MSSense.exe - MsSenseS.exe - SenseIR.exe- SenseNdr.exe - SenseTVM.exe- SenseAadAuthenticator.exe- SenseGPParser.exe- SenseImdsCollector.exe- SenseSampleUploader.exe- MsMpEng.exe- NisSrv.exe |
-c |
Calls into process monitor for advanced monitoring of real-time file system, registry, and process/thread activity. This is especially useful when troubleshooting various application compatibility scenarios. | Process Monitor (ProcMon) to initiate a boot trace when investigating a driver or service or application startup delay related issue. Or applications hosted on a network share that aren't using SMB Opportunistic Locking (Oplock) properly causing application compatibility problems. | One of the following: - MSSense.exe- MsSenseS.exe- SenseIR.exe- SenseNdr.exe- SenseTVM.exe- SenseAadAuthenticator.exe- SenseGPParser.exe- SenseImdsCollector.exe- SenseSampleUploader.exe- MsMpEng.exe- NisSrv.exe |
-i |
Calls into built-in netsh.exe command to start a network and Windows Firewall trace that is useful when troubleshooting various network-related issues. | When troubleshooting network related issues such as Defender for Endpoint EDR telemetry or CnC data submission issues. Microsoft Defender Antivirus Cloud Protection (MAPS) reporting issues. Network protection related issues, and so forth. | One of the following processes: - MSSense.exe- MsSenseS.exe- SenseIR.exe- SenseNdr.exe- SenseTVM.exe- SenseAadAuthenticator.exe- SenseGPParser.exe- SenseImdsCollector.exe- SenseSampleUploader.exe- MsMpEng.exe- NisSrv.exe |
-b |
Same as -c but the process monitor trace will be initiated during next boot and stopped only when the -b is used again. |
Process Monitor (ProcMon) to initiate a boot trace when investigating a driver or service or application startup delay related issue. This scenario can also be used to investigate a slow boot or slow sign-in. | One of the following processes: - MSSense.exe- MsSenseS.exe- SenseIR.exe- SenseNdr.exe- SenseTVM.exe - SenseAadAuthenticator.exe- SenseGPParser.exe- SenseImdsCollector.exe- SenseSampleUploader.exe- MsMpEng.exe- NisSrv.exe |
-e |
Calls into Windows Performance Recorder to collect Defender AV Client tracing (AM-Engine and AM-Service) for analysis of Antivirus cloud connectivity issues. | When troubleshooting Cloud Protection (MAPS) reporting failures. | MsMpEng.exe |
-a |
Calls into Windows Performance Recorder to collect a verbose performance trace specific to analysis of high CPU issues related to the antivirus process (MsMpEng.exe). | When troubleshooting high cpu utilization with Microsoft Defender Antivirus (Antimalware Service Executable or MsMpEng.exe) if you already used the Microsoft Defender Antivirus Performance Analyzer to narrow down the /path/process or /path or file extension contributing to the high cpu utilization. This scenario enables further investigate what the application or service is doing to contribute to the high cpu utilization. | MsMpEng.exe |
-v |
Uses antivirus MpCmdRun.exe command line argument with most verbose -trace flags. | Anytime an advanced troubleshooting is needed. Such as when troubleshooting Cloud Protection (MAPS) reporting failures, Platform Update failures, Engine update failures, Security Intelligence Update failures, False negatives, etc. Can also be used with -b, -c, -h, or -l. |
MsMpEng.exe |
-t |
Starts verbose trace of all client-side components relevant to Endpoint DLP, which is useful for scenarios where DLP actions aren't happening as expected for files. | When running into issues where the Microsoft Endpoint Data Loss Prevention (DLP) actions expected aren't occurring. | MpDlpService.exe |
-q |
Calls into DLPDiagnose.ps1 script from the analyzer Tools directory that validates the basic configuration and requirements for Endpoint DLP. |
Checks the basic configuration and requirements for Microsoft Endpoint DLP | MpDlpService.exe |
-d |
Collects a memory dump of MsSenseS.exe (the sensor process on Windows Server 2016 or older OS) and related processes. - * This flag can be used with above mentioned flags. - ** Capturing a memory dump of PPL protected processes such as MsSense.exe or MsMpEng.exe isn't supported by the analyzer at this time. |
On Windows 7 SP1, Windows 8.1, Windows Server 2008 R2, Windows Server 2012 R2 or Windows Server 2016 running w/ the MMA agent and having performance (high cpu or high memory usage) or application compatibility issues. | MsSenseS.exe |
-z |
Configures registry keys on the machine to prepare it for full machine memory dump collection via CrashOnCtrlScroll. This would be useful for analysis of computer freeze issues. * Hold down the rightmost CTRL key, then press the SCROLL LOCK key twice. | Machine hanging or being unresponsive or slow. High memory usage (Memory leak): a) User mode: Private bytes b) Kernel mode: paged pool or nonpaged pool memory, handle leaks. | MSSense.exe or MsMpEng.exe |
-k |
Uses NotMyFault tool to force the system to crash and generate a machine memory dump. This would be useful for analysis of various OS stability issues. | Same as above. | MSSense.exe or MsMpEng.exe |
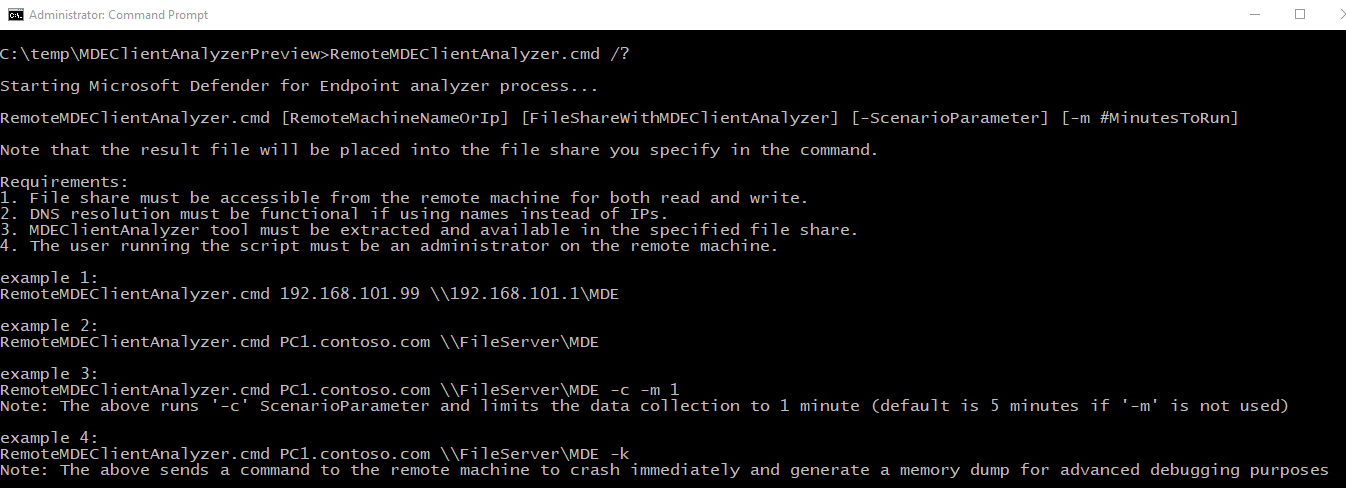
The analyzer, and all of the scenario flags listed in this article, can be initiated remotely by running RemoteMDEClientAnalyzer.cmd, which is also bundled into the analyzer toolset:
Note
When any advanced troubleshooting parameter is used, the analyzer also calls into MpCmdRun.exe to collect Microsoft Defender Antivirus related support logs.
You can use -g flag to validate URLs for a specific datacenter region even without being onboarded to that region
For example, MDEClientAnalyzer.cmd -g EU forces the analyzer to test cloud URLs in Europe region.
A few points to keep in mind
When you use RemoteMDEClientAnalyzer.cmd, it calls into psexec to download the tool from the configured file share and then run it locally via PsExec.exe.
The CMD script uses the -r flag to specify that it is running remotely within SYSTEM context, and so no prompt is presented to the user.
That same flag can be used with MDEClientAnalyzer.cmd to avoid a prompt to the user to specify the number of minutes for data collection. For example, consider MDEClientAnalyzer.cmd -r -i -m 5.
-rindicates that tool is being run from remote (or non-interactive context).-iis the scenario flag for collection of network trace along with other related logs.-m #denotes the number of minutes to run (we used 5 minutes in our example).
When using MDEClientAnalyzer.cmd, the script checks for privileges using net session, which requires the service Server to be running. If it's not, you will get the error message Script is running with insufficient privileges. Run it with administrator privileges if ECHO is off.
Tip
Do you want to learn more? Engage with the Microsoft Security community in our Tech Community: Microsoft Defender for Endpoint Tech Community.

