Monitor Azure Cosmos DB data using Azure Monitor Log Analytics diagnostic settings
Članak
APPLIES TO:
NoSQL
MongoDB
Cassandra
Gremlin
Table
Diagnostic settings in Azure are used to collect resource logs. Resources emit Azure resource Logs and provide rich, frequent data about the operation of that resource. These logs are captured per request and are referred to as "data plane logs." Some examples of the data plane operations include delete, insert, and readFeed. The content of these logs varies by resource type.
Platform metrics and the Activity logs are collected automatically, whereas you must create a diagnostic setting to collect resource logs or forward them outside of Azure Monitor. You can turn on diagnostic setting for Azure Cosmos DB accounts and send resource logs to the following sources:
Azure Monitor Log Analytics workspaces
Data sent to Log Analytics can be written into Azure Diagnostics (legacy) or Resource-specific (preview) tables
An existing Azure Monitor Log Analytics workspace.
Warning
If you need to delete a resource, rename, or move a resource, or migrate it across resource groups or subscriptions, first delete its diagnostic settings. Otherwise, if you recreate this resource, the diagnostic settings for the deleted resource could be included with the new resource, depending on the resource configuration for each resource. If the diagnostics settings are included with the new resource, this resumes the collection of resource logs as defined in the diagnostic setting and sends the applicable metric and log data to the previously configured destination.
Also, it's a good practice to delete the diagnostic settings for a resource you're going to delete and don't plan on using again to keep your environment clean.
Create diagnostic settings
Here, we walk through the process of creating diagnostic settings for your account.
Note
The metric to logs export as a category is not currently supported.
Navigate to your existing Azure Cosmos DB account.
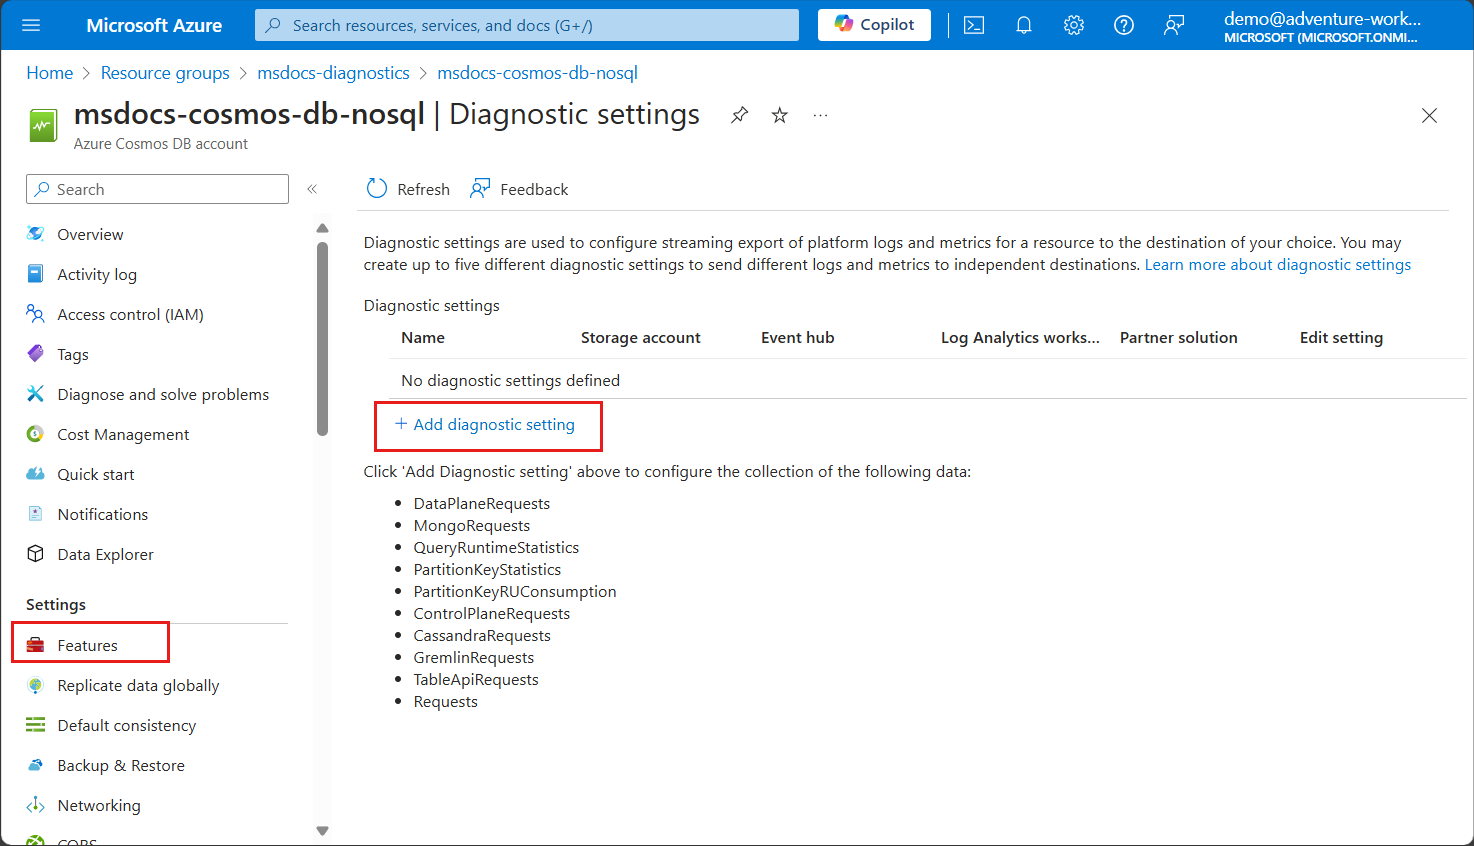
In the Monitoring section of the resource menu, select Diagnostic settings. Then, select the Add diagnostic setting option.
Important
You might see a prompt to "enable full-text query [...] for more detailed logging" if the full-text query feature is not enabled in your account. You can safely ignore this warning if you do not wish to enable this feature. For more information, see enable full-text query.
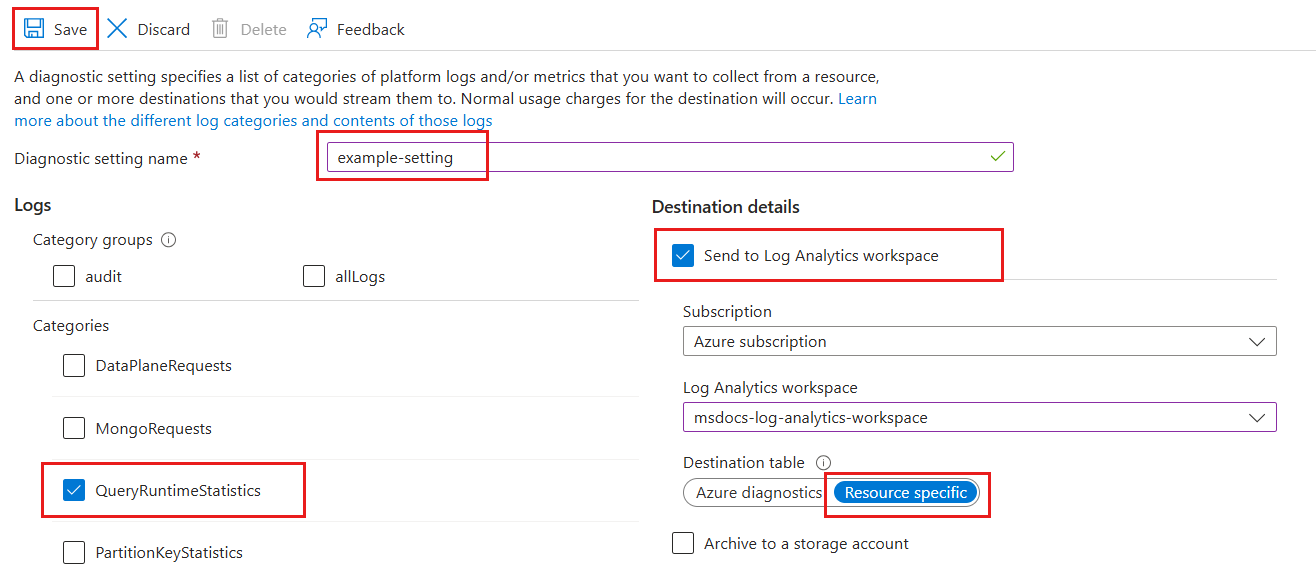
In the Diagnostic settings pane, name the setting example-setting and then select the QueryRuntimeStatistics category. Send the logs to a Log Analytics Workspace selecting your existing workspace. Finally, select Resource specific as the destination option.
Use the az monitor diagnostic-settings create command to create a diagnostic setting with the Azure CLI. See the documentation for this command for descriptions of its parameters.
Ensure you logged in to the Azure CLI. For more information, see sign in with Azure CLI.
Use az monitor diagnostic-settings create to create the setting.
az deployment group create \
    --resource-group "<resource-group-name>" \
    --template-file azuredeploy.json \
    --parameters \
      azureCosmosDbAccountName="<azure-cosmos-db-account-name>" \
      logAnalyticsWorkspaceName="<log-analytics-workspace-name>"
Tip
Use the az bicep decompile command to convert the Azure Resource Manager template to a Bicep template.
Enable full-text query for logging query text
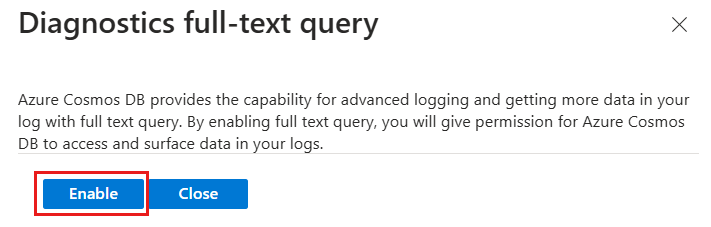
Azure Cosmos DB provides advanced logging for detailed troubleshooting. By enabling full-text query, you're able to view the deobfuscated query for all requests within your Azure Cosmos DB account. You also give permission for Azure Cosmos DB to access and surface this data in your logs.
Warning
Enabling this feature may result in additional logging costs, for pricing details visit Azure Monitor pricing. It is recommended to disable this feature after troubleshooting.
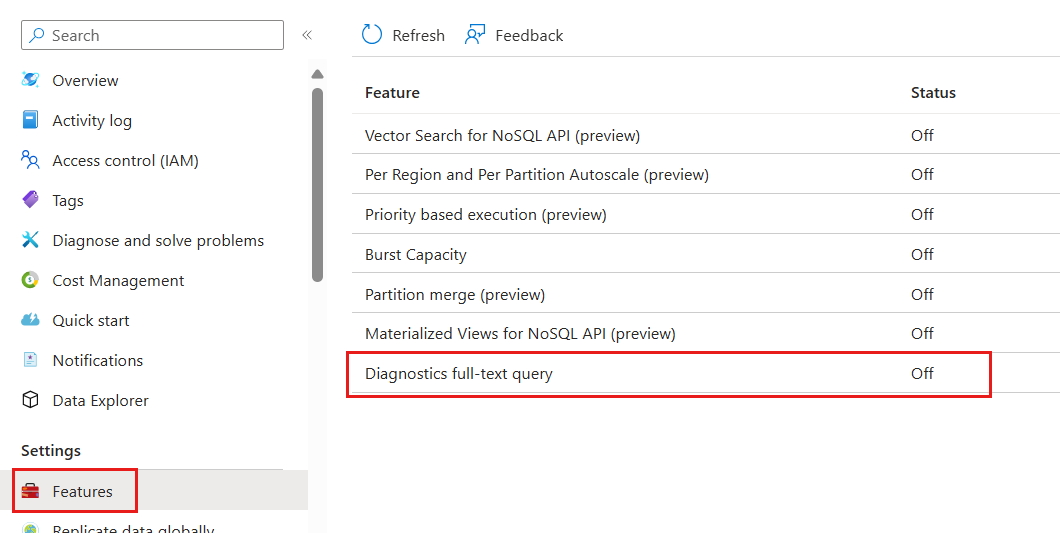
On the existing Azure Cosmos DB account page, select the Features option within the Settings section of the resource menu. Then, select the Diagnostics full-text query feature.
In the dialog, select Enable. This setting is applied within a few minutes. All newly ingested logs now have the full-text or PIICommand text for each request.
Use the Azure CLI to enable full-text query for your Azure Cosmos DB account.
Enable full-text query using az rest again with an HTTP PATCH verb and a JSON payload.
Uskoro: tokom 2024. postepeno ćemo ukidati probleme s uslugom GitHub kao mehanizam povratnih informacija za sadržaj i zamijeniti ga novim sistemom povratnih informacija. Za više informacija, pogledajte https://aka.ms/ContentUserFeedback.