Monitor Azure Data Explorer ingestion, commands, queries, and tables using diagnostic logs
Azure Data Explorer is a fast, fully managed data analytics service for real-time analysis on large volumes of data streaming from applications, websites, IoT devices, and more. Azure Monitor diagnostic logs provide data about the operation of Azure resources. Azure Data Explorer uses diagnostic logs for insights on ingestion, commands, query, and tables. You can export operation logs to Azure Storage, event hub, or Log Analytics to monitor ingestion, commands, and query status. Logs from Azure Storage and Azure Event Hubs can be routed to a table in your Azure Data Explorer cluster for further analysis.
Important
Diagnostic log data may contain sensitive data. Restrict permissions of the logs destination according to your monitoring needs.
Note
In the Azure portal, the raw metrics data for the Metrics and Insights pages are stored in Azure Monitor. The queries on these pages query the raw metrics data directly to provide the most accurate results. When using the diagnostics settings feature, you can migrate the raw metrics data to the Log Analytics workspace. During the migration, some data precision may be lost due to rounding; hence, query results may vary slightly from the original data. The margin for error is less than one percent.
Prerequisites
- An Azure subscription. Create a free Azure account.
- Sign in to the Azure portal.
- Create a cluster and database.
Set up diagnostic logs for an Azure Data Explorer cluster
Diagnostic logs can be used to configure the collection of the following log data:
Note
- Ingestion logs are supported for queued ingestion to the Data ingestion URI using Kusto client libraries and data connectors.
- Ingestion logs aren't supported for streaming ingestion, direct ingestion to the Cluster URI, ingestion from query, or
.set-or-appendcommands.
Note
Failed ingestion logs are only reported for the final state of an ingest operation, unlike the Ingestion result metric, which is emitted for transient failures that are retried internally.
- Successful ingestion operations: These logs have information about successfully completed ingestion operations.
- Failed ingestion operations: These logs have detailed information about failed ingestion operations including error details.
- Ingestion batching operations: These logs have detailed statistics of batches ready for ingestion (duration, batch size, blobs count, and batching types).
You can choose to send the log data to a Log Analytics workspace, a storage account, or stream it to an event hub.
Enable diagnostic logs
Diagnostic logs are disabled by default. Use the following steps to enable diagnostic logs for your cluster:
In the Azure portal, select the cluster resource that you want to monitor.
Under Monitoring, select Diagnostic settings.
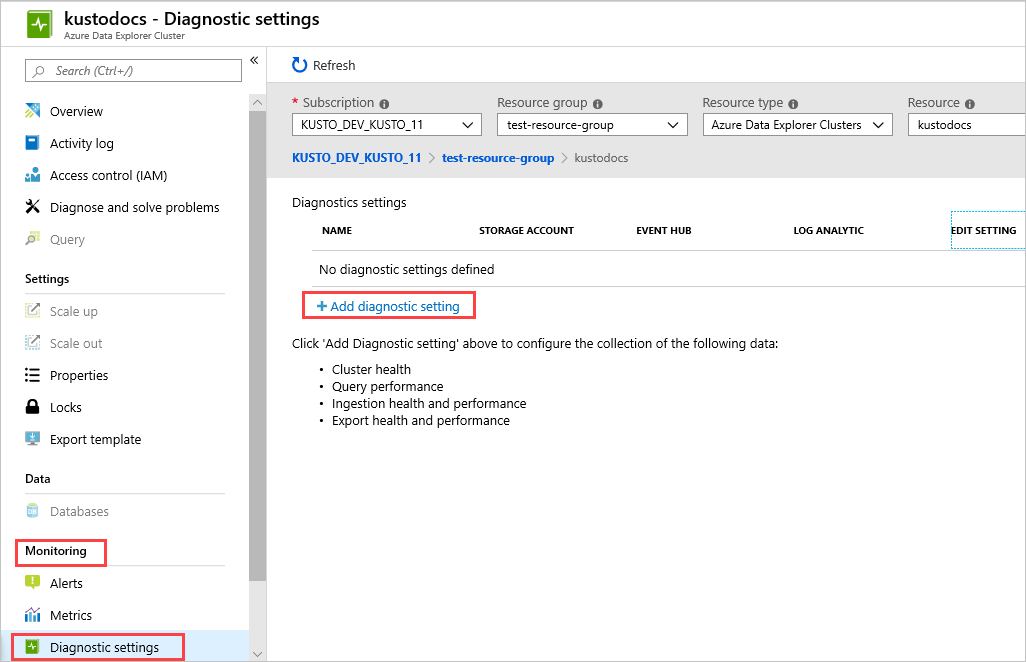
Select Add diagnostic setting.
In the Diagnostic settings window:
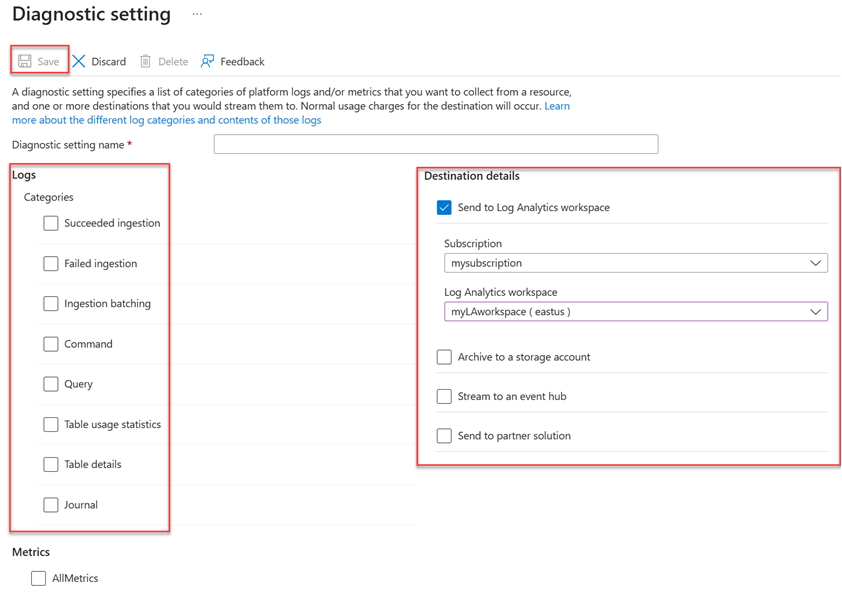
- Enter a Diagnostic setting name.
- Select one or more destination targets: a Log Analytics workspace, a storage account, or an event hub.
- Select logs to be collected: Succeeded ingestion, Failed ingestion, Ingestion batching, Command, Query, Table usage statistics, Table details, or Journal.
- Select metrics to be collected (optional).
- Select Save to save the new diagnostic logs settings and metrics.
Once the settings are ready, logs will start to appear in the configured destination targets (a storage account, an event hub, or Log Analytics workspace).
Note
If you send logs to a Log Analytics workspace, the SucceededIngestion, FailedIngestion, IngestionBatching, Command, Query, TableUsageStatistics, TableDetails, and Journal logs will be stored in Log Analytics tables named: SucceededIngestion, FailedIngestion, ADXIngestionBatching, ADXCommand, ADXQuery, ADXTableUsageStatistics, ADXTableDetails, and ADXJournal respectively.
Diagnostic logs schema
All Azure Monitor diagnostic logs share a common top-level schema. Azure Data Explorer events have their own unique properties that are described in the following schema references:
- SucceededIngestion
- FailedIngestion
- For information about error codes, see Ingestion error codes
- ADXIngestionBatching
- For information about batching types, see Batching policy
- ADXCommand
- ADXQuery
- ADXTableUsageStatistics
- ADXTableDetails
- ADXJournal
Related content
- Use metrics to monitor cluster health
- Tutorial: Ingest and query monitoring data in Azure Data Explorer for ingestion diagnostic logs
Feedback
Kommer snart: I hele 2024 udfaser vi GitHub-problemer som feedbackmekanisme for indhold og erstatter det med et nyt feedbacksystem. Du kan få flere oplysninger under: https://aka.ms/ContentUserFeedback.
Indsend og få vist feedback om