Bemærk
Adgang til denne side kræver godkendelse. Du kan prøve at logge på eller ændre mapper.
Adgang til denne side kræver godkendelse. Du kan prøve at ændre mapper.
Important
This feature is for public preview customers only. Features in preview might not be complete and could undergo changes before becoming available in the broader release.
The Copilot Studio agents report can help you understand the adoption and impact of agents built in Microsoft Copilot Studio that are deployed across various channels within your organization.
This report can help you answer questions such as:
- What are the top agents being used?
- What are top agents' high-level KPI-like sessions, satisfaction scores, and success rates?
- What is the impact of individual agents, such as the split of engaged sessions and topics distribution, as well as the impact of agent-assisted hours?
Example Agent KPIs
- Measuring agent engagement. Learn more.
- Measuring agent outcomes. Learn more.
What's covered in this report:
Agents built in Microsoft Copilot Studio that are deployed in channels such as:
- Custom and demo websites
- Microsoft Teams and Microsoft 365 Copilot
- Mobile apps
- Azure bot service channels such as Skype, Twilio, and Microsoft Cortana
What's not covered in this report:
Agents built using Microsoft Copilot Studio which are published to Microsoft 365 Copilot and Copilot Chat using the setting Make agent available in Microsoft 365 Copilot
Agents built using Agent Builder in Microsoft 365 Copilot
Autonomous Agents that proactively respond to signals across your business and initiate tasks, which can be configured to react to events or triggers without human intervention. Learn more.
Agents that use generative AI instead of classic orchestration. Learn more about generative versus classic orchestration.
Agents built outside of Microsoft Copilot Studio like within Microsoft Sharepoint or third-party apps
Prerequisites
This report is enabled for tenants who meet the following eligibility criteria:
- Tenant must have at least 50 Copilot licenses.
- Tenant must have at least one Microsoft Copilot Studio license, either standalone, pay-as-you-go, or bundled with Copilot, and have created at least one agent and published it within a "Production" environment. Learn more.
In addition, before you can run the query and populate the report in Power BI, you’ll need to:
- Be assigned the role of Insights Analyst in Viva Insights. Learn more about how to assign roles.
- Have the June 2022 (or newer) version of Power BI Desktop installed. If you have an earlier version of Power BI installed, uninstall it before installing the new version. Then go to Get Power BI Desktop to download and install the latest version.
- Ensure that data from Copilot Studio flows to Viva Insights. By default, Copilot Studio data flows to Viva Insights.
Report setup
Run query
In the Viva Insights analyst experience, select Create analysis.
Under Power BI templates, navigate to Copilot Studio agents report and select Set up analysis. The template can also be found under the Copilot section.
Under Query setup:
- Enter a Query name.
- Select a Time period, which defaults to Last 1 months.
Note
To start, you can only run an analysis covering the last month, but eventually you'll be able to select a wider time period as Microsoft Copilot Studio collects more data.
Set Auto-refresh (optional). You can set the query to automatically update by selecting Auto-refresh. When you select this option, your query automatically runs and computes a new result every time Viva Insights gets updated agent data.
Enter a Description (optional).
Note
The More settings pane also contains Group by and Metric rule settings. This Power BI query is set to Group by Month, and you can't change this setting, and neither can you change the Metric rule setting.
Under Predefined template metrics, view a list of preselected metrics, which appear as gray tags. These metrics are required to set up the Power BI report and you can't remove them. You can't add other metrics for this report.
Under Select which agents you want to include in the query, add filters to narrow down the agents in scope for your report. You can filter by agent name, agent surface, and agent type.
Under Select which agent attributes you want to include in the query, attributes are selected automatically. Once the query runs, you can use these attributes to group and filter the reports.
Important
This Power BI query needs some specific attributes to run, and we've preselected them for you. These attributes appear in gray and you can't remove them. You can't add other attributes by selecting Add attributes.
Select Run on the upper right. The query might take a few minutes to run.
Access query results
You can access the report in two ways:
View the report in the browser. Use this option if you only want to view the report.
Open the Power BI template in Power BI desktop and connect to your query results. Use this option if you want to customize the report or share it with others in your organization by publishing the report to the Power BI Service.
View report in the browser
To view the report in the browser, go to the Query results page and select the eye icon in the View column. Select Open in new tab if you want to keep the report in the background while doing other tasks in the analyst experience.
Open the Power BI template in Power BI Desktop
Go to the Query results page and select the Power BI icon in the Actions column to download the Power BI template and get the query and partition identifiers. You'll need these identifiers later.
Open the downloaded template.
If you're prompted to select a program, select Power BI.
When you're prompted by Power BI:
- Paste in the partition and query identifiers.
- Select Load to import the query results into Power BI.
If prompted by Power BI, sign in using your organizational account. Power BI then loads and prepares the data. For large files, this process might take a few minutes.
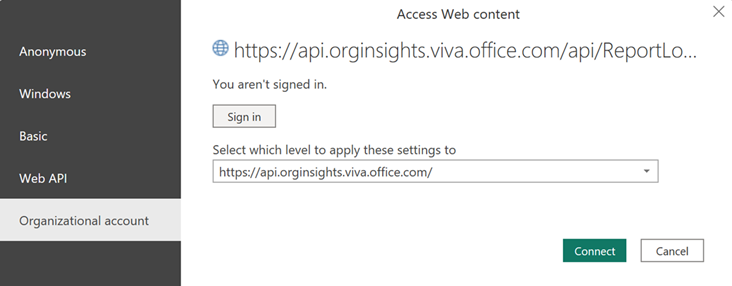
Important
You need to sign in to Power BI with the same account you use to access Viva Insights. If available, select Organizational account from the left. You might have to sign in more than once.
Page-level settings
Each report page includes the following settings at the top:
Time period for the report – Select the start and end date for the data you'd like to view.
Apply filters – Select the Category, Agent name, and Agent usage type to filter the Agents shown in the report.
About this report
The Copilot Studio agents report includes the following report pages to help you better understand agent adoption and KPIs across your organization.
Agent Overview
This page provides an initial overview of adoption of the agents across the organization for the selected filters. The card on the left shows the total number of active agents based on engaged sessions. The left also has cards which show the total number of engaged agent sessions and the impact of agents based on Agent assisted hours. Learn more about measuring agent engagement and outcomes.
The card in the middle of the page shows how the number of active agents, number of sessions, and agent assisted hours have changed over time. Use the dropdown to toggle between the metrics.
The card on the right identifies the top five agents based on the number of monthly engaged sessions.
At the top of the page, you can also filter by Category and Usage type. For Usage type, select Internal to see metrics for internal employee-facing scenarios. Select External to see metrics for agents used externally, such as on public websites.
Identify top agents used across the organization
This page lets you focus on top agents sorted in descending order based on the number of monthly engaged sessions, and explore the key Agent KPIs.
You can filter the agents on this page using the Category, Agent name, and Usage type such as internal or external to the organization.
Individual agent deep dive
This page provides a deep dive into specific KPIs for particular agents using your selected filters. The chart on the left shows the number of engaged sessions over time, and you can toggle between this and Agent session outcomes based on Resolution, Abandons, and Escalations.
The chart in the middle of the page also shows the Agent satisfaction score for the selected timeframe, as well as the number of Agent assisted hours that could be gained by deploying the agent across the organization. For each task in a conversational agent session, the metric compares the difference between the time a human would take and the time an agent actually took, and it sums these differences across all tasks and sessions.
The chart on the right shows the number of sessions per topic for the agent in the selected timeframe. Learn more about topics in Copilot Studio.
Agent assisted hours
Agent assisted hours estimates the amount of time employees saved by using an agent to perform tasks. It uses the number of engaged agent sessions, number of knowledge source references, session outcomes, and a time savings multiplier to calculate the total agent assisted hours. This metric helps businesses understand efficiency gains and time savings by deploying agents.
Here's the formula for the metric:
Agent assisted hours = (Number of knowledge source references + Weighted number of sessions without knowledge sources) x Time savings multiplier
A given agent might have multiple sessions, some with references to knowledge sources and others without these references. For each knowledge source reference, the amount of time saved for the employee is estimated to be equal to the value of the time savings multiplier. For the sessions without knowledge source references, there might also be time savings, which are estimated based on the outcome of the session. Resolved sessions count as a full session, while escalated and abandoned sessions are weighted at 0.7. These weights are determined by estimating the extent of task completion based on a Microsoft analysis of session duration for each outcome type.
The time savings multiplier is customizable, with a default value based on research on AI usage, including studies by Microsoft's Office of the Chief Economist (see "The strain of searching") showing an average of six minutes of time saved for tasks involving information retrieval (see study #4 in section 2 of the blog post), as well as studies highlighting six-minute time savings for writing tasks (see study #1 in section 2 of the blog post). For additional guidance on how to maximize these productivity gains, see Agents of Change. The default multiplier is an estimate and might be refined over time as new data become available.
To edit the value of the multiplier, select the calculator, where you'll see a breakdown of how this metric is calculated for a specific agent. If you change the value, it updates for all agents in the report.
Agent assisted value
This is an estimate of the value of an agent's impact over the given time period, calculated by multiplying Agent assisted hours by an average hourly rate. By default, this hourly rate is set to $72, based on data compiled by the U.S. Bureau of Labor Statistics. To update the average hourly rate, select the Calculator, where you'll see a breakdown of how the total value is calculated with your updated setting.
To toggle between Agent assisted hours and Agent assisted value, select the appropriate symbol at the top right of the card.
Delete Copilot Studio agents data
The admin can delete the existing agents data for the tenant using PowerShell. Learn how.
After the data is deleted, the query won't auto-refresh, and you can't run any new queries for one month.
Where to find Power Platform admin center settings
- Microsoft 365 Service setting
- Setting for Data flow from Microsoft Copilot Studio to Viva Insights
- Cross Geo setting