Hinweis
Für den Zugriff auf diese Seite ist eine Autorisierung erforderlich. Sie können versuchen, sich anzumelden oder das Verzeichnis zu wechseln.
Für den Zugriff auf diese Seite ist eine Autorisierung erforderlich. Sie können versuchen, das Verzeichnis zu wechseln.
Important
Heatmap is only displayed on the site pages where the Clarity tracking code is installed. Check the Setup process to know how to install it.
Click Heatmap helps you understand the critical content on the page. It also allows you to identify parts of the design user mistake for links.
Clarity uses absolute ranking across all page views. Sometimes the page impression might not show the element the user clicked.
Click Heatmaps can help you determine where your users are clicking, including the nonlinks. On PC, Clarity tracks your user clicks. Clarity tracks your user taps on mobile/tablet.
You can view click maps for a single page or group of pages.
Tip
Refer to Heatmaps overview to learn about different types of Clarity Heatmaps.
Different types of Click maps
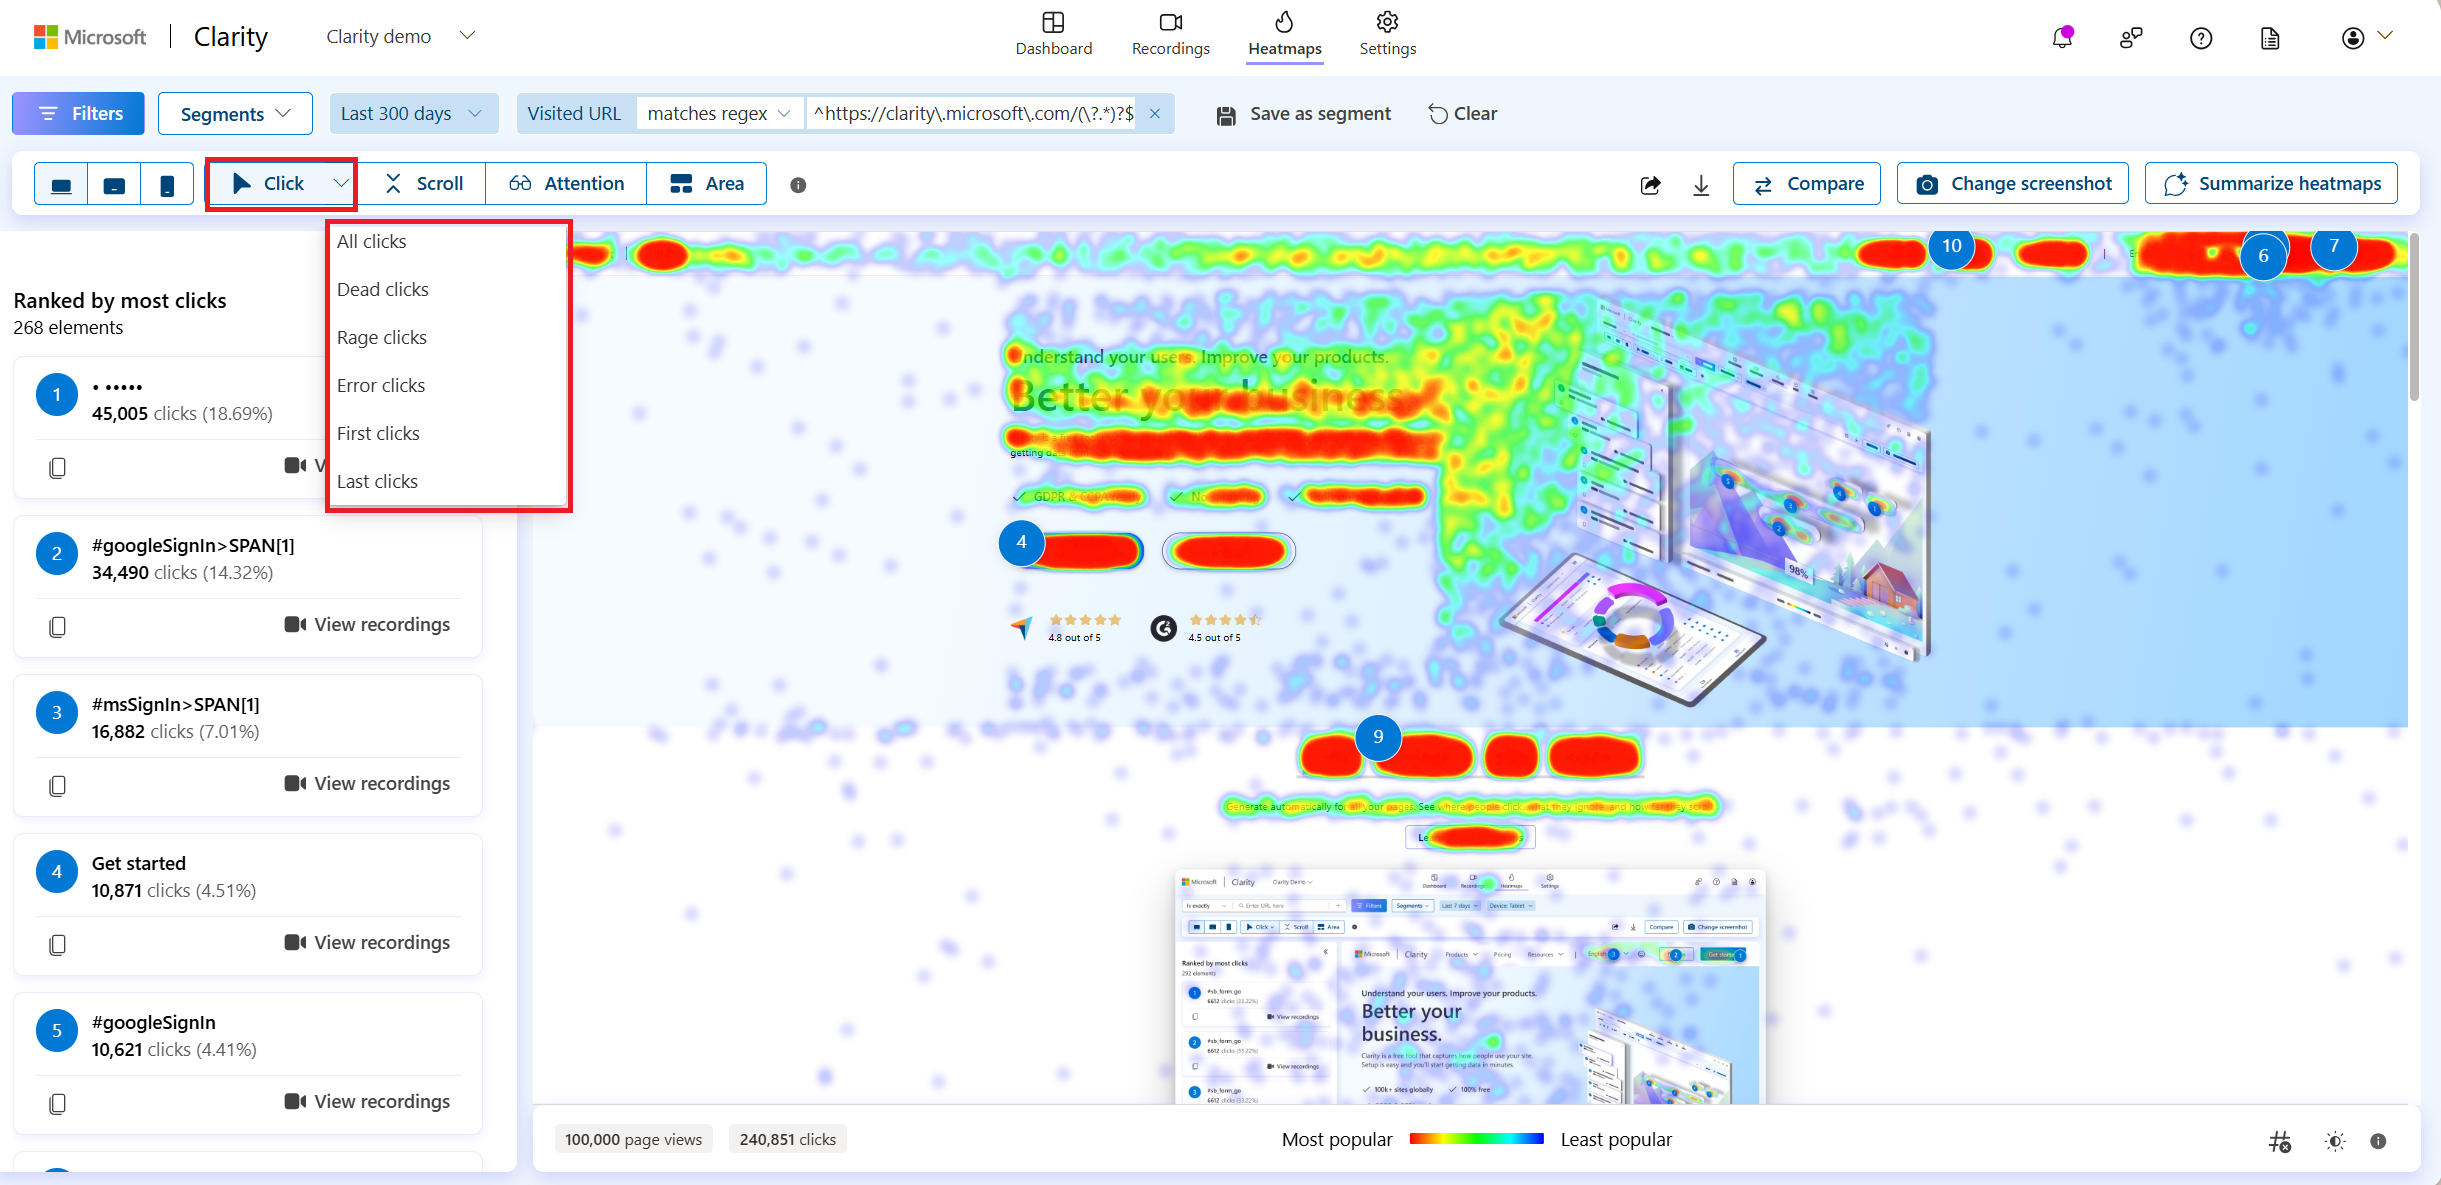
There are different types of Click maps available:
All clicks: shows all types of user clicks on a page, including dead clicks, rage clicks, first clicks, and last clicks.
Dead clicks: shows where users clicked on a page with no effect/response. Learn more about Dead clicks.
Rage clicks: shows where users clicked rapidly in the same small area within a brief period. Learn more about Rage clicks.
Error clicks: shows clicks that occur immediately before JavaScript errors. Learn more about JavaScript errors.
First clicks: shows initial user clicks on a page. These clicks are useful to find out user onboarding patterns.
Last clicks: shows final user clicks on a page. These clicks are useful to find user flow patterns.
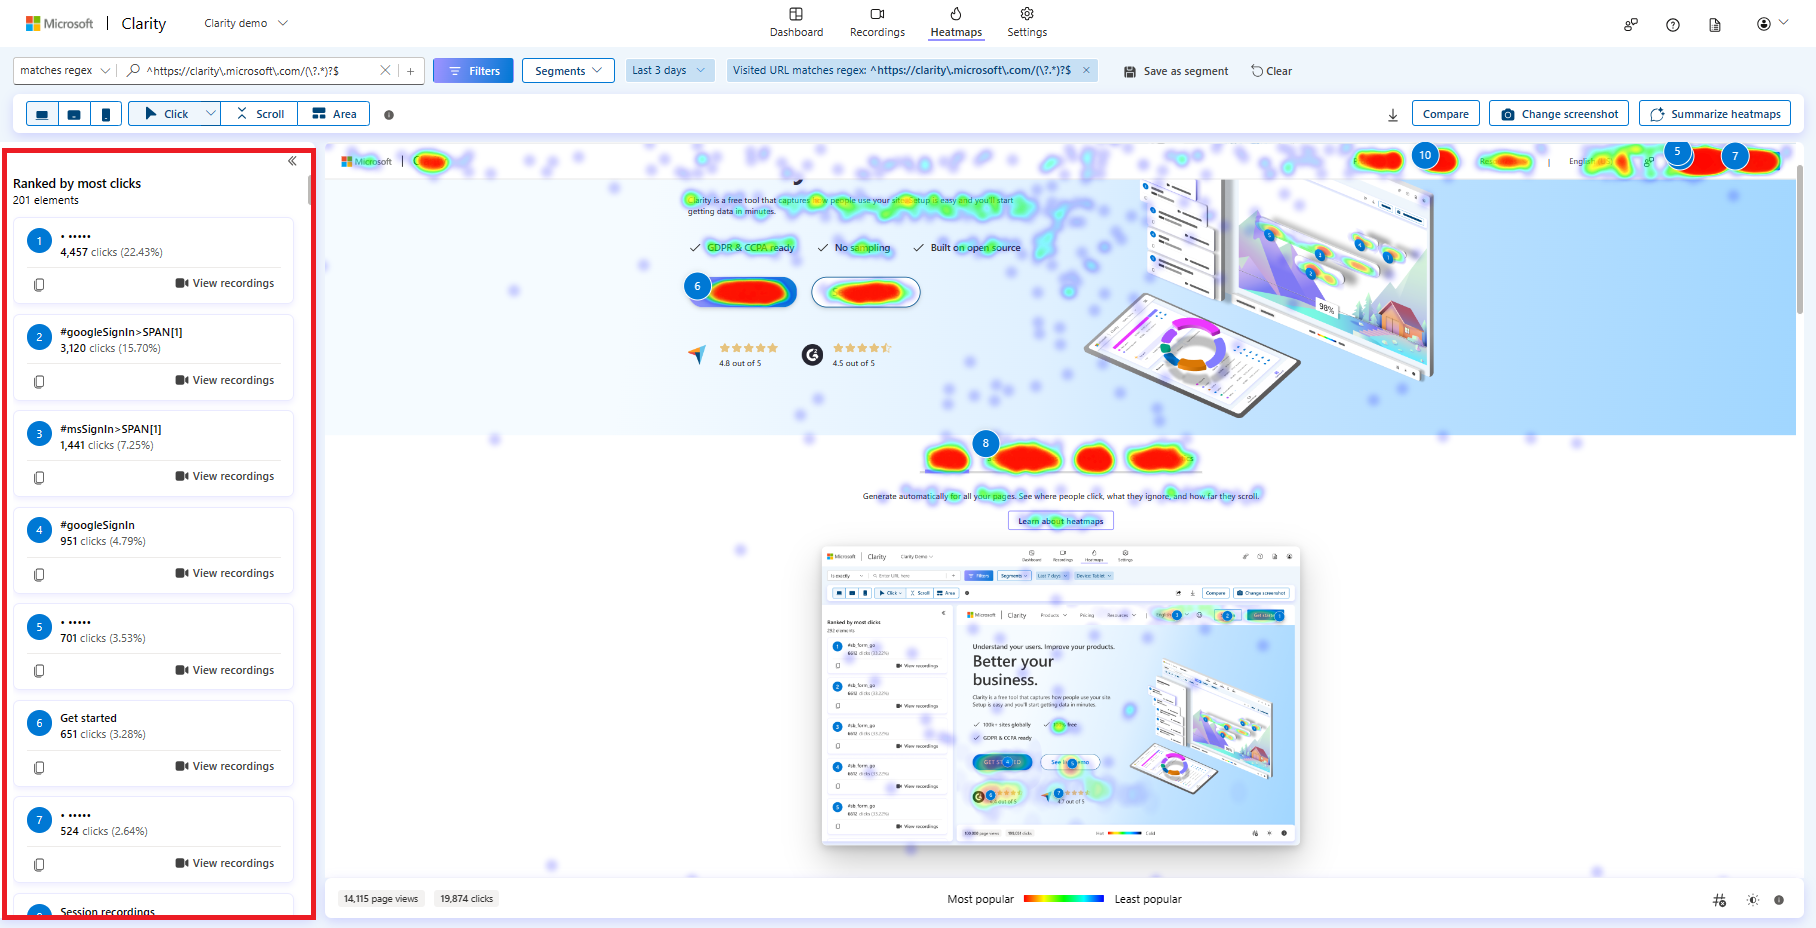
Left panel
The left panel contains elements ranked by the number of clicks. Click map displays these ranks elements with the most number of clicks on the page. As you change the type, the data is updated accordingly.
Click data
Scroll to the bottom to view elements ranked further down the page. Select any clicked element to view the number of clicks (% of clicks). Expand (>>) to view or collapse (<<) to close the click data.
View recordings
You can also view the recordings either by selecting the recordings icon or by selecting View recordings. View recordings help you watch recordings where the element was clicked.
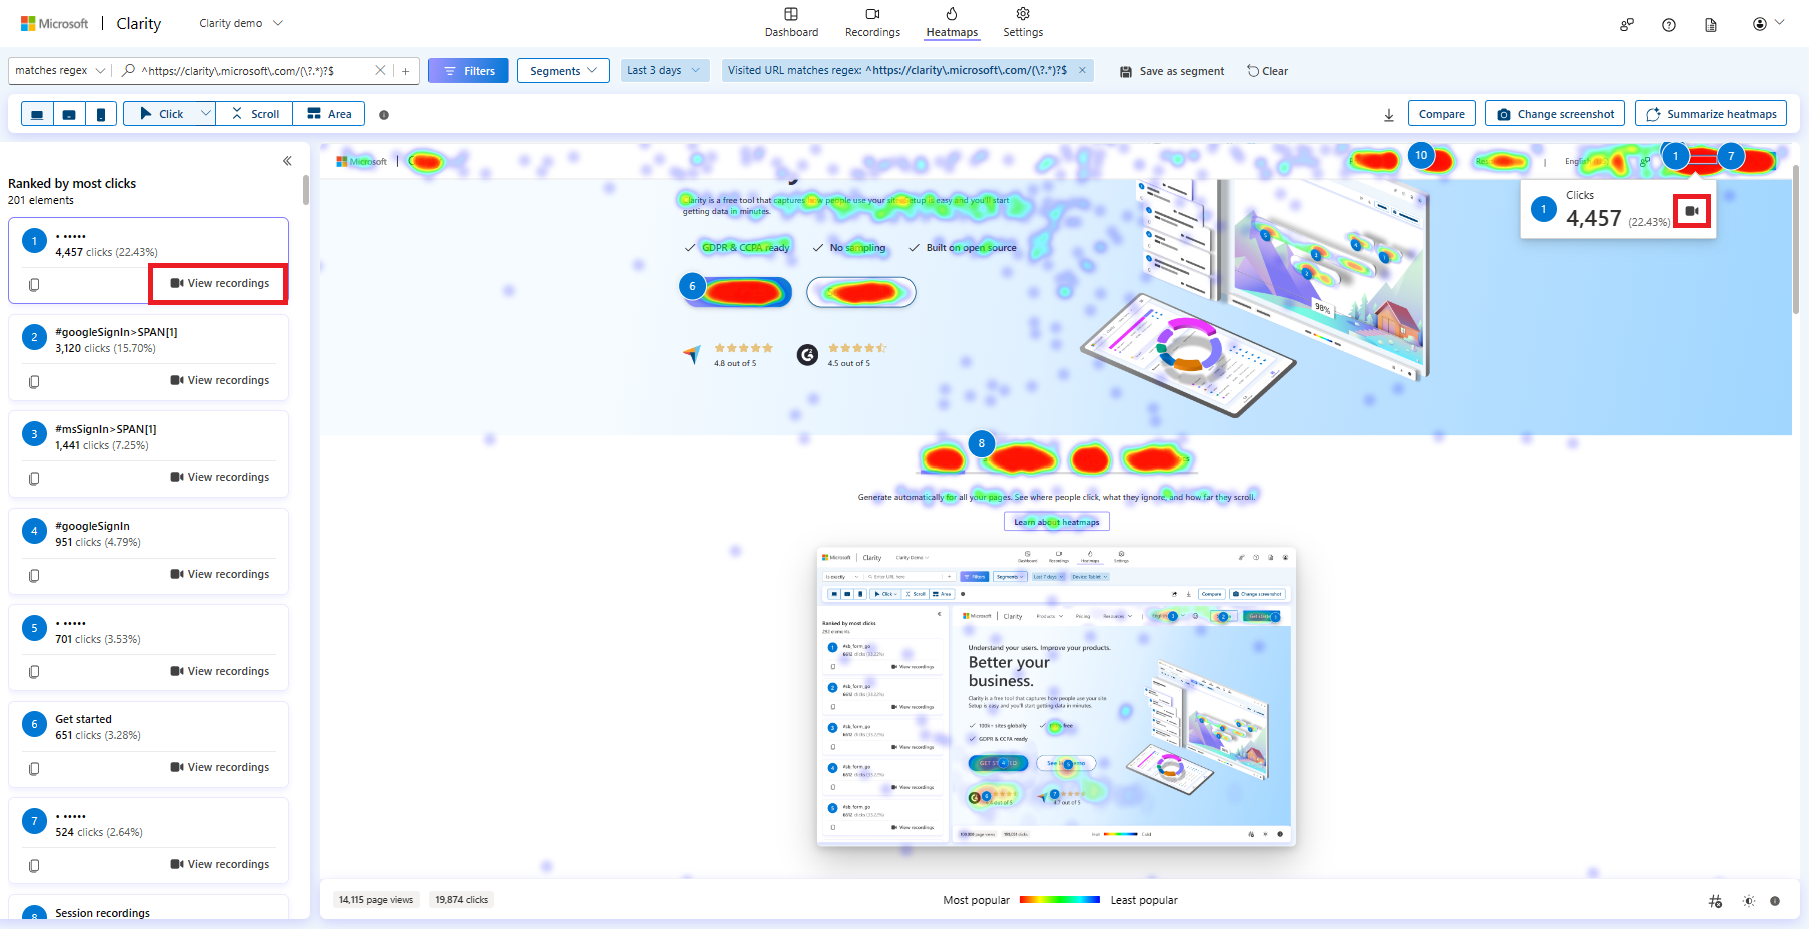
When you select this button an element badge appears, indicating the applied filter. Learn more about badge labels.
Note:
- Once applied, this filter appears on Recordings, Dashboard, and Heatmaps verticals.
- You can access it later by saving it as a segment or sharing it.
Badge label limitations:
- This filter can only be set through a heat map and can’t be selected from filters.
- If you close the filter, you have to set it through Heatmaps again.
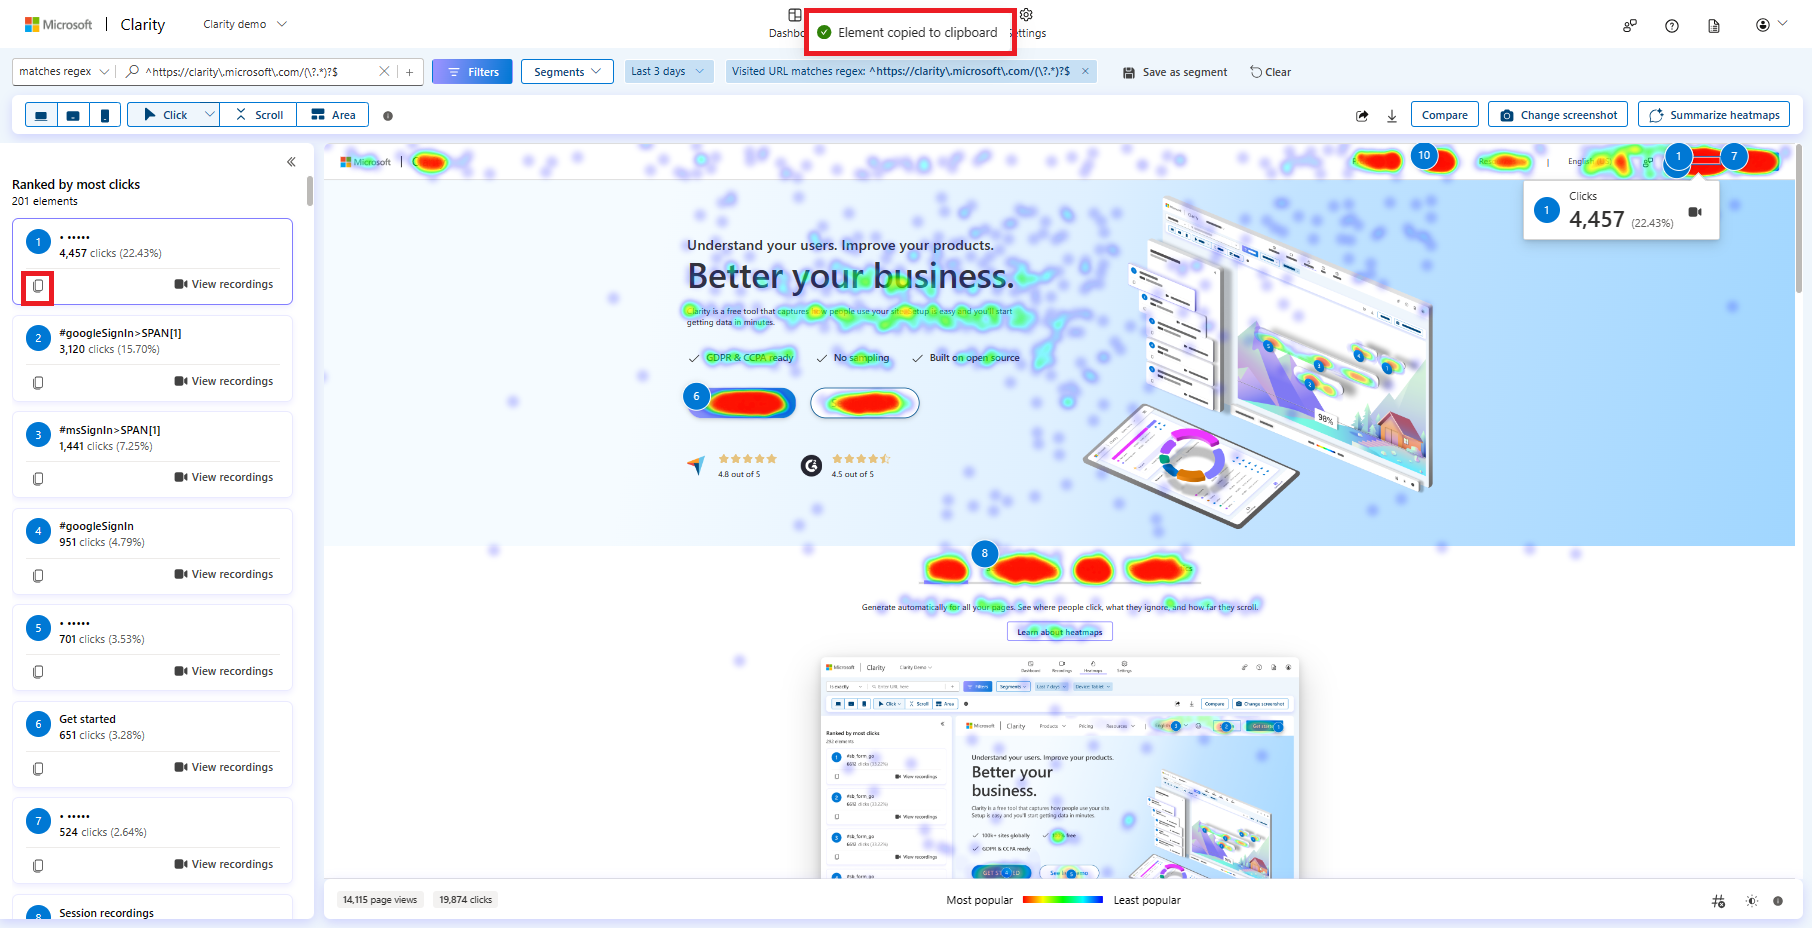
Copy Element
Copy the element to the clipboard by selecting the copy icon. This copies the CSS selector of an element that allows you to identify the exact element in the UI. You can use it to change the style of an element.
Top panel
The top panel helps you customize the Click maps visualization:

Filters: Refer to the Filters overview to learn more.
Segments: Refer to Segments to learn more.
Time frame: Edit the time frame to better view the heatmaps. You can select from today, yesterday, or custom days or time frame.
Visited URL: This autofill search bar along with regex match contains all the websites that are part of Clarity's project. You can add multiple path filters to view heatmaps for group of pages. The other applied filters are also shown here. You can also save the filters as a segment or clear it.
Supported devices: Choose PC/Tablet/Mobile view to understand user behavior on these devices.
Heatmaps types: You can switch scroll maps, area maps, attention maps, and conversion maps.
Sharing: Share the click map with others.
Download: Download the click map as a CSV or PNG.
Compare: Compare two same or different heatmaps.
Change screenshot: Select another screenshot to view click maps.
Summarize heatmaps: Summarize heatmaps to easily understand the user behaviors and trends of your website pages.
Bottom panel

Page views and Clicks: The total number of page views and the total number of clicks on a page (or group of pages) for applied filters. The page views are limited to up to 100,000 per Heatmap.
Color scale: Colors get warmer as the popularity of a section increases. The warmer the colors, the denser the clicks.
Show Heatmap ranks: Toggle to either turn on or off the ranks on a heatmap.
Opacity: This control helps change the transparency of heat when the heat covers up the text or images. You can use opacity to view the heat in red zones quickly.
FAQ
For more answers, refer to Heatmap FAQ.