Identify issues with Call Quality Dashboard
Microsoft Teams Call Quality Dashboard (CQD) provides a summary view of an organization's calls and meetings on a monthly, daily, or hourly basis. It enables an organization to investigate problems based on quality, failure, and in-product user feedback.
CQD is designed to help Microsoft Teams administrators, Skype for Business admins, and network engineers monitor call and meeting quality at an organization-wide level. The near real-time data enables Teams admins to quickly resolve troubleshooting efforts by drilling down to find where issues originated, and who was affected.
Suppose a user's poor call quality is because of a network issue that also affects other users. The individual call experience isn't visible in CQD, but the overall quality of calls made using Microsoft Teams is captured.
Note
Wherever CQD includes end-user identifiable information (EUII) data, it's managed in the same way as EUII throughout Microsoft 365.
Permissions to access Call Quality Dashboard
Employees who aren't administrators, such as help desk agents, can use CQD if they're assigned the Teams Communications Support Engineer, Teams Communications Support Specialist, or Reports Reader role.
Users with the following roles can access the Call Quality Dashboard:
- Global Administrator
- Global Reader
- Skype for Business Administrator
- Teams Service Administrator
- Teams Communications Administrator
- Teams Communications Support Engineer
- Teams Communications Support Specialist
- Reports Reader
The Call Quality Dashboard (CQD) in Teams admin center
CQD data can be accessed using several different methods, including:
- Teams admin center
- CQD portal (Teams admin center >Analytics & Reports > Call Quality Dashboard)
- Graph API
- Power BI
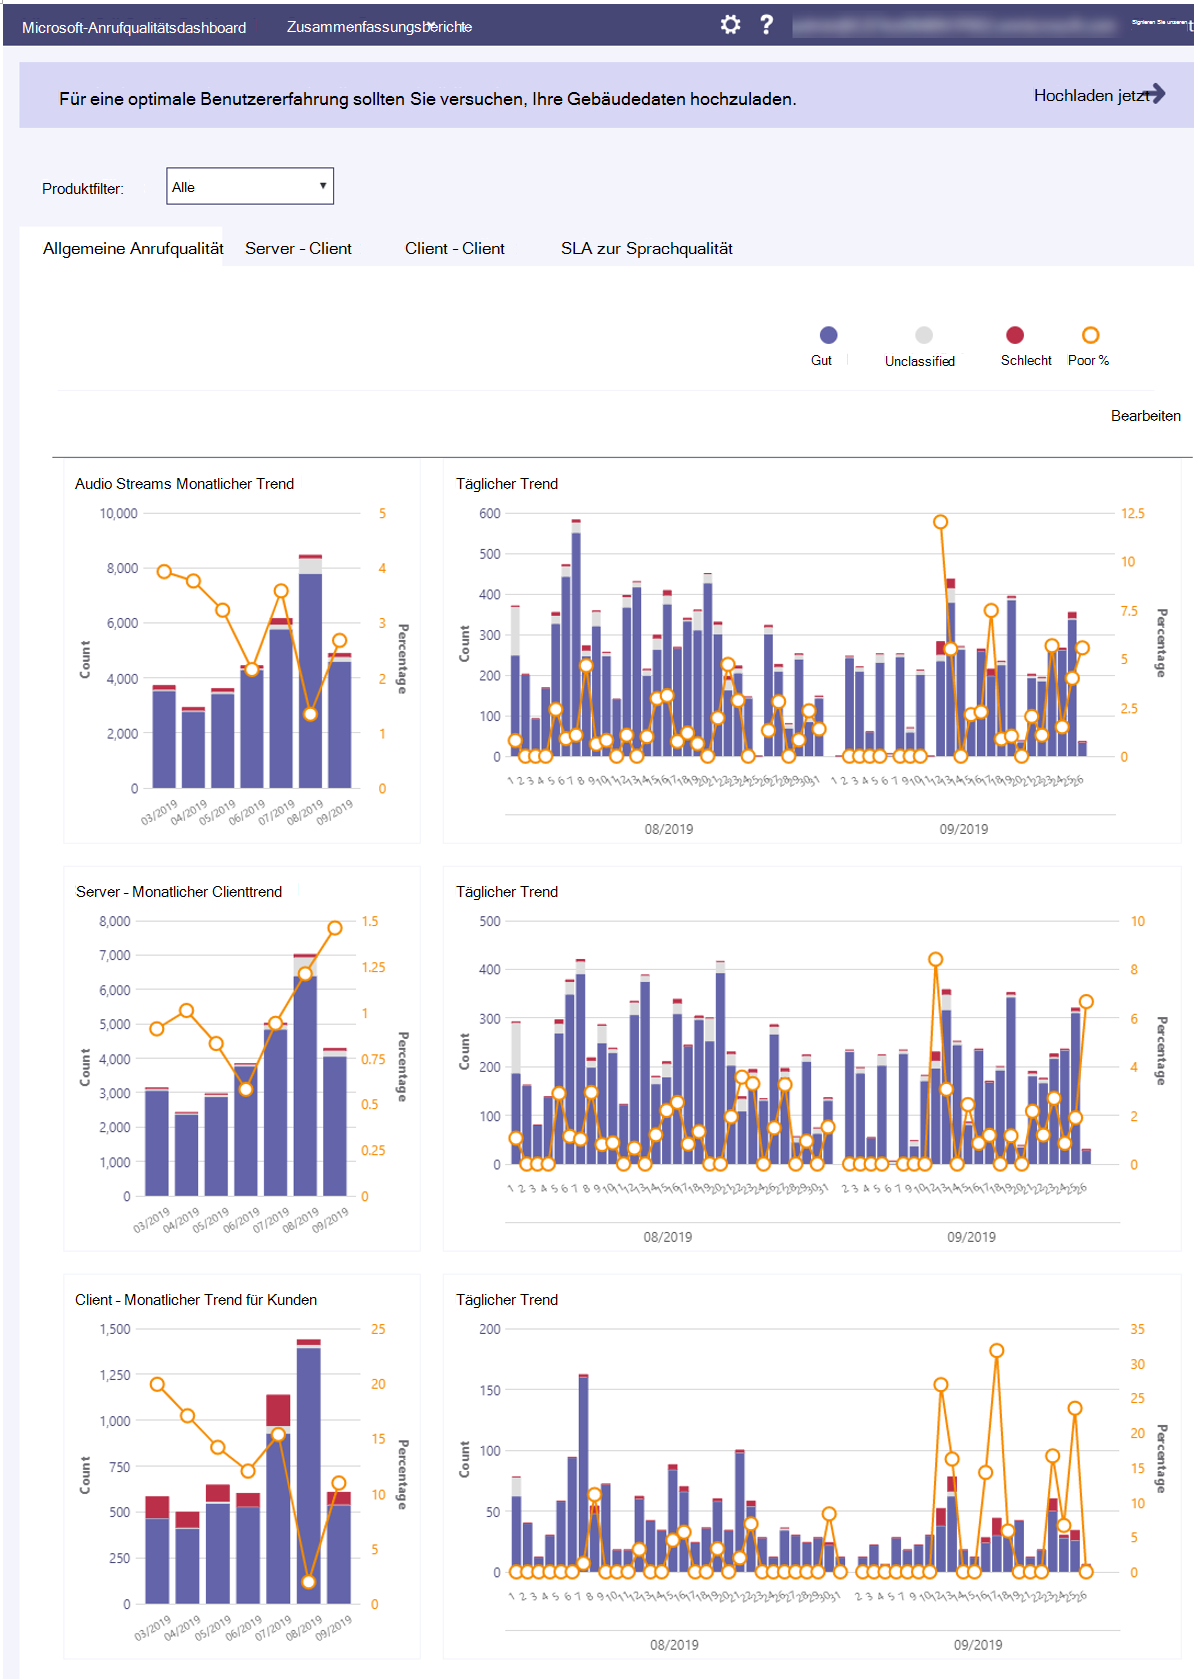
When you first sign into the CQD Portal, you'll see the summary reports. These show daily and monthly call quality trends. Call quality is classified as good, poor, or unclassified.
In the Product Filter, select All, Microsoft Teams, or Skype for Business. Using the tabs, select Overall Call Quality, Server-Client, Client-Client, or Voice Quality SLA.
Summary reports
These reports are displayed on the CQD Dashboard when you first sign in to CQD. They provide an at-a-glance look at quality trends with daily, monthly, and table reports to assist with identifying subnets that have poor quality.
| Tab | Description |
|---|---|
| Overall Call Quality | Aggregate of the other 3 tabs. |
| Server—Client | Details of the streams between server and client endpoints. |
| Client—Client | Details of the streams between two client endpoints. |
| Voice Quality SLA | Info about calls included in the Skype for Business voice quality SLA. |
Tenant Data information
The CQD Summary Reports dashboard includes a Tenant Data Upload page, accessed by selecting Tenant Data Upload from the settings menu in the top-right corner. This page is used for admins to upload their own information, such as:
- A map of IP address and geographical information.
- A map of each wireless AP and its MAC address.
- A map of Endpoint to Endpoint Make/Model/Type, etc.
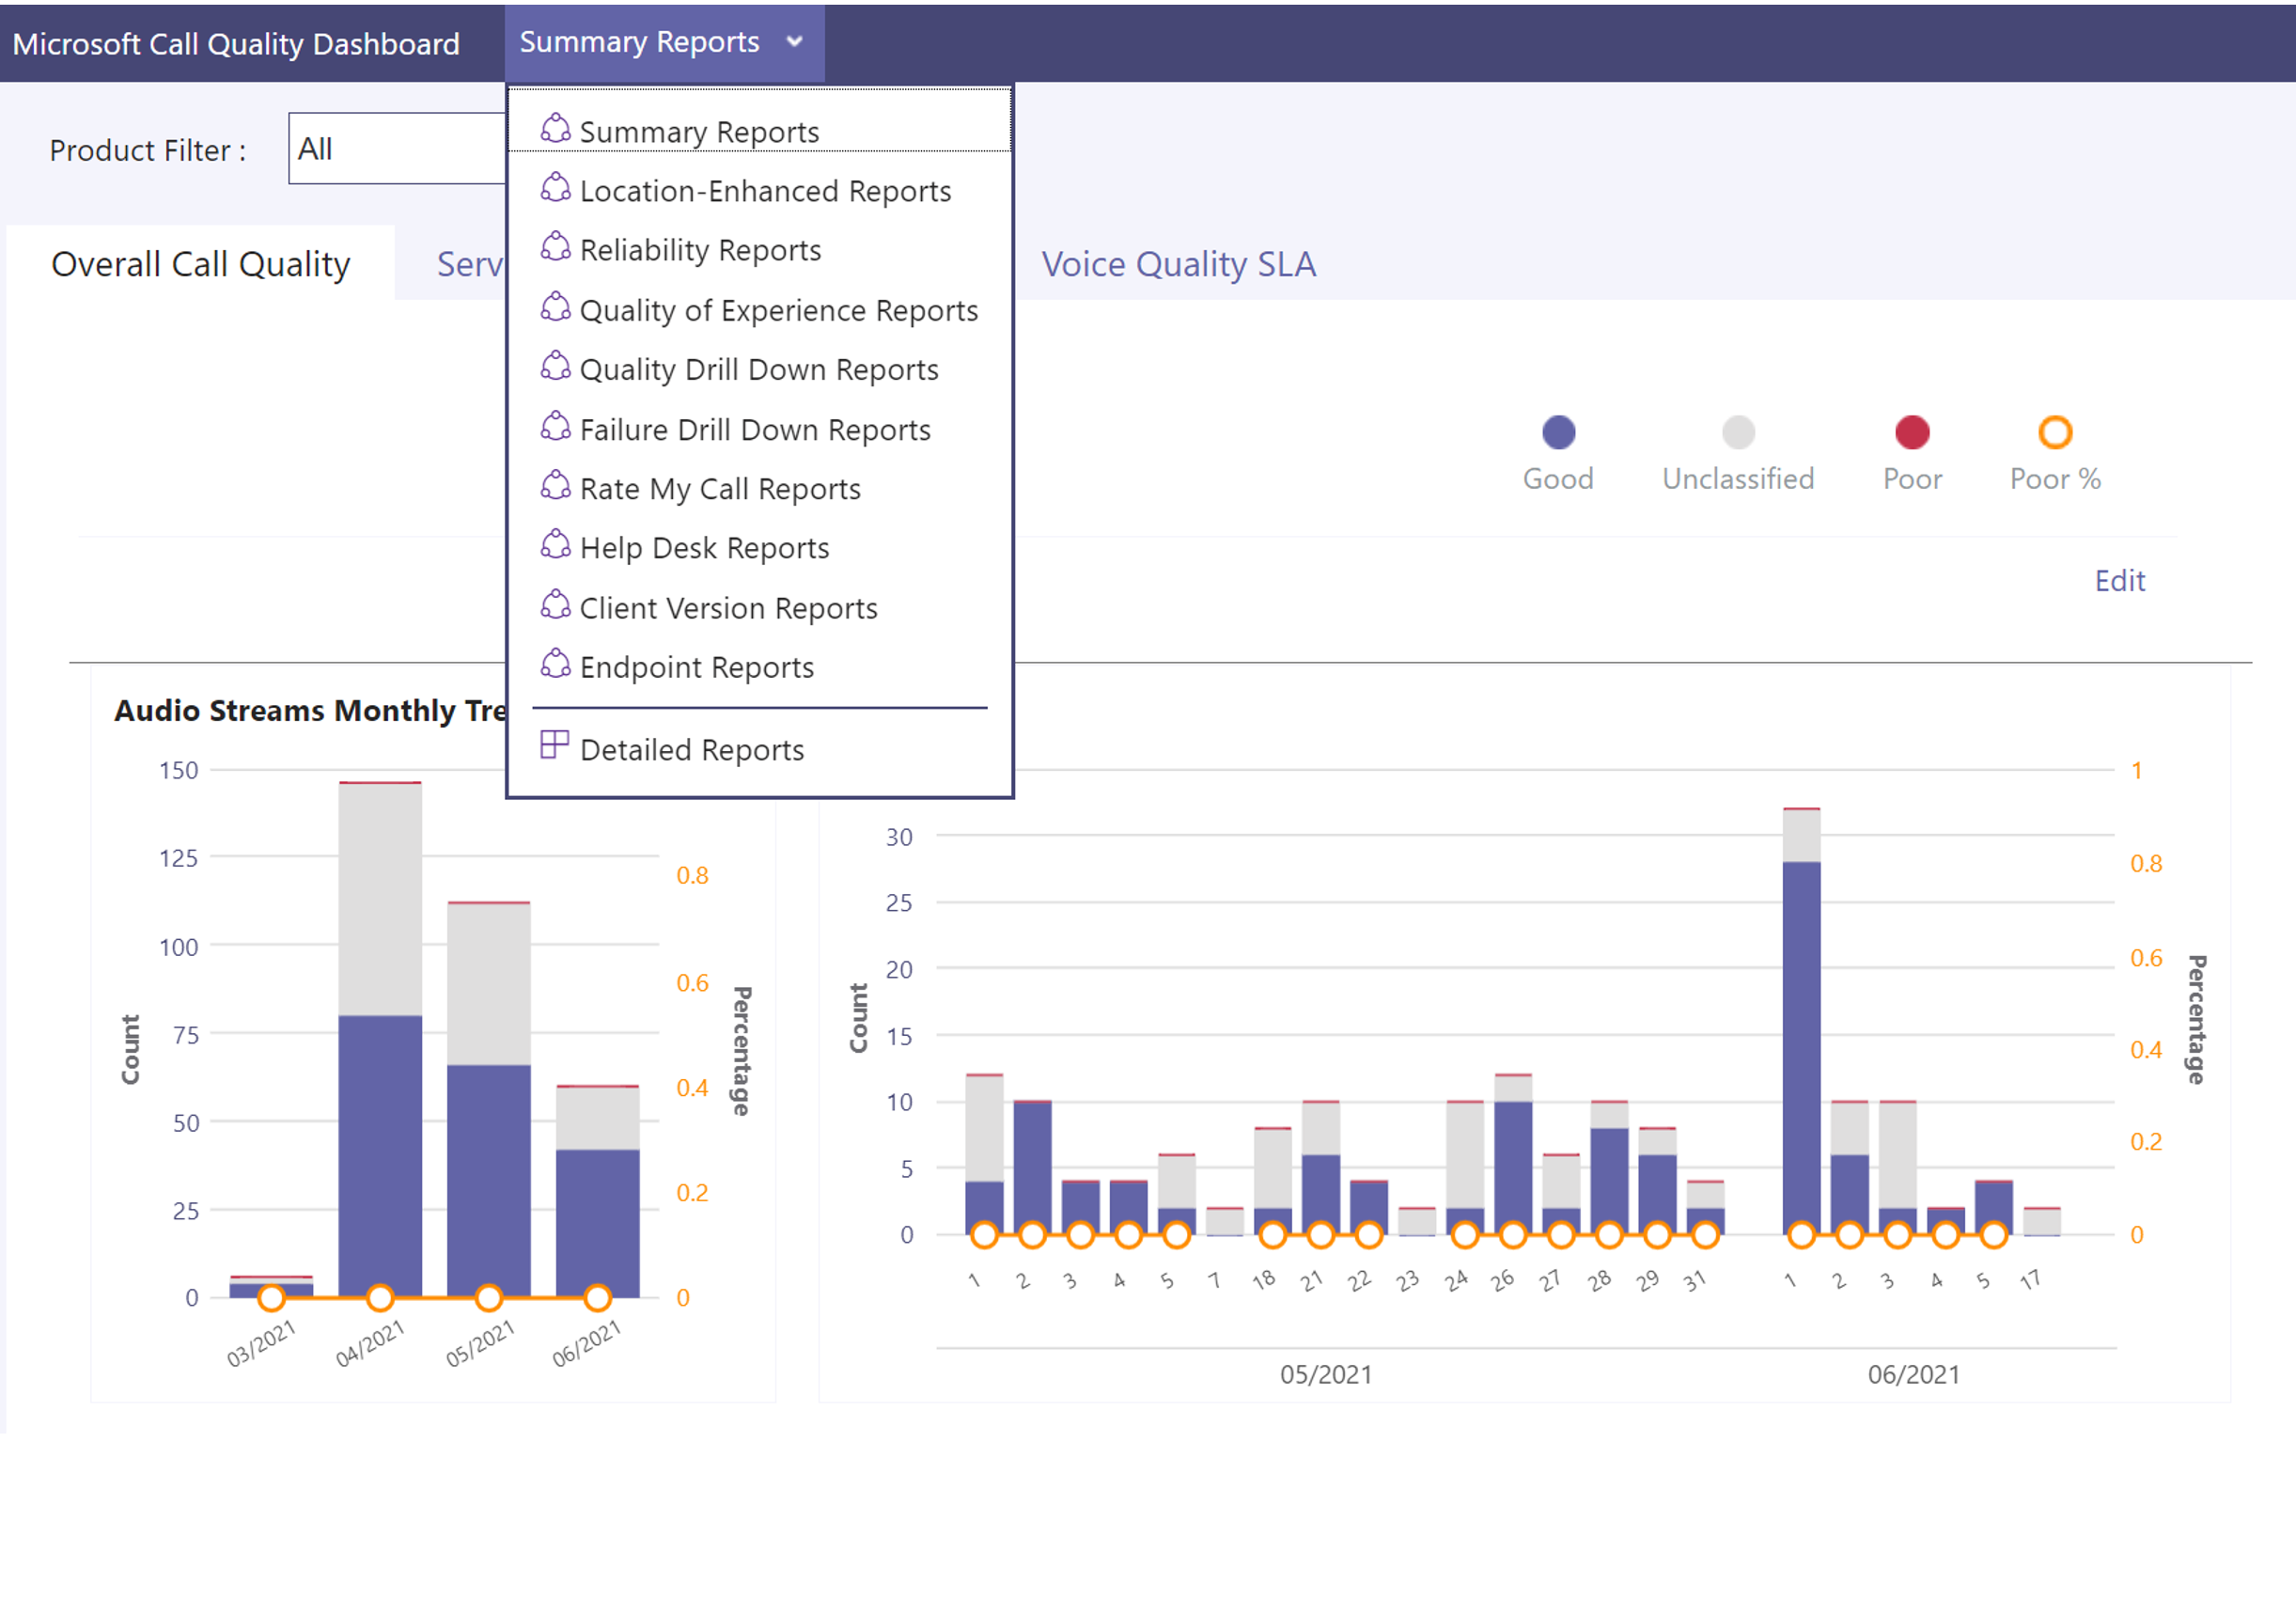
Detailed reports
Use the menu at the top to select other reports. For each type of report, you can filter and show different selections.
| Name | Description |
|---|---|
| Location-Enhanced Reports | Shows quality trends based on location information. This report appears only if you've uploaded your tenant data. |
| Reliability Reports | Includes audio, video, video-based screen sharing (VBSS), and app sharing reports. |
| Quality of Experience Reports | Audio quality and reliability for all clients and devices, including meeting rooms. These reports are a “slimmed-down” version of the downloadable CQD templates, focusing on key areas for analyzing audio quality and reliability. |
| Quality Drill Down Reports | Drill downs: Date by region, locations, subnets, hour, and users. |
| Failure Drill Down Reports | Drill downs: Date by region, locations, subnets, hour, and users. |
| Rate My Call Reports | Analyze user call ratings by region, location, or by user. Includes verbatim feedback. |
| Help Desk Reports | Help Desk Reports look at call and meeting data for individual users, groups of users, or everyone. Incorporating building and end-user personal information, these reports help identify possible system issues based on network location, conference details, devices, or firmware. |
| Client Version Reports | Client Version Summary: View the Sessions and Users counts for each client app version Client Version by User: View user names for each client app version Pre-built filters for Product and Client Type help focus the versions to specific clients. |
| Endpoint Reports | Shows call quality by machine endpoints (computer make and model). |
Reporting labels and alerts rules
Monitoring and alerting capabilities for Microsoft Teams are available in the Teams admin center. Use different sets of rules available under the Notifications & alerts section in the Teams admin center to monitor Teams capabilities and receive alerts. For example, you can actively monitor the health of Teams devices such as IP Phones, Teams Rooms on Android, and others if they unexpectedly go offline.
You can use Teams monitoring and alerting to do the following items:
- Automatically manage Teams capabilities
- Be alerted if they show something unexpected.
- Take corrective actions to get things back on-track.
How to manage monitoring and alerting
You must be a global admin in Microsoft 365 or a Teams service admin to configure alerting rules. See Use Teams administrator roles to manage Teams to learn more about Teams admin roles and which reports each admin role can access.
- Sign in to the Teams admin center.
- From the left navigation, select Notifications & alerts.
- Choose the rule you want to configure from Rules.
Add and update reporting labels
Reporting labels are used in your organization to indicate the physical locations of offices, buildings, or organizational sites. The Reporting labels page in the Microsoft Teams admin center lets you provide a text file (.csv or .tsv) containing a list of physical locations and their associated network subnets. This file is used by Call Analytics for generating reports. When you upload your subnet mapping, the reports provided by these services will contain the location names as well, making the reports easier to understand and use for remediating any potential issues. Important: Reporting Labels that you upload will be handled as Support Data under your agreement for Office 365, including any information that would otherwise be considered Customer Data or Personal Data. Please don't include data you do not wish to provide to Microsoft as Support Data, as this information will be visible to Microsoft Engineers for support purposes. The report labels and locations data you provide is a single data structure – there's currently no interface available to make individual edits to the data.
Edit the table of subnets and locations
- In the left navigation of the Microsoft Teams admin center, click Analytics & reports > Reporting labels.
- Click Upload data.
- In the Upload data pane, click Select a file, and then browse to and upload your edited .csv or .tsv file.
- Click Upload.