Note
Access to this page requires authorization. You can try signing in or changing directories.
Access to this page requires authorization. You can try changing directories.
Microsoft Discovery CogLoop is the AI orchestration engine that drives investigation progress. Cognition Engine logs capture:
- Instance lifecycle - Cognition Engine instance start, stop, and polling activity
- Reasoning decisions - Thinking module (fast/slow) and acting module tool selections
- Task management operations - Task execution, validation, status transitions, and agent assignments
- Error diagnostics - Serialization failures, Cosmos DB connectivity issues, loop errors, and tool call failures
It continuously runs two subloops - Act and Cognition to plan and execute research tasks on your behalf. CogLoop logs are automatically stored in the DiscoveryCogLoopLogs_CL table in the Log Analytics workspace inside the workspace's Managed Resource Group (MRG).
Important
DiscoveryCogLoopLogs_CL is an Auxiliary tier table. Each query must target this table only (cross-table joins aren't supported).
This article explains how to query CogLoop logs to monitor investigation activity, diagnose stalls, and investigate orchestration errors.
Prerequisites
Before you begin, navigate to the Log Analytics workspace in your workspace's MRG. For instructions, see Access resource logs for Microsoft Discovery resources.
Key identifiers
Before writing queries, familiarize yourself with the following identifiers:
| Identifier | Description | Where to find it |
|---|---|---|
InstanceId |
Unique ID for an investigation's CogLoop instance, in the format cog:{project}:{investigation}-{shortHash} |
Construct from your project name and investigation name in Discovery Studio, for example, cog:testworkspace:investigation1-436edc |
ModuleName |
Which subloop generated the log: Act or Cognition |
Extracted from the Properties JSON field |
CorrelationId |
W3C trace ID, present on user-triggered operations | Returned in API responses |
Query CogLoop logs
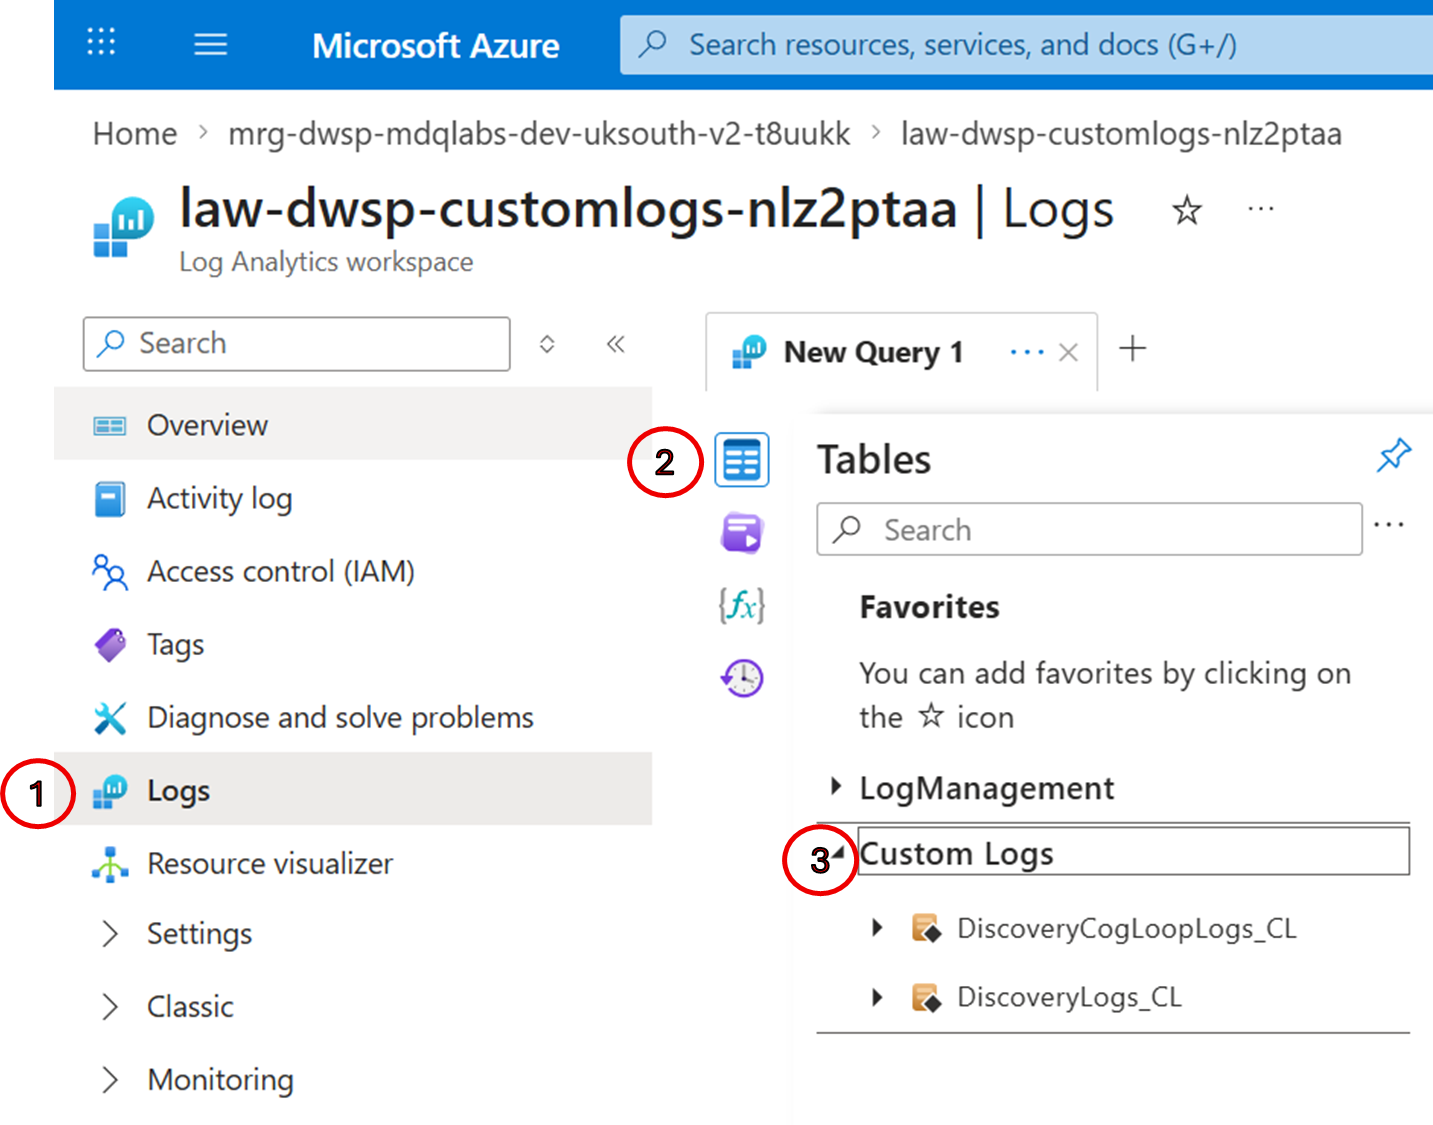
After opening the Logs interface in the workspace's MRG Log Analytics workspace:
- In the left panel, select the Tables tab.
- Expand Custom Logs and locate
DiscoveryCogLoopLogs_CL. - Select Run next to
DiscoveryCogLoopLogs_CLto execute a default query and confirm logs are being ingested.
Log schema
The DiscoveryCogLoopLogs_CL table includes the following key fields:
| Field Name | Description |
|---|---|
TimeGenerated |
Timestamp when the log entry was ingested |
TimeStamp |
A more precise timestamp with millisecond precision representing when the log entry was generated |
LogLevel |
Log severity level: Debug, Information, Warning, or Error |
Message |
Primary log message content |
Exception |
Full exception details including stack trace (populated on error entries) |
Properties |
JSON object containing structured properties such as InstanceId, ChosenTool, ModuleName, ClassName, MethodName, and others |
CorrelationId |
Unique identifier for correlating related requests |
TenantId |
Azure tenant identifier |
Key Properties (inside the Properties JSON field)
| Property | Description |
|---|---|
InstanceId |
Cognition Engine instance identifier (format: cog:<project>:<investigation>) |
ModuleName |
Reasoning module name (Cognition or Act) |
ChosenTool |
The tool/function selected by the PickBest decision engine |
ClassName |
Source class name (for example, CogLoopInstanceManager, CosmosDbService) |
MethodName |
Source method name |
Goal |
The reasoning prompt goal submitted to the PickBest engine |
SleepTime |
Wait duration in seconds when the Cognition Engine decides to wait |
TaskName |
Task identifier for task management operations |
Attempt |
Retry attempt number for validation operations |
Result |
Tool execution result summary |
Example queries
View recent logs
DiscoveryCogLoopLogs_CL
| take 100
Filter by time range
DiscoveryCogLoopLogs_CL
| where TimeGenerated > ago(1h)
| order by TimeGenerated desc
View all errors and warnings
Quick sweep of all CogLoop errors and warnings, useful to confirm whether there were any issues during a specific investigation session.
DiscoveryCogLoopLogs_CL
| where TimeGenerated > ago(1h)
| where LogLevel in ("Error", "Warning")
| project TimeGenerated, LogLevel, Message
| order by TimeGenerated desc
Adjust ago(1h) to ago(6h), ago(1d), and so on, as needed.
Log Volume by Level Over Time
Charts the volume of Cognition Engine log entries per hour by severity level. Each log level renders as a separate line, making it easy to spot error spikes.
DiscoveryCogLoopLogs_CL
| where TimeGenerated > ago(24h)
| summarize Count = count() by LogLevel, bin(TimeGenerated, 1h)
| order by TimeGenerated desc
| render timechart
An Error spike pinpoints when an incident started. A simultaneous drop in Information suggests the Cognition Engine is failing before completing reasoning cycles. It shows when things broke, how severe it was, and whether the service has recovered.
List All Cognition Engine Instances
Lists every Cognition Engine instance (investigation) managed by the service and classifies their activity into three operation types.
- InstanceId - The investigation identifier (format: cog:
<project>:<investigation>). - StatusChecks - Routine polling checks. The service checks all known instances each cycle, so this count is typically similar across instances.
- Starts - How many times the instance was started. Instances with Starts > 0 were actively launched during the time window.
- Retrievals - How many times instance state was fetched for execution. Indicates the Cognition Engine actively engaged with this investigation.
DiscoveryCogLoopLogs_CL
| where TimeGenerated > ago(24h)
| where Message has "IsInstanceRunningAsync" or Message has "StartInstanceAsync" or Message has "GetRunningInstanceAsync"
| extend
    InstanceId = tostring(parse_json(Properties).InstanceId),
    Operation = case(
        Message has "StartInstanceAsync", "Started",
        Message has "GetRunningInstanceAsync", "Retrieved",
        "StatusCheck")
| where isnotempty(InstanceId)
| summarize
    LastSeen = max(TimeGenerated),
    StatusChecks = countif(Operation == "StatusCheck"),
    Starts = countif(Operation == "Started"),
    Retrievals = countif(Operation == "Retrieved")
    by InstanceId
| order by Starts desc, Retrievals desc, LastSeen desc
The sort order puts instances with real lifecycle activity (starts, retrievals) at the top, so you can quickly distinguish actively running investigations from those just being polled.
Check whether a specific CogLoop instance is running
Verify whether CogLoop is actively monitoring your investigation. Replace <your-project> with your project name.
DiscoveryCogLoopLogs_CL
| where TimeGenerated > ago(15m)
| where Message has "IsInstanceRunningAsync"
| extend InstanceId = extract(@"InstanceId: (cog:[^\s]+)", 1, Message)
| where InstanceId has "<your-project>"
| summarize last_checked = max(TimeGenerated) by InstanceId
| order by last_checked desc
A result with a last_checked within the past few minutes indicates the instance is actively being polled. No results means CogLoop isn't monitoring the investigation.
List all active investigations being monitored
See which investigations CogLoop is currently tracking, useful when you want to confirm whether your investigation is in scope.
DiscoveryCogLoopLogs_CL
| where TimeGenerated > ago(30m)
| where Message has "IsInstanceRunningAsync"
| extend InstanceId = extract(@"InstanceId: (cog:[^\s]+)", 1, Message)
| where isnotempty(InstanceId)
| summarize last_seen = max(TimeGenerated) by InstanceId
| order by last_seen desc
Track Instance Startup
Retrieves the full chronological log trail for a specific Cognition Engine instance, showing every event from first appearance through its reasoning cycles Replace <your-instance-id> with the target instance (for example, cog:myproject:inv01-experiment-abc123).
- TimeGenerated - When the event occurred, sorted oldest-first to reconstruct the sequence of events.
- LogLevel - Severity level, useful for spotting where errors or warnings interrupted the instance lifecycle.
- Message - The log message content, showing startup steps, reasoning decisions, task operations, and any failures in order.
DiscoveryCogLoopLogs_CL
| where TimeGenerated > ago(24h)
| extend InstanceId = tostring(parse_json(Properties).InstanceId)
| where InstanceId == "<your-instance-id>"
| project TimeGenerated, LogLevel, Message
| order by TimeGenerated asc
This query is useful to view a specific investigation's behavior. It lets you trace exactly what the Cognition Engine did, in what order, and where things went wrong.
View all activity for a specific investigation
Retrieve the complete CogLoop activity log for one investigation. Replace cog:<your-project>:<your-investigation> with the full InstanceId prefix, for example, cog:fabforbook:leukemia-2.
DiscoveryCogLoopLogs_CL
| where Message has "cog:<your-project>:<your-investigation>"
| project TimeGenerated, LogLevel, Message
| order by TimeGenerated asc
View errors for a specific investigation
View all errors and warnings for a single investigation instance.
DiscoveryCogLoopLogs_CL
| where LogLevel in ("Error", "Warning")
| where Message has "cog:<your-project>:<your-investigation>"
    or Exception has "cog:<your-project>:<your-investigation>"
| project TimeGenerated, LogLevel, Message, Exception
| order by TimeGenerated asc
Diagnose why CogLoop isn't making progress
CogLoop enters a wait loop when it's blocked, typically waiting for a running task to complete or for human intervention on a flagged task.
DiscoveryCogLoopLogs_CL
| where Message has_any ("No task updates", "Skipping redundant action", "Cognition-Wait")
| extend InstanceId = extract(@"InstanceId: (cog:[^\s]+)", 1, Message)
| extend SleepTime = toint(extract(@"wait period of (\d+) seconds", 1, Message))
| project TimeGenerated, LogLevel, InstanceId, SleepTime, Message
| order by TimeGenerated desc
Cognition Reasoning Loop
Detect Cognition Wait Loops
If the Cognition Engine repeatedly selects Cognition-Wait, it can mean tasks are stalled, all work is already complete, or an internal error is preventing progress.
- IdlePct - Percentage of waits where nothing changed. Sustained 100% signals a stuck investigation.
- AvgSleepSec - Short sleeps (30s) mean cognition expects progress soon; long sleeps (300s) mean it has stopped trying.
- SampleReason - The LLM's own explanation
DiscoveryCogLoopLogs_CL
| where TimeGenerated > ago(6h)
| where Message has "PickBest Result" and Message has "Cognition-Wait"
| extend
    WaitResult = iff(Message has "NO UPDATE", "Idle", "Progress"),
    SleepTime = toint(extract(@"sleepTime[^\d]*(\d+)", 1, Message)),
    Reasoning = extract(@""""Reasoning"""":\s*""""([^""""]+)", 1, Message)
| summarize
    Waits = count(),
    IdlePct = round(100.0 * countif(WaitResult == "Idle") / count(), 0),
    AvgSleepSec = round(avg(SleepTime), 0),
    SampleReason = take_any(Reasoning)
    by bin(TimeGenerated, 30m)
| where Waits > 3
| order by TimeGenerated desc
This query groups waits into 30-minute windows and surfaces whether cognition is idle or making progress.
View Slow and Fast Thinking Activity
Trace the reasoning steps the Cognition Engine takes before acting. Slow thinking indicates complex deliberation; fast thinking indicates straightforward decisions.
- TimeGenerated - When the thinking step completed.
- ThinkingType -
FastThinkingorSlowThinking, indicating the depth of reasoning applied. - Message - The full thinking output, including the thought content and reasoning context.
DiscoveryCogLoopLogs_CL
| where TimeGenerated > ago(6h)
| where Message has "thinking completed for thought"
| extend ThinkingType = iff(Message has "Slow thinking", "SlowThinking", "FastThinking")
| project TimeGenerated, ThinkingType, Message
| order by TimeGenerated desc
If
SlowThinkingentries dominate, the Cognition Engine is spending significant effort on complex decisions, this may be expected for difficult investigations or could indicate unclear task definitions forcing repeated deep analysis.
Task Management Operations
Track Task Execution Lifecycle
Retrieves the complete chronological log trail for a specific task, covering its full lifecycle: assignment, agent selection, execution, validation, and completion. Replace <your-task-id> with the target task name.
let taskId = "<your-task-id>";
DiscoveryCogLoopLogs_CL
| where TimeGenerated > ago(24h)
| where Message contains taskId
| project TimeGenerated, LogLevel, Message
| order by TimeGenerated asc
This is the primary query for debugging a specific task, it shows exactly how the Cognition Engine handled the task from creation to completion (or failure), making it easy to pinpoint where and why a task stalled or failed.
View Task Validation Results
Lists every task validation event, showing when and how the Cognition Engine evaluated task results. The Message field contains the validation outcome: Complete, Incomplete, Needs User Attention, or Failed.
DiscoveryCogLoopLogs_CL
| where TimeGenerated > ago(24h)
| where Message has "TASKMANAGEMENT: tool call: ValidateTask"
| project TimeGenerated, Message
| order by TimeGenerated desc
Useful for understanding why a task was marked complete or sent back for rework. If you see repeated
Incompleteresults for the same task, it may indicate the assigned agent is not producing satisfactory output, or the validation criteria are too strict.
View TaskValidationAgent Lifecycle
Traces the full lifecycle of the TaskValidationAgent from provisioning and upsert through invocation and completion. Shows whether the validation agent was successfully created and is being used by the Cognition Engine.
DiscoveryCogLoopLogs_CL
| where TimeGenerated > ago(24h)
| where Message has "TaskValidationAgent"
| project TimeGenerated, LogLevel, Message
| order by TimeGenerated asc
If no entries appear, the TaskValidationAgent was never provisioned, tasks will not be validated. If entries show errors during upsert or invocation, check that the required model deployment (e.g.,
gpt-5-2) is available in the workspace.
Error Diagnostics
View All Errors with Exceptions
List all error entries with their full exception details for root-cause analysis.
DiscoveryCogLoopLogs_CL
| where TimeGenerated > ago(24h)
| where LogLevel == "Error"
| project TimeGenerated, Message, Exception
| order by TimeGenerated desc
Analyze Error Patterns
Summarize errors by message to identify the most frequent failure modes.
- ErrorMessage - The first 80 characters of the error message, used as a grouping key to cluster similar errors together.
- ErrorCount - How many times each error occurred. The highest counts point to the most impactful issue.
DiscoveryCogLoopLogs_CL
| where TimeGenerated > ago(24h)
| where LogLevel == "Error"
| summarize ErrorCount = count() by ErrorMessage = substring(Message, 0, 80)
| order by ErrorCount desc
If one error type vastly outnumbers the rest, start your troubleshooting there, it is likely the root cause. For example, a high count of
JsonExceptionserialization errors typically cascades into Cosmos DB health failures, polling cycle errors, and tool call failures downstream.
Detect Cosmos DB Connectivity Issues
Cosmos DB health failures prevent the Cognition Engine from retrieving instance state and can stall all investigations.
DiscoveryCogLoopLogs_CL
| where TimeGenerated > ago(24h)
| where Message has "Cosmos DB health check failed" or Message has "Cosmos DB is unreachable"
| summarize FailureCount = count() by bin(TimeGenerated, 15m)
| order by TimeGenerated desc
| render timechart
Detect Serialization Errors (JsonException)
Isolates JSON serialization errors and groups them by message, including a sample stack trace for each. These errors typically prevent the Cognition Engine from loading instance state from Cosmos DB, blocking all reasoning activity.
- ErrorMessage - The first 80 characters of the error message, grouping related serialization failures together.
- Count - How many times each serialization error occurred. High counts confirm it's a systemic issue rather than a one-off.
- SampleException - A full exception with stack trace, showing the exact JSON path and property that failed to deserialize (for example,
AuthorRole).
DiscoveryCogLoopLogs_CL
| where TimeGenerated > ago(24h)
| where LogLevel == "Error"
| where Exception has "JsonException"
| summarize
    Count = count(),
    SampleException = take_any(Exception)
    by ErrorMessage = substring(Message, 0, 80)
| order by Count desc
Serialization errors are often the root cause behind cascading failures. When instance state cannot be deserialized, it triggers downstream errors: Cosmos DB health check failures, polling cycle errors, and tool call failures. Use the
SampleExceptionto identify the specific schema mismatch, this typically happens after a service upgrade that changes model schemas.
Detect Polling Cycle Failures
Polling cycle errors prevent the Cognition Engine from discovering and starting new work.
DiscoveryCogLoopLogs_CL
| where TimeGenerated > ago(24h)
| where Message has "Error during polling cycle"
| project TimeGenerated, Message, Exception
| order by TimeGenerated desc
Error Timeline for Incident Investigation
Correlate errors over time to identify when an incident started and whether it's ongoing.
DiscoveryCogLoopLogs_CL
| where TimeGenerated > ago(24h)
| where LogLevel == "Error"
| summarize ErrorCount = count() by bin(TimeGenerated, 5m)
| order by TimeGenerated desc
| render timechart
Use this query during incident investigation to answer three key questions: when did the problem start, is it still happening, and did a fix or restart resolve it. Pair with the Analyze Error Patterns query to identify what type of error is driving the spike.
Health and Service Status
Detect Unhealthy Periods
Find time windows where health checks reported unhealthy status, which correlates with service disruptions.
DiscoveryCogLoopLogs_CL
| where TimeGenerated > ago(24h)
| where Message has "Health check" and Message has "Unhealthy"
| extend
    HealthCheckName = tostring(parse_json(Properties).HealthCheckName),
    Description = tostring(parse_json(Properties).HealthCheckDescription)
| summarize UnhealthyCount = count() by HealthCheckName, bin(TimeGenerated, 15m)
| order by TimeGenerated desc
| render timechart
Monitor Instance Retrieval Errors
Repeated failures in instance retrieval indicate the service can't load investigation state from Cosmos DB.
DiscoveryCogLoopLogs_CL
| where TimeGenerated > ago(24h)
| where Message has "Error retrieving all cogloop instances"
| summarize FailureCount = count() by bin(TimeGenerated, 15m)
| order by TimeGenerated desc
| render timechart
What to look for in the results:
| Pattern | Meaning |
|---|---|
Repeated No task updates during wait period of 60 seconds |
CogLoop is waiting for a running task to finish; check the associated Act task for status |
Skipping redundant action: Cognition-Wait with result: NO UPDATE |
Cognition is also blocked; no new decisions are being made |
| Pattern persists for hours | A task may be FLAGGED_HUMAN and requires your review in Discovery Studio |
View CogLoop decision log for an investigation
View the reasoning behind CogLoop's recent decisions, which tool it chose and why. Useful to understand why CogLoop is repeatedly waiting instead of making progress.
DiscoveryCogLoopLogs_CL
| where Message has "PickBest"
| where Message has "cog:<your-project>:<your-investigation>"
    or CorrelationId == "<your-correlationId>"
| extend chosen_tool = extract(@'"ChosenTool":\s*"([^"]+)"', 1, Message)
| extend confidence = toint(extract(@'"Confidence":\s*(\d+)', 1, Message))
| extend reasoning = extract(@'"Reasoning":\s*"([^"]+)"', 1, Message)
| project TimeGenerated, chosen_tool, confidence, reasoning
| order by TimeGenerated desc
The reasoning field explains exactly why CogLoop chose to wait or act, it's the most useful field for understanding investigation stalls.
Detect Act and Cognition subloop errors
The two CogLoop subloops can fail independently. This query breaks down errors by subloop to identify which one is failing.
DiscoveryCogLoopLogs_CL
| where LogLevel == "Error"
| where Message has_any ("Act loop error", "Cognition loop error")
| extend ModuleName = case(
    Message has "Act loop", "Act",
    Message has "Cognition loop", "Cognition",
    "Unknown"
  )
| summarize error_count = count() by ModuleName, bin(TimeGenerated, 1h)
| order by TimeGenerated desc
- Act loop errors affect task execution and tool invocation.
- Cognition loop errors affect planning and decision-making.
- Errors in both loops simultaneously may indicate a systemic issue such as a service outage or network partition.
Detect context window saturation
When CogLoop's context window exceeds 80% capacity, it attempts to reset working memory. If that reset also fails because the context is too large, an error is logged.
DiscoveryCogLoopLogs_CL
| where Message has_any ("Context window saturation", "working memory context reset")
    or (LogLevel == "Error" and Message == "Error during working memory context reset")
| extend event_type = case(
    Message has "80%", "Warning: Context window near full",
    Message == "Error during working memory context reset", "Error: Reset failed",
    "Other"
  )
| project TimeGenerated, LogLevel, event_type, Message, Exception
| order by TimeGenerated asc
Note
This error indicates the investigation has accumulated a large context. CogLoop attempted to compress it but the summary was too large for the model's input limit. If this error repeats without recovery, the investigation may be stuck. Contact your Discovery administrator.
Detect circuit breaker events
A circuit breaker opening means that repeated LLM API call failures caused CogLoop to pause sending requests temporarily to prevent cascading failures.
DiscoveryCogLoopLogs_CL
| where LogLevel == "Error"
| where Exception has "BrokenCircuitException"
| project TimeGenerated, LogLevel, Message, Exception
| order by TimeGenerated desc
Note
Circuit breaker events typically self-heal when the circuit resets after a cooldown period. If they persist, contact Microsoft Support.
Troubleshooting
No data in DiscoveryCogLoopLogs_CL
| Cause | Resolution |
|---|---|
| Workspace was recently created and no investigations have run | Run an investigation to generate log entries |
| Time range is too narrow | Expand the time range to the last 24 hours |
| Logs are delayed due to ingestion latency | Wait a few seconds and rerun the query |
Investigation appears stuck with no progress
| Cause | Resolution |
|---|---|
A task is in FLAGGED_HUMAN state |
Open the investigation in Discovery Studio and address the flagged task |
| CogLoop is waiting for a running tool task to complete | Check Supercomputer logs for the associated job. See Query supercomputer logs |
| Context window saturation reset failed | Contact your Discovery administrator |
Serialization Errors Blocking All Instances
Possible Causes:
- A Cognition Engine instance has working memory state that can't be deserialized (for example, after a service upgrade that changes model schemas)
- Corrupted instance data in Cosmos DB
Resolution:
- Run the Detect Serialization Errors query to confirm the error pattern
- Look at the
Exceptionfield for the specific JSON path and property that fails - Escalate to the service team with the instance ID and exception details
Tasks Not Being Validated
Possible Causes:
- TaskValidationAgent isn't deployed in the workspace
- Model deployment required for validation (
gpt-5-2) isn't available
Resolution:
- Run the View TaskValidationAgent Lifecycle query to check if the agent was created
- Look for upsert failures or provisioning errors
- Verify the required model deployment exists in the workspace
Query timeout or slow performance
| Cause | Resolution |
|---|---|
| Query scope is too broad | Narrow the time range or filter by InstanceId |
| Large dataset with no filters | Add filters on LogLevel, InstanceId, or Message before aggregating |