Note
Access to this page requires authorization. You can try signing in or changing directories.
Access to this page requires authorization. You can try changing directories.
The Microsoft Edge browser comes with built-in web development tools, called Microsoft Edge DevTools. DevTools is a set of web development tools that appears next to a rendered webpage in the browser.
Detailed contents:
- Introduction
- Open DevTools
- Keyboard support
- Change where DevTools is docked in the browser
- Zoom DevTools in or out
- Overview of the user interface
- Features of the Activity Bar
- Tabbed tool panels containing tabs and pages
- The Activity Bar and the Quick View toolbar
- Pin and rearrange tools in the Activity Bar
- Inspect tool
- Device Emulation
- Welcome tool
- Elements tool
- Console tool
- Sources tool
- Network tool
- Performance tool
- Memory tool
- Application tool
- More Tools button
- Customize and control DevTools menu
- Help button
- Close DevTools button
- Features of the Quick View toolbar
- Overview of all tools
- Tool, tab, or panel
- About Activity Bar and Quick View tools
- Power tip: Use the Command Menu
- Customizing DevTools
- Trying experimental features
- See also
Introduction
DevTools provides a powerful way to inspect and debug webpages and web apps. You can even edit source files and create website projects, all within the DevTools environment.
With DevTools, you can do the following:
Inspect, tweak, and change the styles of elements in the webpage using live tools with a visual interface. Inspect where the browser stored content to construct the webpage, including
.html,.css,.js, and.pngfile formats.Emulate how your website behaves on different devices and simulate a mobile environment, complete with different network conditions. Inspect the network traffic and see the location of the problems.
Debug your JavaScript using breakpoint debugging and with the live console. Find memory problems and rendering issues with your web apps.
Find accessibility, performance, compatibility, and security issues in your products, and use DevTools to fix the accessibility issues that are found.
Use a development environment to sync changes in DevTools with the file system and from the web.
Video: Understand the DevTools user interface
This slightly older, Sep. 2022 video shows the legacy UI for DevTools:
- Instead of the Activity Bar, the video shows the legacy main toolbar.
- Instead of the Quick View panel (at bottom of DevTools), the video shows the Drawer.
Open DevTools
In Microsoft Edge, you can open DevTools by using the mouse or keyboard, in any of the following ways. Which tool is opened depends on how you open DevTools.
Main ways:
| Action | Resulting tool |
|---|---|
| Right-click any item on a webpage, and then select Inspect. | The Elements tool, with the DOM tree expanded to show the right-clicked page element. |
| Press Ctrl+Shift+I (Windows, Linux) or Command+Option+I (macOS). | The previously used tool, or the Welcome tool. |
| Press F12. | The previously used tool, or the Welcome tool. |
Additional ways:
| Action | Resulting tool |
|---|---|
| On the Microsoft Edge toolbar, select Settings and more ( |
The previously used tool, or the Welcome tool. |
| Press Ctrl+Shift+J (Windows, Linux) or Command+Option+J (macOS). | The Console tool. |
| Press Ctrl+Shift+C (Windows, Linux) or Command+Option+C (macOS). | The Elements tool, with the DOM tree expanded to show the <body> element. |
| Press Shift+F10 to open the right-click menu. To select the Inspect command, press Up Arrow and then Enter. | The Elements tool, with the DOM tree expanded to show the <html> element. |
| Press Tab or Shift+Tab to put focus on a page element. Then press Shift+F10 to open the right-click menu. To select the Inspect command, press Up Arrow and then Enter. | The Elements tool, with the DOM tree expanded to show the focused page element. |
Open DevTools by right-clicking an item in a webpage
A good way to open DevTools is to right-click an item on a webpage, and then select Inspect:
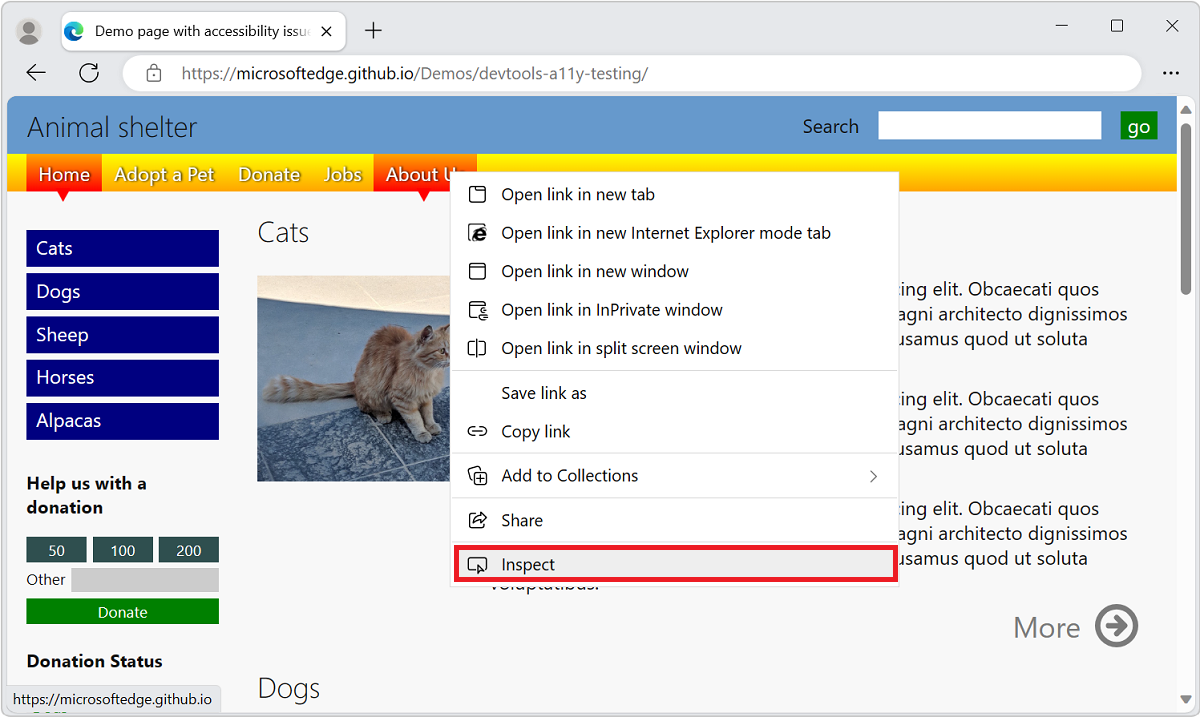
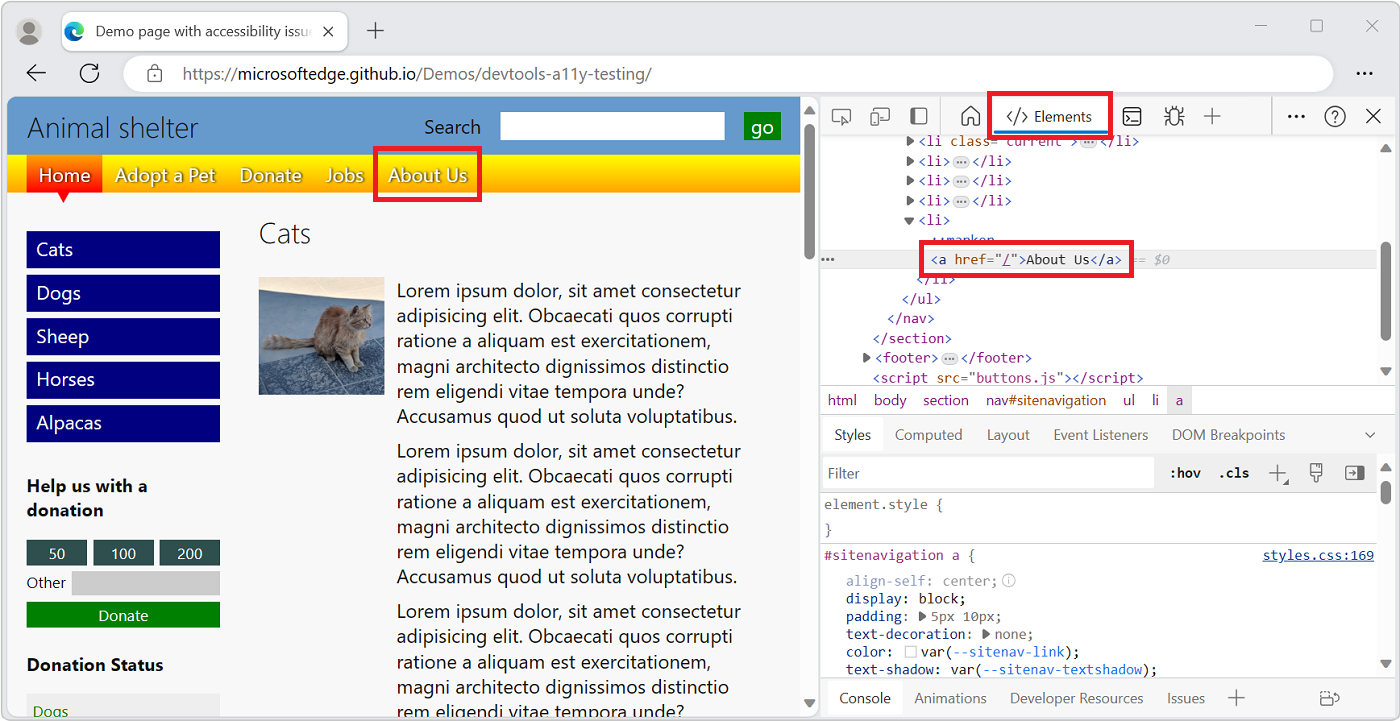
DevTools opens, with the right-clicked element highlighted in the DOM tree in the Elements tool:
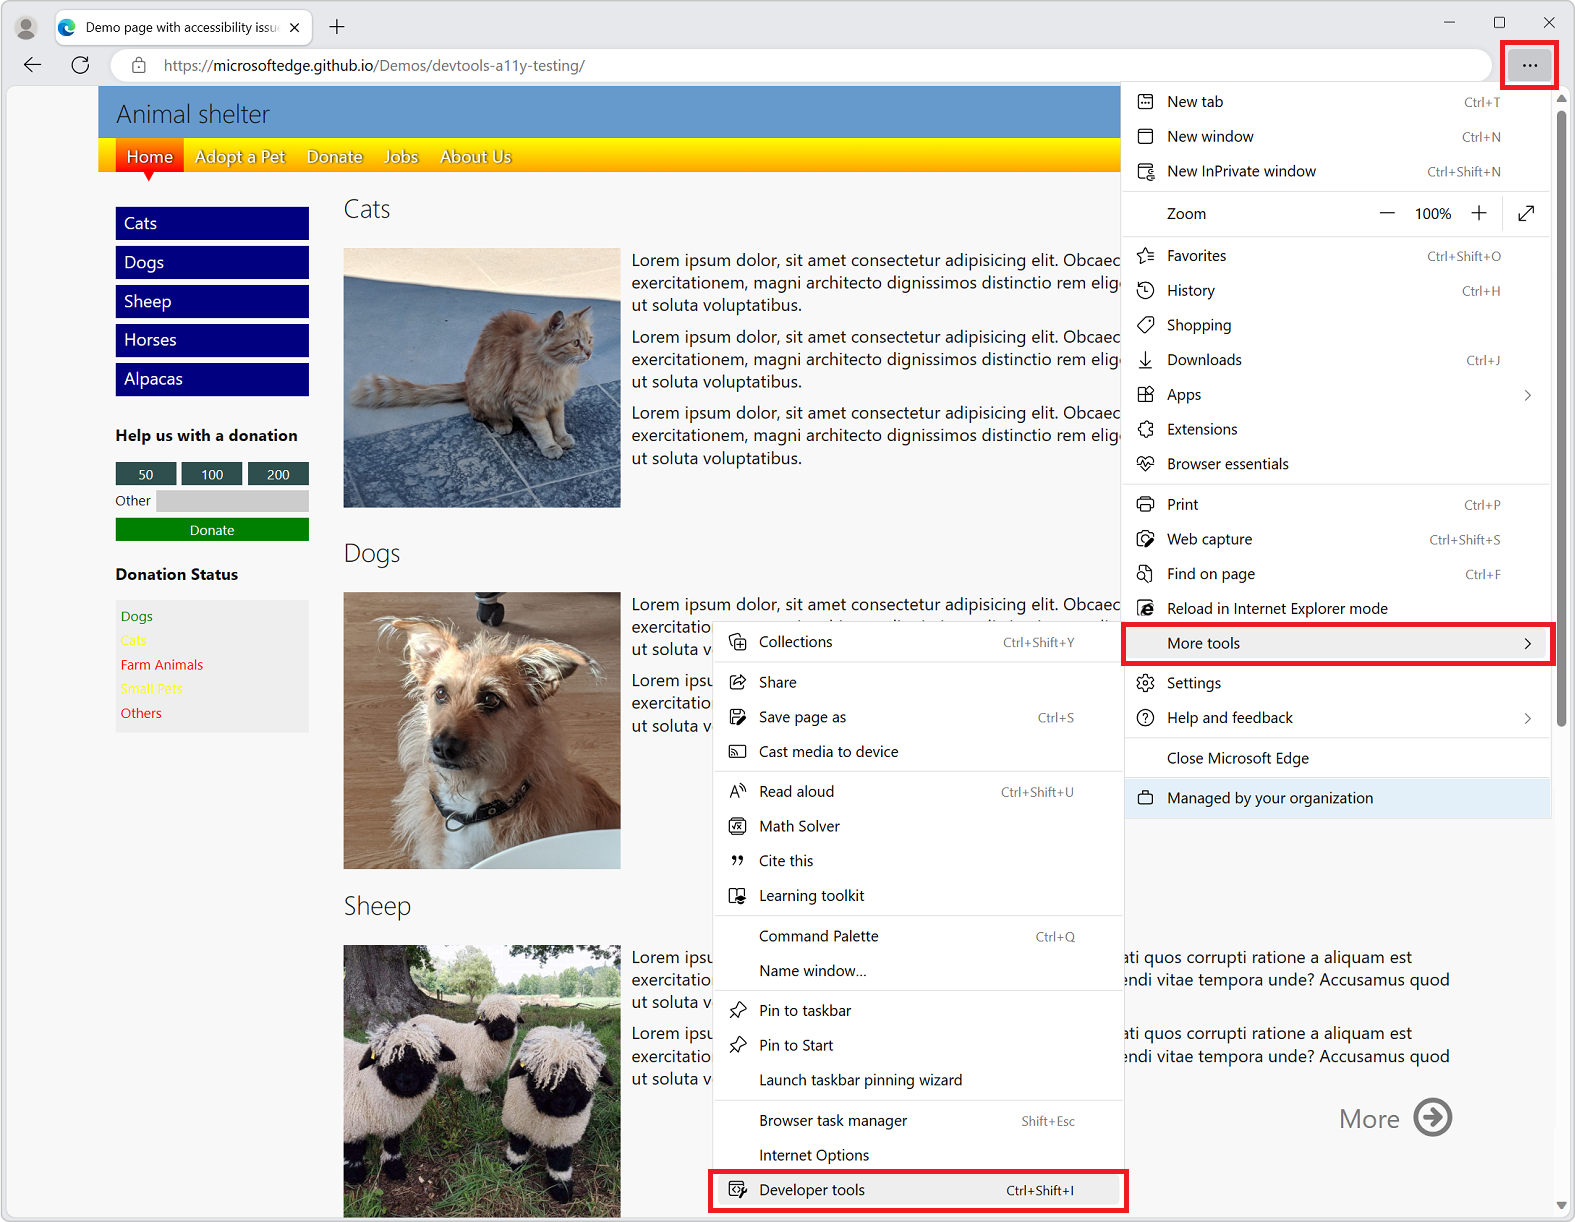
Open DevTools by using the Microsoft Edge toolbar
On the Microsoft Edge toolbar, select Settings and more (...) > More tools > Developer tools:
Have DevTools automatically open when you open a new tab
To have DevTools automatically open whenever you open a new tab in the browser:
At the command line, open Microsoft Edge, passing in the
--auto-open-devtools-for-tabsflag, as follows:Windows command prompt:
start msedge --auto-open-devtools-for-tabsWindows PowerShell:
Start-Process -FilePath "msedge" -ArgumentList "--auto-open-devtools-for-tabs"macOS Terminal:
/Applications/Microsoft\ Edge.app/Contents/MacOS/Microsoft\ Edge --auto-open-devtools-for-tabsbash shell on Linux:
microsoft-edge --auto-open-devtools-for-tabs
Disabling startup boost
Important: There must be no running Microsoft Edge processes when launching via auto-open-devtools-for-tabs, so you may need to disable Startup boost in edge://settings/system.
The startup boost feature keeps a minimal Microsoft Edge process running in the background. This interferes with the auto-open-devtools-for-tabs feature and would need to be disabled to use it. For more information, see Get help with startup boost.
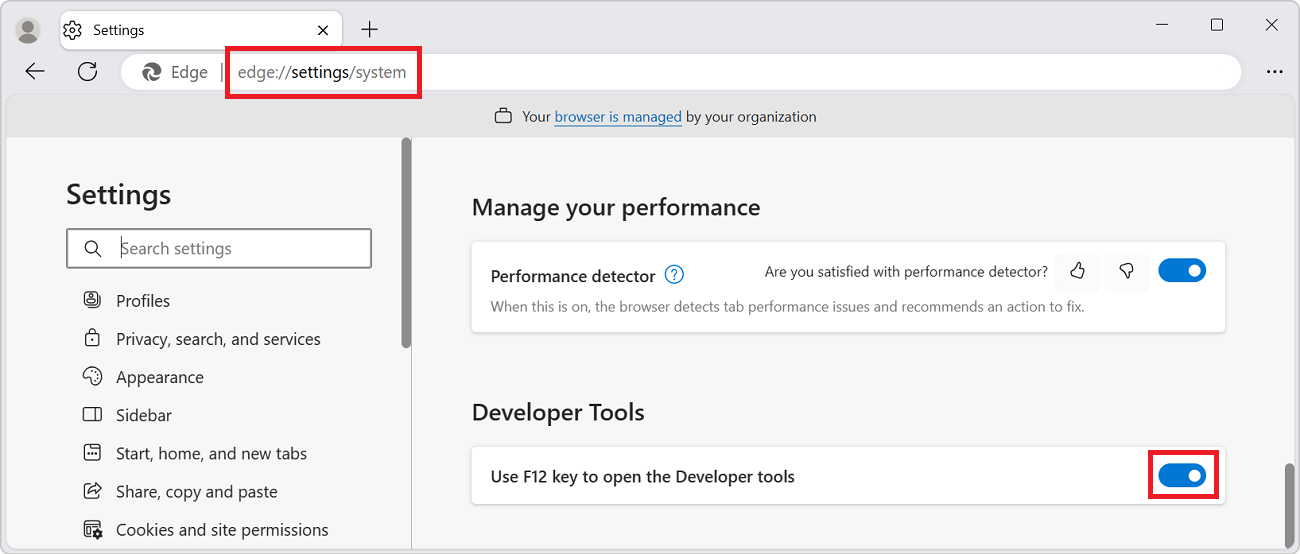
Turning off the F12 keyboard shortcut
To prevent pressing F12 from opening DevTools:
In Microsoft Edge, go to
edge://settings/system.Scroll down to the Developer Tools section, and then turn off the Use F12 key to open the Developer tools toggle.
Keyboard support
You can interact with DevTools using the mouse or keyboard. Keyboard shortcuts provide a quick way to access functionality, and are needed for accessibility. Various tools are increasingly accessible through the keyboard and assistive technologies such as screen readers.
See Keyboard shortcuts and Navigate DevTools with assistive technology.
Change where DevTools is docked in the browser
You can dock DevTools in the right, left, or bottom of the browser, or undock it into a separate window. See Change DevTools placement (Undock, Dock to bottom, Dock to left).
Zoom DevTools in or out
The DevTools UI is implemented using HTML and CSS, like webpages, so you can zoom in and out by using the standard keyboard shortcuts. The zoom levels for DevTools and the rendered page are independent.
To zoom the DevTools portion of the browser:
- If focus isn't already on DevTools, click somewhere in DevTools.
- Press Ctrl++ or Ctrl+- (Windows or Linux). Or, press Command++ or Command+- (macOS).
To zoom the rendered page, click the page, and then use the same keyboard shortcuts as above.
To restore zoom to 100%:
- Make sure focus is on the desired part of the browser, either DevTools or the rendered page.
- Press Ctrl+0 or Ctrl+NumPad0 (Windows or Linux), or Command+0 (macOS).
To zoom DevTools Settings:
- In DevTools Settings, click Close (x) in the upper right.
- Change the zoom level of DevTools, as described above.
- Click the Settings (
 ) button.
To zoom DevTools by using the Command Menu:
- Click the Customize and control DevTools (
 ) menu button, and then select Run command.
 - In the Command Menu, start typing zoom, and then select a zoom command:
- Reset zoom level
- Zoom in
- Zoom out
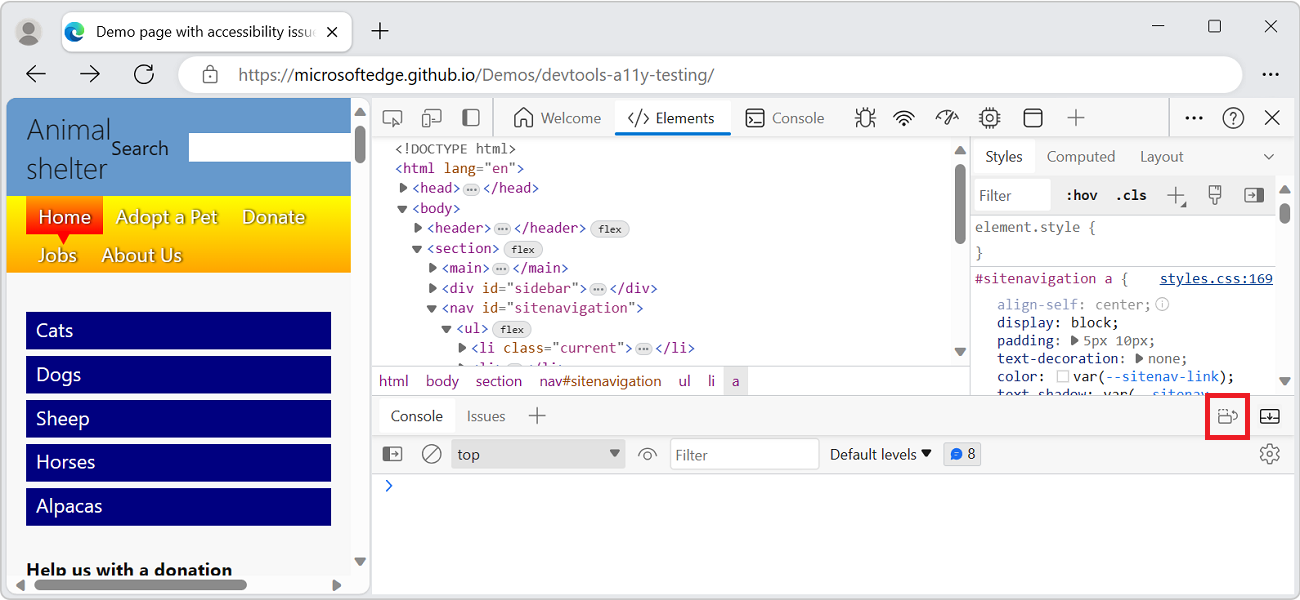
Overview of the user interface
The DevTools user interface has the following main areas:
The Activity Bar at the top which contains icons used to access tools, settings, documentation, and more.
- The current tool area, where the tool that's currently selected in the Activity Bar appears.
The Quick View toolbar, at the bottom, which contains tabs used to access tools.
- The bottom tool area, where the tool that's currently selected in the Quick View toolbar appears.

By default, the Activity Bar contains the following tools:
Inspect tool (
 ) toggle button.
Device Emulation tool (
 ) button.
Welcome tool (
 ).
).Elements tool (
 ).
).Console tool (
 ).
).Sources tool (
 ).
).Network tool (
 ).
).Performance tool (
 ).
).Memory tool (
 ).
).Application tool (
 ).
).
By default, the Quick View toolbar contains the following tools:
Console tool (
).Issues tool (
 ).
).
In the Activity Bar, tool tabs either contain the tool name and icon, or just the tool icon, depending on the width of the DevTools window. If the window is wide enough, the tool name and icon appear. If the window is too narrow, only the tool icon appears and the tool name appears when you hover over the tool icon.
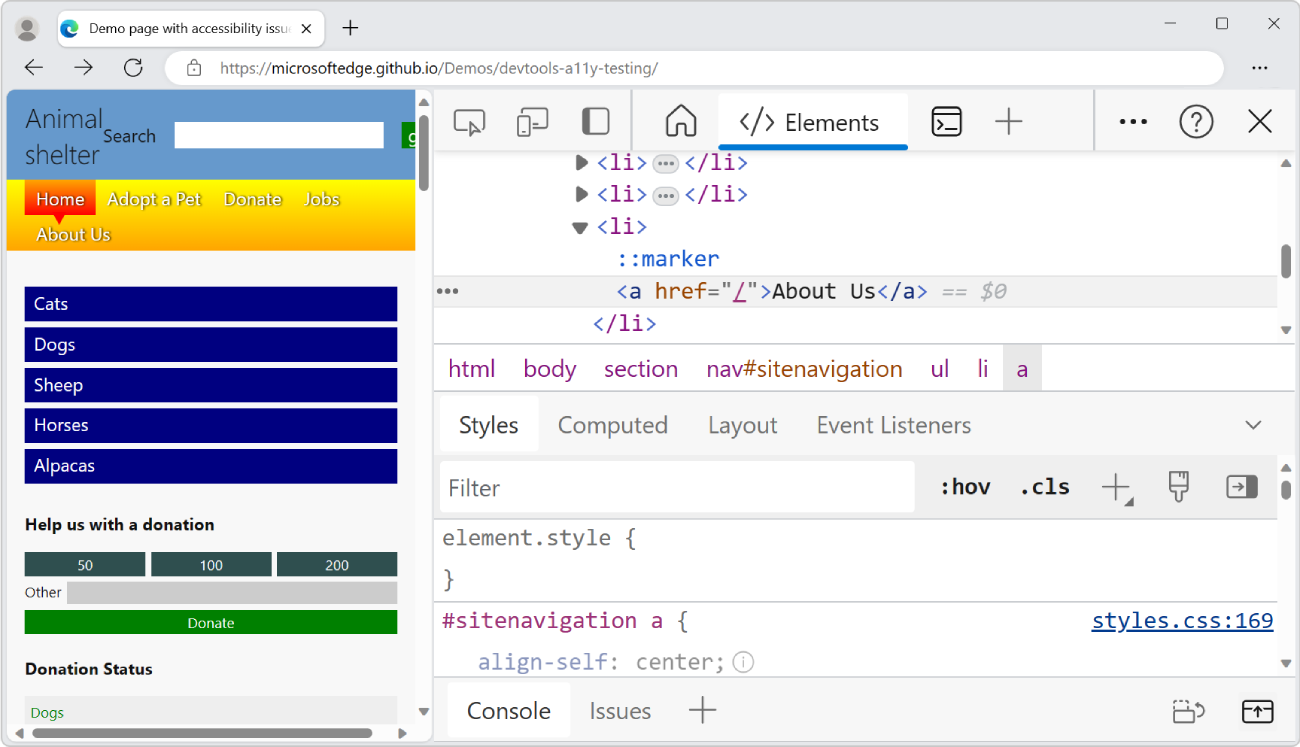
Change the location of Quick View
By default, the Quick View panel is at the bottom of DevTools. You can also put the Quick View panel on the right side of DevTools.
To display the Quick View panel, press Esc.
To change the location of the Quick View panel, in the Quick View toolbar, click the Dock Quick View to the right (![]() ) button or the Dock Quick View to the bottom button:
) button or the Dock Quick View to the bottom button:
Features of the Activity Bar
DevTools gives you an amazing amount of power to inspect, debug, and change the website currently displayed in the browser. Most of the tools display the changes live. Live updates make the tools useful to refine the appearance and navigation or functionality of a webpage without the need to refresh or build it.
Tabbed tool panels containing tabs and pages
Other than the Inspect tool and Device Emulation, DevTools is divided into a set of tabbed tools, such as the Elements tool, the Console tool, and the Sources tool. Within the Command Menu, tools are referred to as panels. A tool's tab contains a panel which contains the tool's UI.
Higher-level tabs:
Tools are organized into a set of tabs on the Activity Bar and on the Quick View toolbar. Most tools are also called panels. A panel is the inner UI of a tool. A tool has a tab that can be present on the Activity Bar and Quick View toolbar.
Lower-level tabs:
Within the panel of some tools, there are one or more sets of tabs (tabbed panes). For example, the Elements tool contains a set of tabs that includes Styles, Event Listeners, and Accessibility tabs. For other tools, the tool's panel has pages listed along the left side.
The Activity Bar and the Quick View toolbar
There are two toolbars: the Activity Bar at the top of DevTools, and the Quick View toolbar at the bottom when you press Esc.
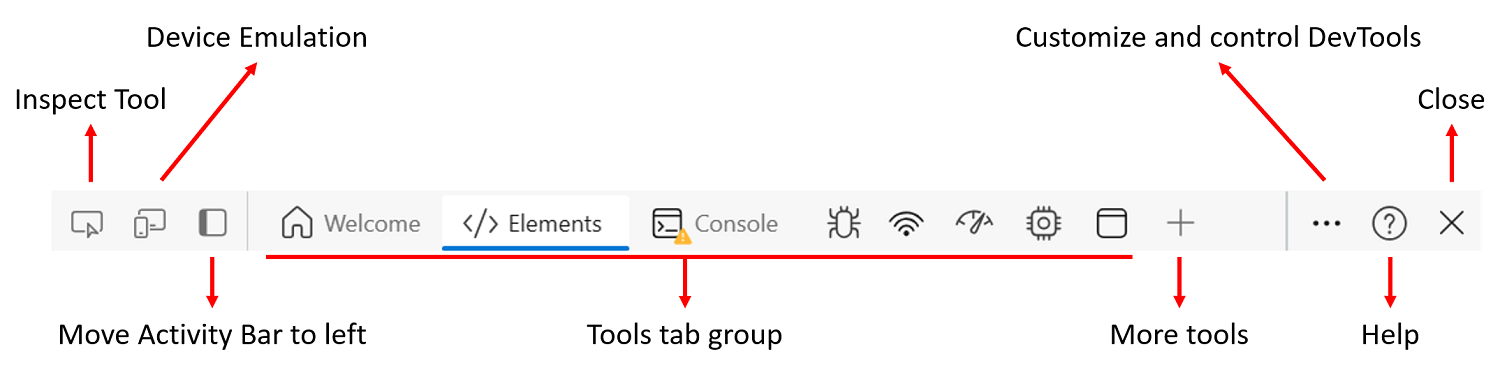
The Activity Bar contains the following features:
- Icon tools:
- Inspect tool () toggle button.
- Device Emulation () button.
- Inspect tool (
Tool tabs:
- Welcome tool.
- Elements tool. Permanent.
- Console tool. Permanent.
- Sources tool. Permanent.
- Network tool.
- Performance tool.
- Memory tool.
- Application tool.
Icons:
- More tools (
 ) button.
 - Customize and control DevTools () menu button.
- Help (
 ) button.
 - Close DevTools (
 ) button.
- More tools (
The Activity Bar features are described below.
Pin and rearrange tools in the Activity Bar
Besides the permanent Elements, Console, and Sources tools, you can control which tools appear in the Activity Bar, to customize DevTools to focus on your current activities.
Click the More tools (
) button to list all the available tools: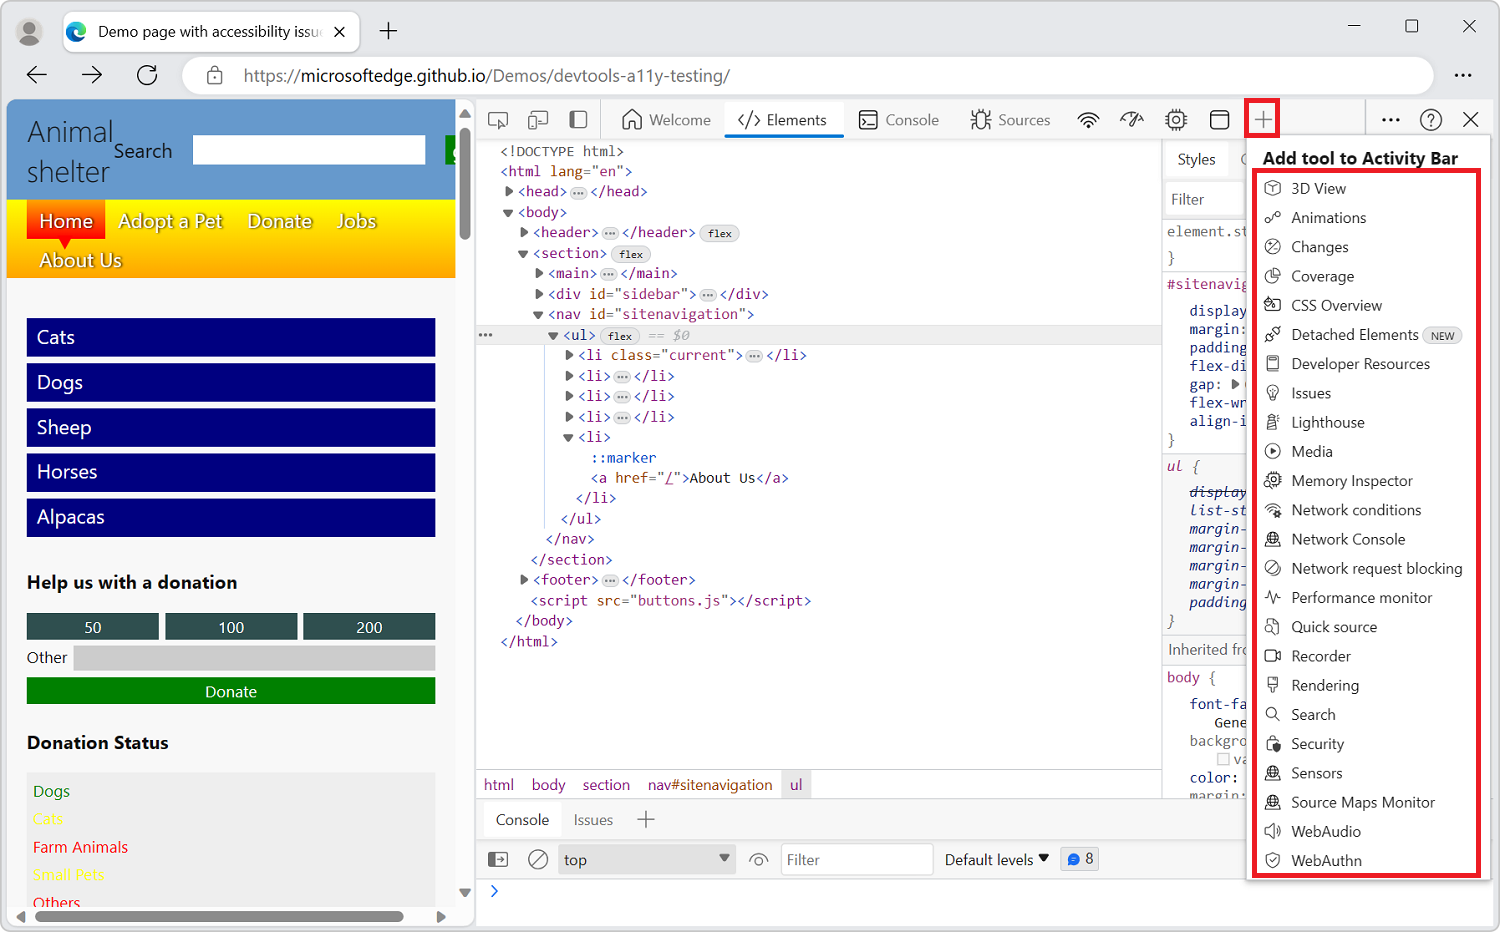
Select a tool to pin it to the Activity Bar. The tool is then present in the Activity Bar whenever DevTools is opened.
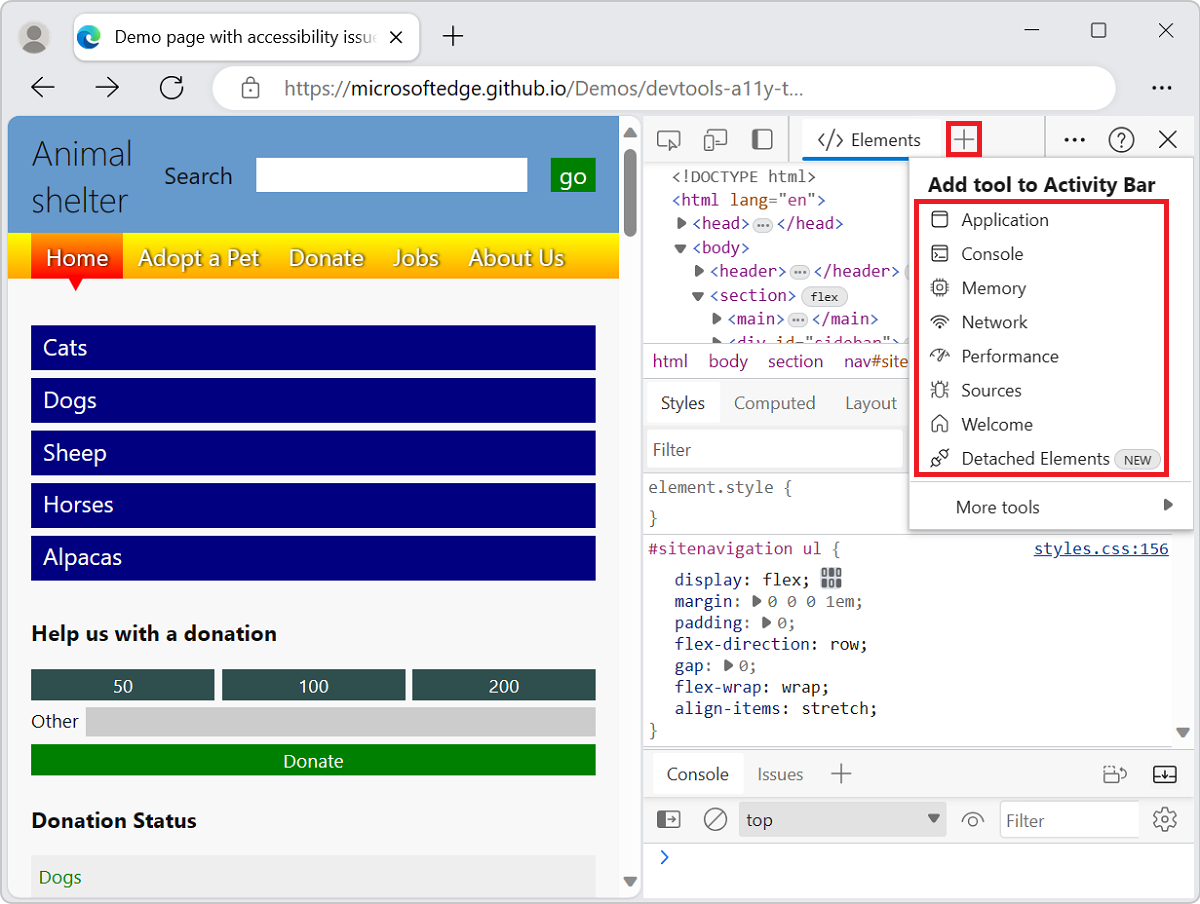
If there isn't enough space in the Activity Bar to display all of the pinned tools, tools that are open but not displayed are moved into the More tools menu:
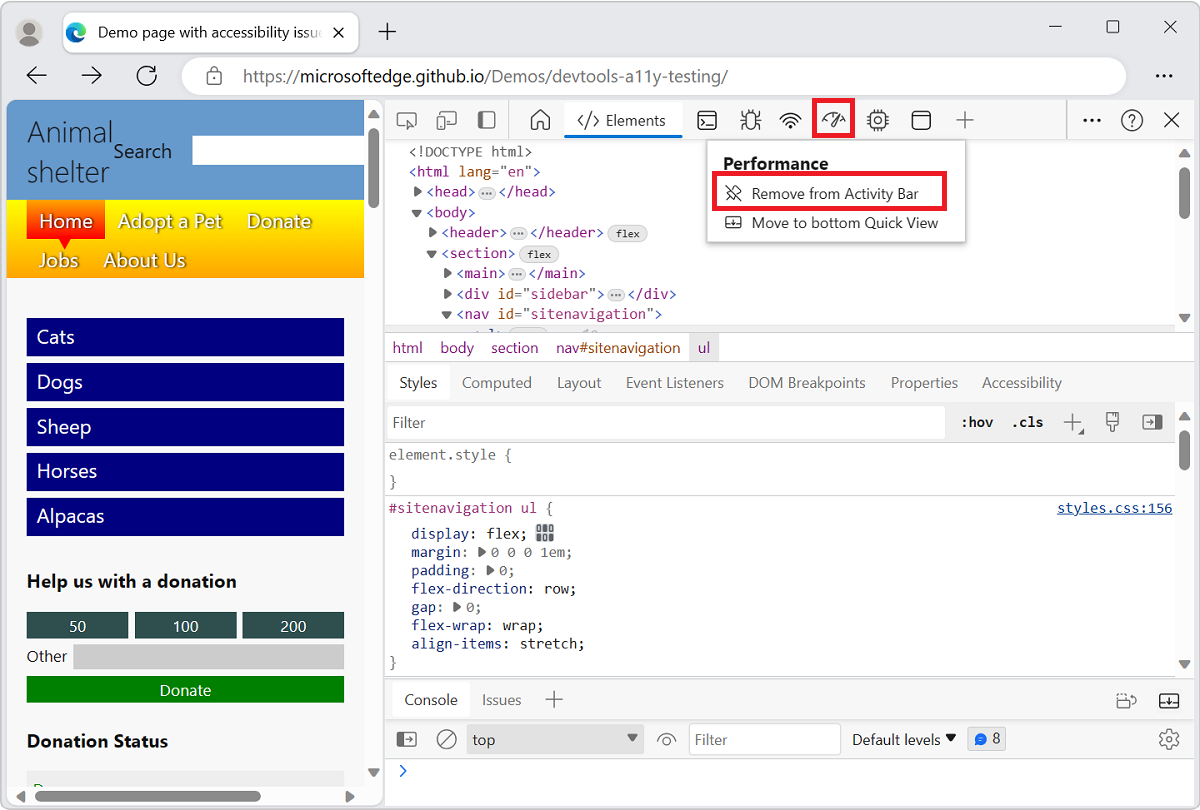
To unpin a tool from the Activity Bar, right-click the tool's tab and then select Remove from Activity Bar:
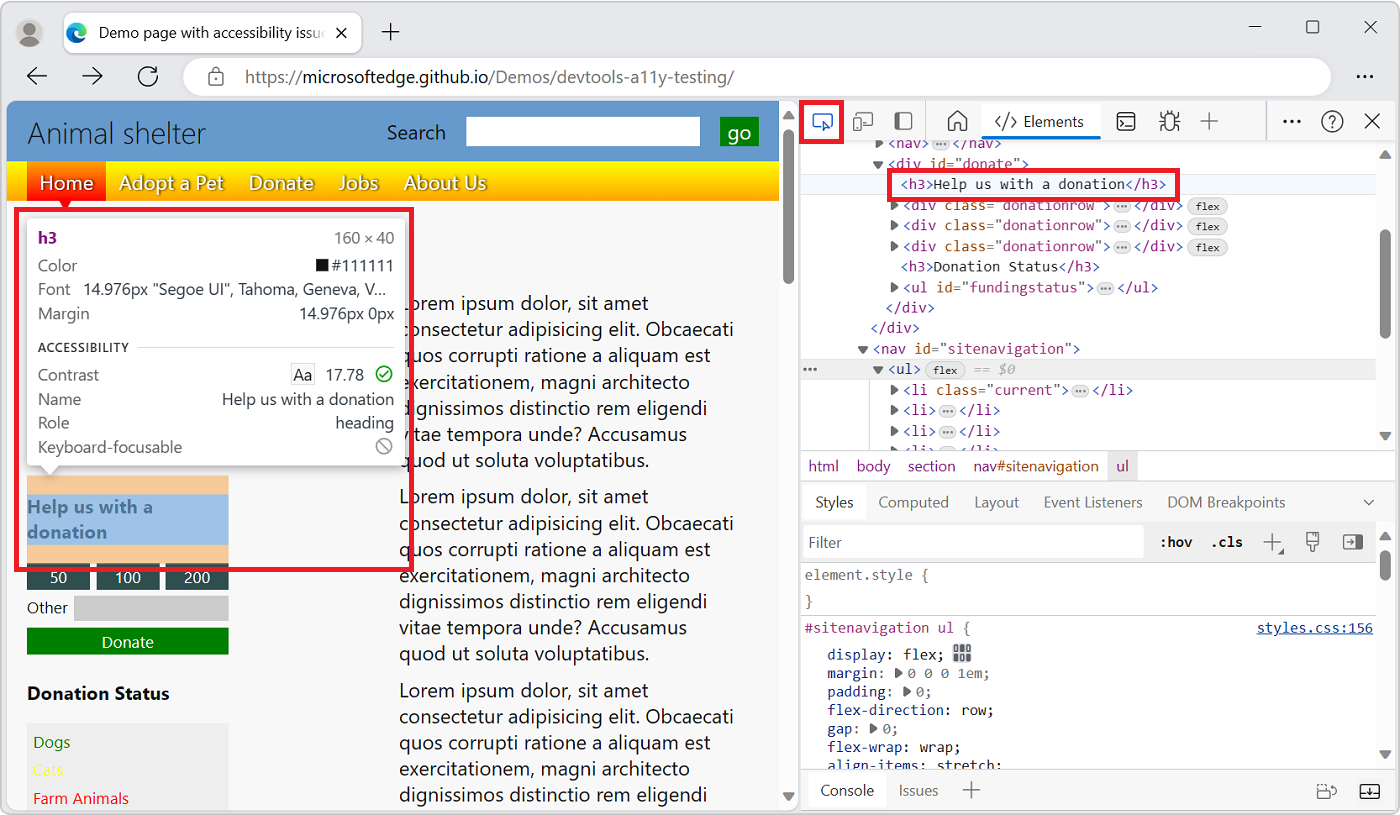
Inspect tool
When you click the Inspect tool (![]() ) button, you can select an element on the current webpage. While the Inspect tool is active, you can move your mouse over different parts of the webpage to get detailed information about page elements, along with a multi-color overlay that shows the layout dimensions, padding, and margin of the page element.
) button, you can select an element on the current webpage. While the Inspect tool is active, you can move your mouse over different parts of the webpage to get detailed information about page elements, along with a multi-color overlay that shows the layout dimensions, padding, and margin of the page element.
Device Emulation
Click the Device Emulation (![]() ) button to display the current website in an emulated device mode. The Device Emulation tool allows you to run and test how your product reacts when you resize the browser. It also gives you an estimation of the layout and behavior on a mobile device.
) button to display the current website in an emulated device mode. The Device Emulation tool allows you to run and test how your product reacts when you resize the browser. It also gives you an estimation of the layout and behavior on a mobile device.

See Emulate mobile devices (Device Emulation).
Welcome tool
Includes information about the new features of DevTools, how to contact the team, and provides information about certain features.
Elements tool
Allows you to inspect, edit, and debug your HTML and CSS. You can edit in the tool while displaying the changes live in the browser.
The Elements tool is always present on the Activity Bar.
Console tool
In the Console tool, you can:
- View and filter logged messages from network requests or from JavaScript log statements.
- Enter JavaScript statements to evaluate in realtime. Expressions are evaluated in the current context, such as when the JavaScript debugger in the Sources tool is paused at a breakpoint.
The Console tool is always present on the Activity Bar and on the Quick View toolbar.
See Console.
Sources tool
The Sources tool is a code editor and JavaScript debugger. You can edit projects, maintain snippets, and debug your current project.
The Sources tool is always present on the Activity Bar.
Network tool
The Network tool allows you to monitor and inspect requests or responses from the network and browser cache. You can filter requests and responses to fit your needs and simulate different network conditions.
Performance tool
See Analyze runtime performance (tutorial).
Memory tool
See Fix memory problems.
Application tool
See View, edit, and delete cookies.
More Tools button
To add a tool to the Activity Bar, click the More tools (![]() ) button.
) button.
Customize and control DevTools menu
The Customize and control DevTools (![]() ) button opens a dropdown menu to:
) button opens a dropdown menu to:
- Dock DevTools.
- Dock the Activity Bar.
- Select a theme.
- Show keyboard shortcuts.
- Change DevTools settings.
- Open Device Emulation.
- Toggle the Quick View panel.
- Run a command.
- Search for code.
- Open a file.
Help button
The Help (![]() ) button opens a dropdown menu that has the following items:
) button opens a dropdown menu that has the following items:
Documentation - Opens Microsoft Edge DevTools documentation.
Release notes - Opens What's new in Microsoft Edge DevTools.
Feedback (
 ) - Opens the Send feedback dialog. To connect with the Microsoft Edge DevTools team to report a problem or issue (or to suggest an idea), describe what happened, and include a screenshot. See Contact the Microsoft Edge DevTools team.
Close DevTools button
Click the Close DevTools (![]() ) button in the upper right corner of DevTools to close DevTools and use the entire window to display the current webpage.
) button in the upper right corner of DevTools to close DevTools and use the entire window to display the current webpage.
Features of the Quick View toolbar
Use the Quick View panel to open a second tool below or to the right of the tool that's already selected in the Activity Bar:
Select a tool from the Activity Bar.
In the Quick View toolbar, click More tools (
), and then select a different tool from the list.
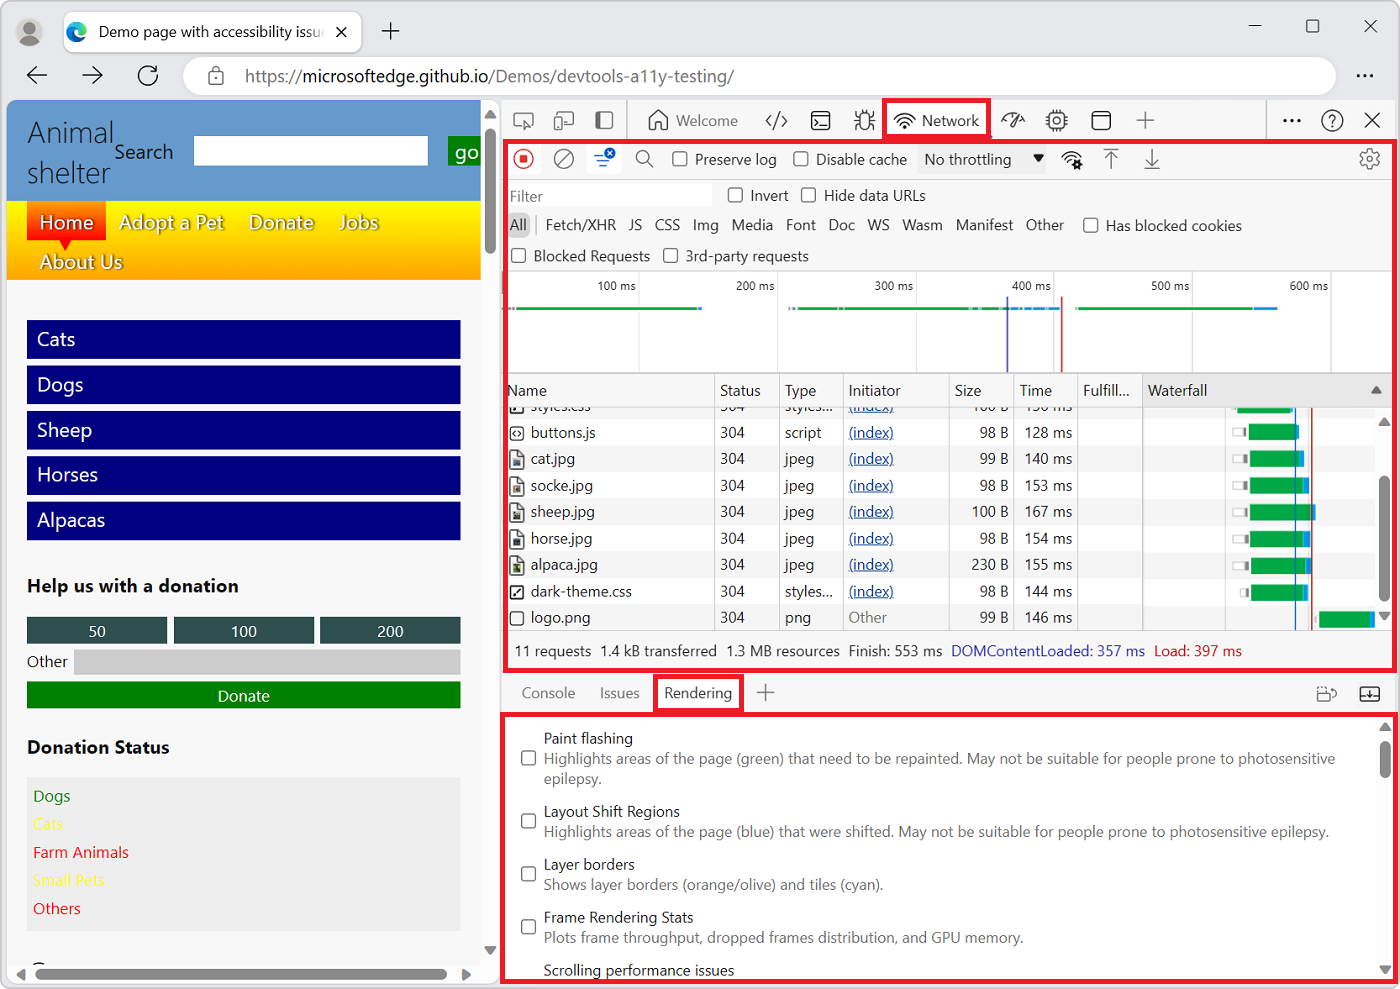
For example, open the Rendering tool in the Quick View panel, below the Network tool that's open in the Activity Bar:
To hide or expand Quick View, click Collapse Quick View (![]() ) or Expand Quick View (
) or Expand Quick View (![]() ), or press the Escape key.
), or press the Escape key.
Overview of all tools
For a summary of each tool, see About the list of tools.
Tool, tab, or panel
The words "tool", "tab", and "panel" are somewhat interchangeable. In the Command Menu, the tools are called panels; for example, the Elements tool is called the Elements panel. To switch to the Elements tool, you click the Elements tab. There's a More tools (![]() ) button and list used to select tools. DevTools tools are also called DevTools panels.
) button and list used to select tools. DevTools tools are also called DevTools panels.
You can customize each of the tools, and the content of a tool can change based on the context.
About Activity Bar and Quick View tools
The More tools (![]() ) button is displayed both in the Activity Bar and in the Quick View toolbar. When you open a tool from the More tools list that's located in the Activity Bar, the tool appears in the Activity Bar. When you open a tool from the More tools list in the Quick View toolbar, the tool is opened in the Quick View panel.
) button is displayed both in the Activity Bar and in the Quick View toolbar. When you open a tool from the More tools list that's located in the Activity Bar, the tool appears in the Activity Bar. When you open a tool from the More tools list in the Quick View toolbar, the tool is opened in the Quick View panel.
| Task | Steps |
|---|---|
| Open a tool in the Activity Bar at the top of DevTools | In the Activity Bar at the top of DevTools, click More tools ( |
| Open a tool on the Quick View toolbar | When DevTools has focus, press Esc to show the Quick View toolbar if it's not shown yet. In the Quick View toolbar, click the More tools ( |
| Move a tool from the Quick View toolbar to the Activity Bar | When DevTools has focus, press Esc to show the Quick View. In the Quick View toolbar, right-click the tool's tab, and then select Move to top Activity Bar. |
| Move a tool from the Activity Bar to the Quick View toolbar | In the Activity Bar, right-click the tool's tab, and then select Move to bottom Quick View or Move to side Quick View. |
| Open a tool in its default toolbar (Activity Bar or Quick View) | When DevTools has focus, open the Command Menu by pressing Ctrl+Shift+P (Windows, Linux) or Command+Shift+P (macOS). Type the name of the tool, and then select a Show <tool> command. |
In addition to Activity Bar and Quick View tools, DevTools includes the following tools:
- The Inspect tool. See Use the Inspect tool to detect accessibility issues by hovering over the webpage.
- The Device Emulation tool. See Emulate mobile devices (Device Emulation).
- The Command Menu. See Run commands with the Microsoft Edge DevTools Command Menu.
See also
Power tip: Use the Command Menu
DevTools provides lots of features and functionality to use with your website. You can access the different parts of DevTools in many ways, but often a fast way is to use the Command Menu.
In the Command Menu, the tools are called "panels"; for example, the Elements tool is called the Elements panel. To switch to the Elements tool, you select the Elements tab.
To open the Command Menu, do either of the following:
- Click the Customize and control DevTools (
 ) button, and then select Run command.
 - Press Ctrl+Shift+P (Windows, Linux) or Command+Shift+P (macOS).
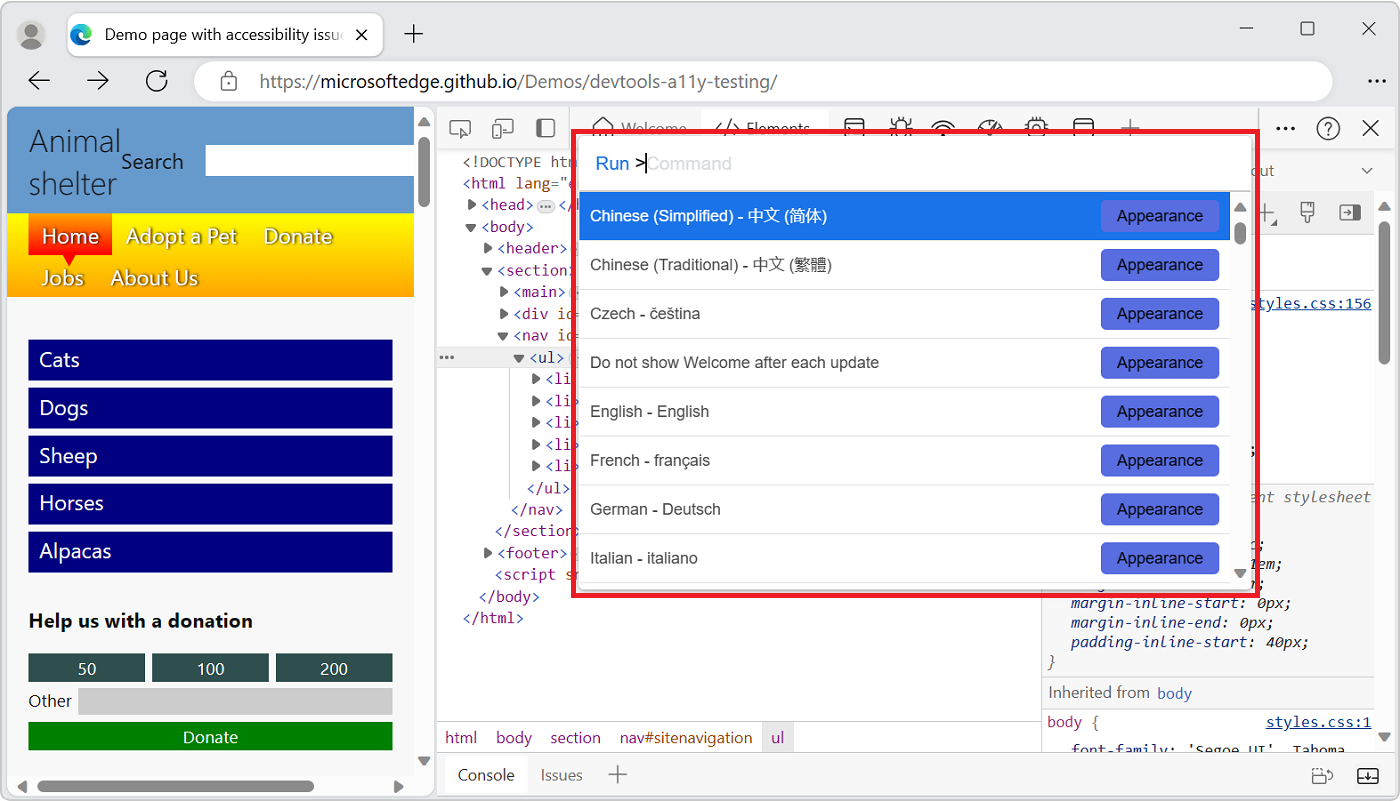
The Command Menu allows you to type commands to display, hide, or run features in DevTools.
- Click the Customize and control DevTools (
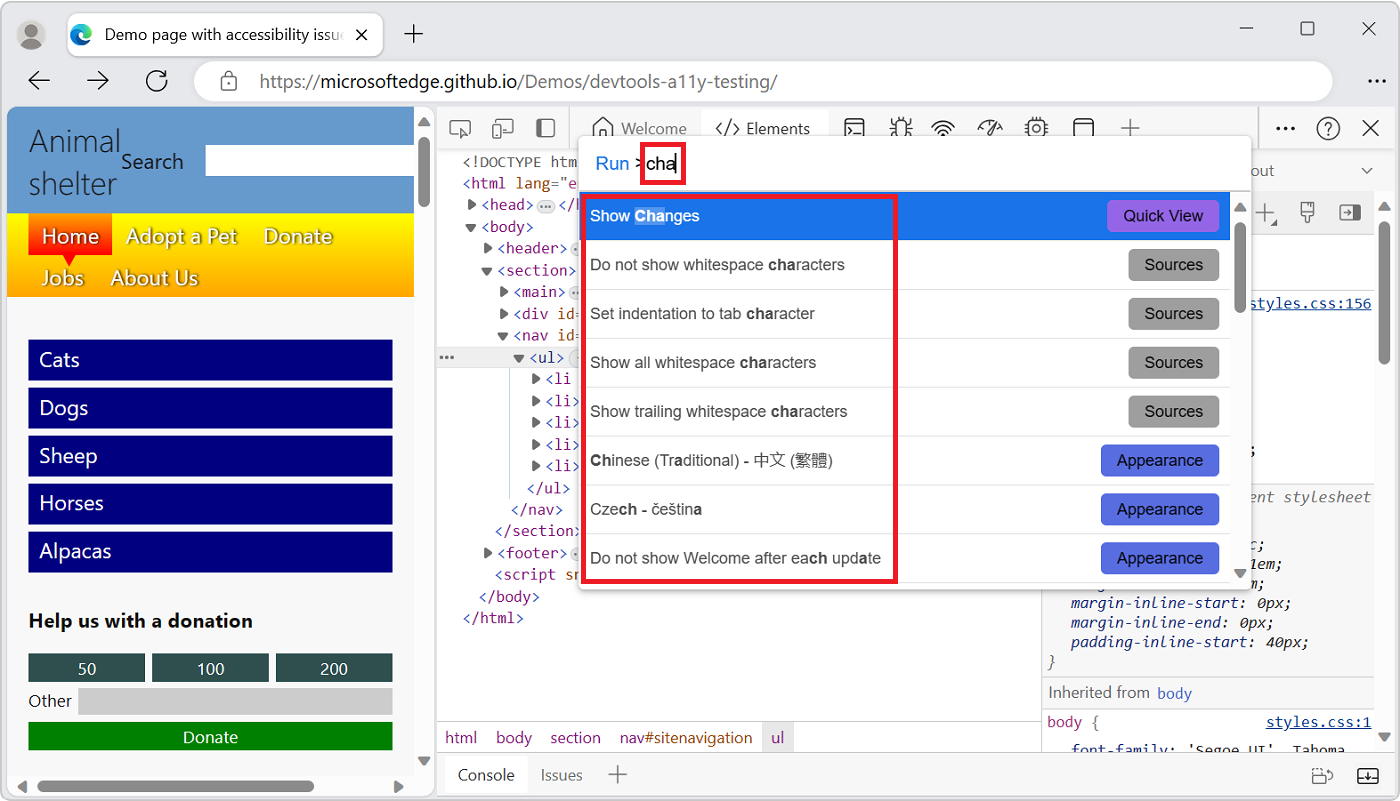
In the Command Menu, start typing the name of a tool, such as changes, and then select a Show command, such as Show Changes. The Command Menu displays the matching commands:
Press Enter to select a Show command, such as Show Changes. The selected tool opens in the Quick View panel, at the bottom:
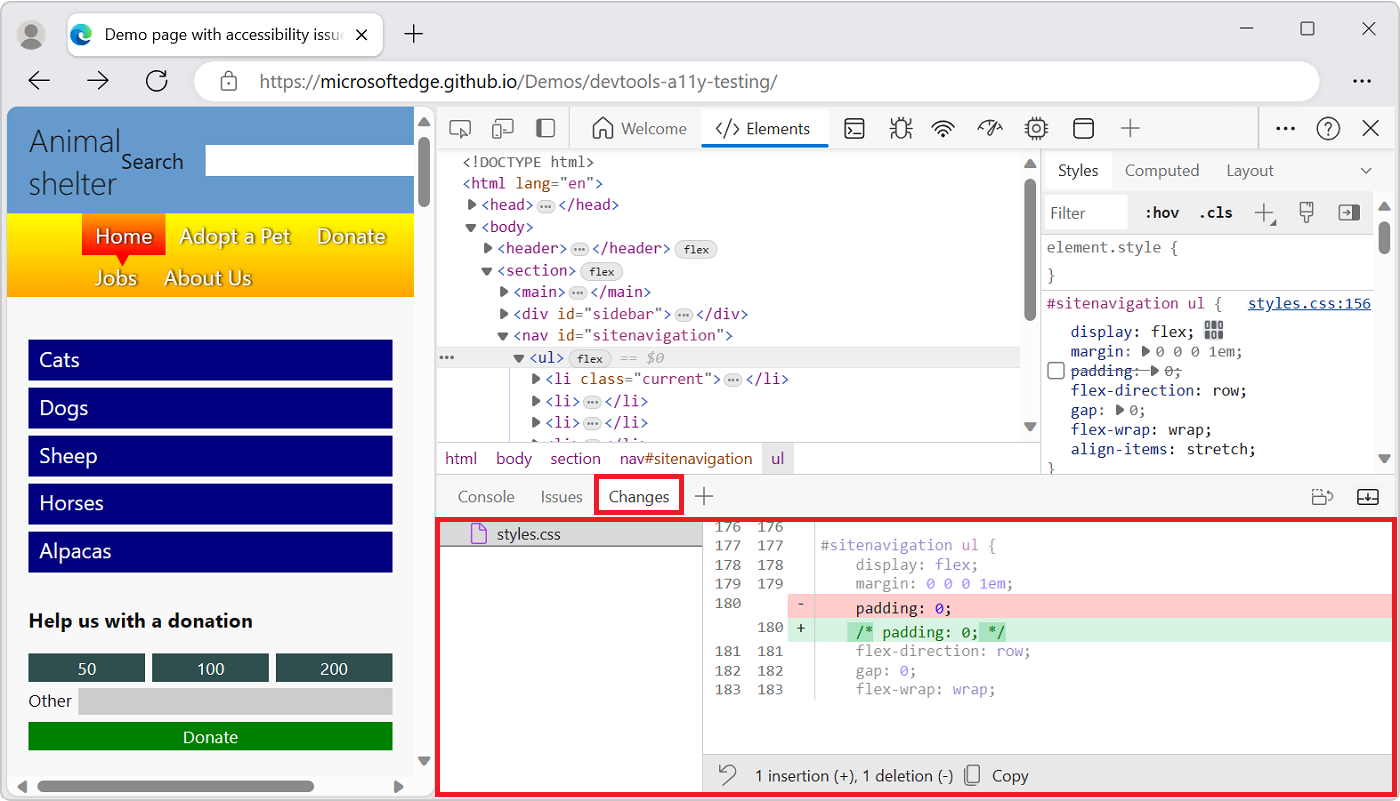
The Changes tool is useful when you edit CSS. In this example, the Command Menu provides a fast alternative to selecting More tools (
) and then selecting Changes. This example also provides an alternative to editing a .jsfile in the Sources tool, and then right-clicking and selecting Local modifications.
See also Run commands with the Microsoft Edge DevTools Command menu.
Customizing DevTools
You can customize DevTools to meet your needs for the way you work. To change settings, click the Customize and control DevTools (![]() ) button, and then select Settings (
) button, and then select Settings (![]() ), or press F1.
), or press F1.
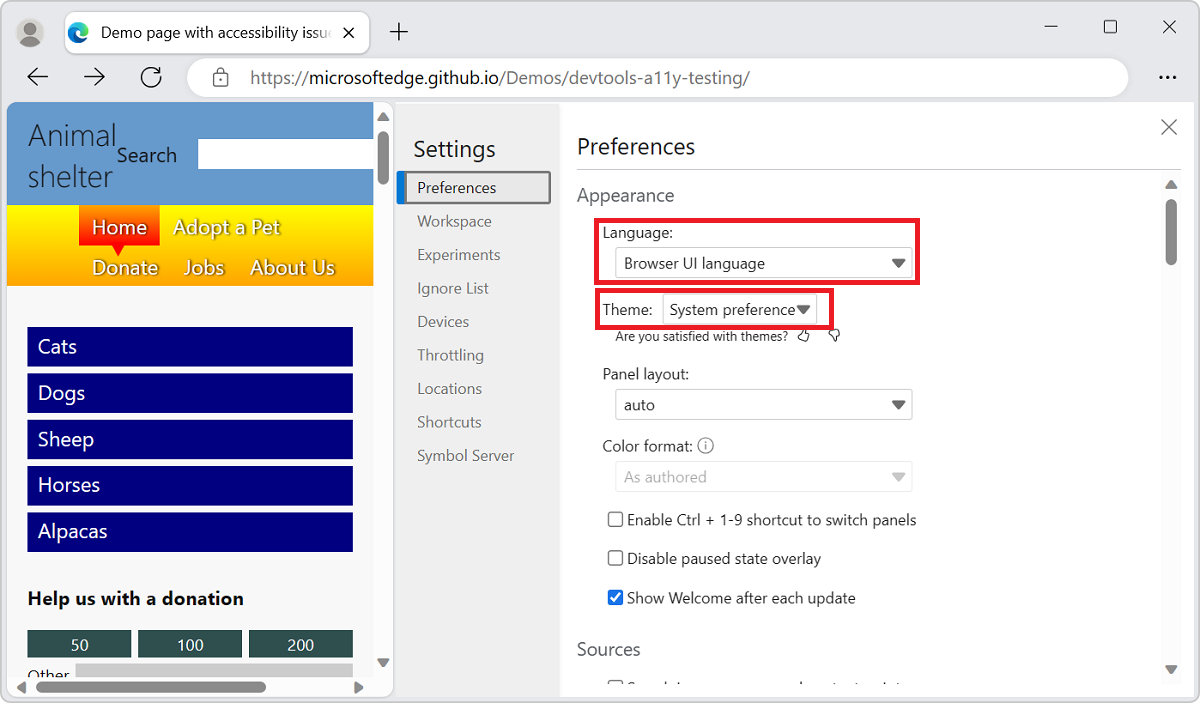
In the Settings > Preferences page, you can change several parts of DevTools. For example, you can use the Browser UI language setting to use the same language in DevTools that is used in your browser. For another example, use the Theme setting to change the color theme of DevTools.
You can also change the settings of advanced features, such as:
- Add local files to a Workspace.
- Filter library code by using the Ignore List.
- Define the Devices you want to include in the device simulation and test mode. For more information, see Emulate mobile devices (Device Emulation).
- Select a network Throttling profile.
- Define simulated Locations.
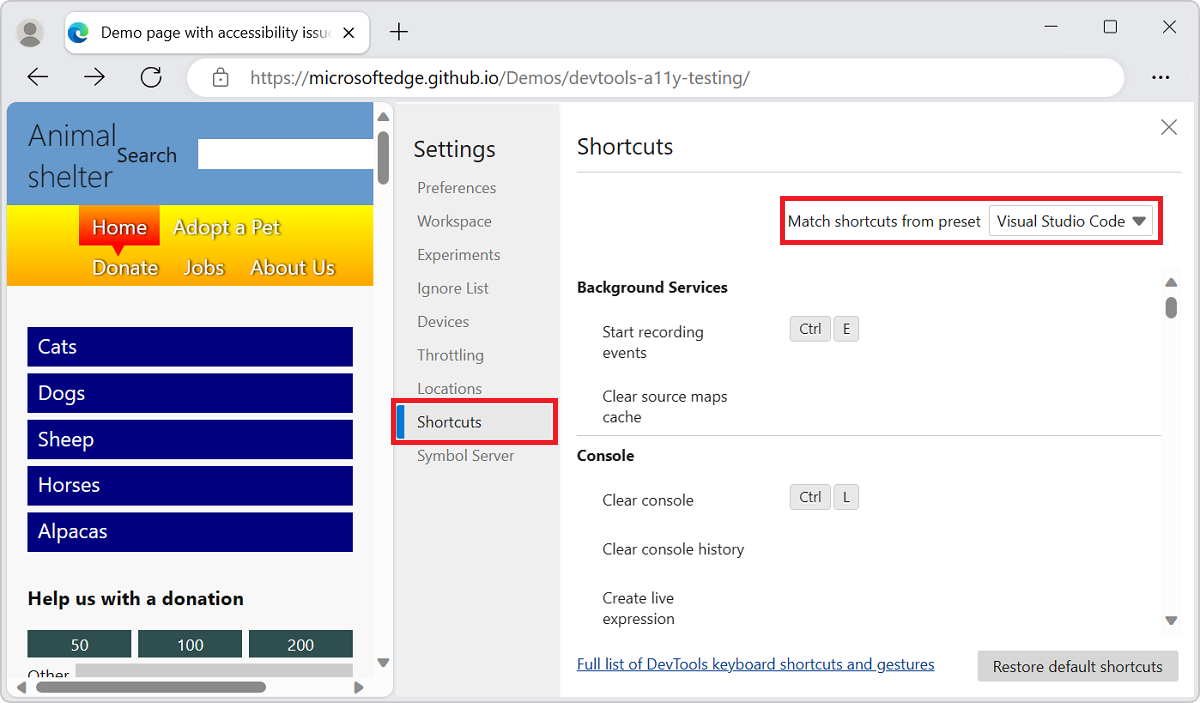
- Customize keyboard Shortcuts. For example, to use the same shortcuts in DevTools as in Visual Studio Code, select Match shortcuts from preset > Visual Studio Code.
Trying experimental features
The DevTools team provides new features as experiments in DevTools. You can turn each of the experiments on or off. To see the full list of Experimental features in Microsoft Edge DevTools, in DevTools, select Settings (![]() ), and then select Experiments.
), and then select Experiments.
To preview the latest features coming to DevTools, download Microsoft Edge Canary, which builds nightly.
See also:
See also
- About the list of tools
- Inspect and change the current webpage
- Emulate how your product behaves on different devices
- Inspect, tweak, and change the styles of elements
- Debug your JavaScript
- Live console
- Accessibility, performance, compatibility, and security issues
- Inspect the network traffic
- Inspect where the browser stored content
- Evaluate the performance
- Memory problems
- Rendering issues
- Use a development environment
- Sync changes in DevTools with the file system
- Override files from the web
- Your first website (MDN) - How to use HTML, CSS, and JavaScript to build a webpage.