Note
Access to this page requires authorization. You can try signing in or changing directories.
Access to this page requires authorization. You can try changing directories.
DevTools provides more than 30 tools, consisting of Default tools and More tools.
Default tools
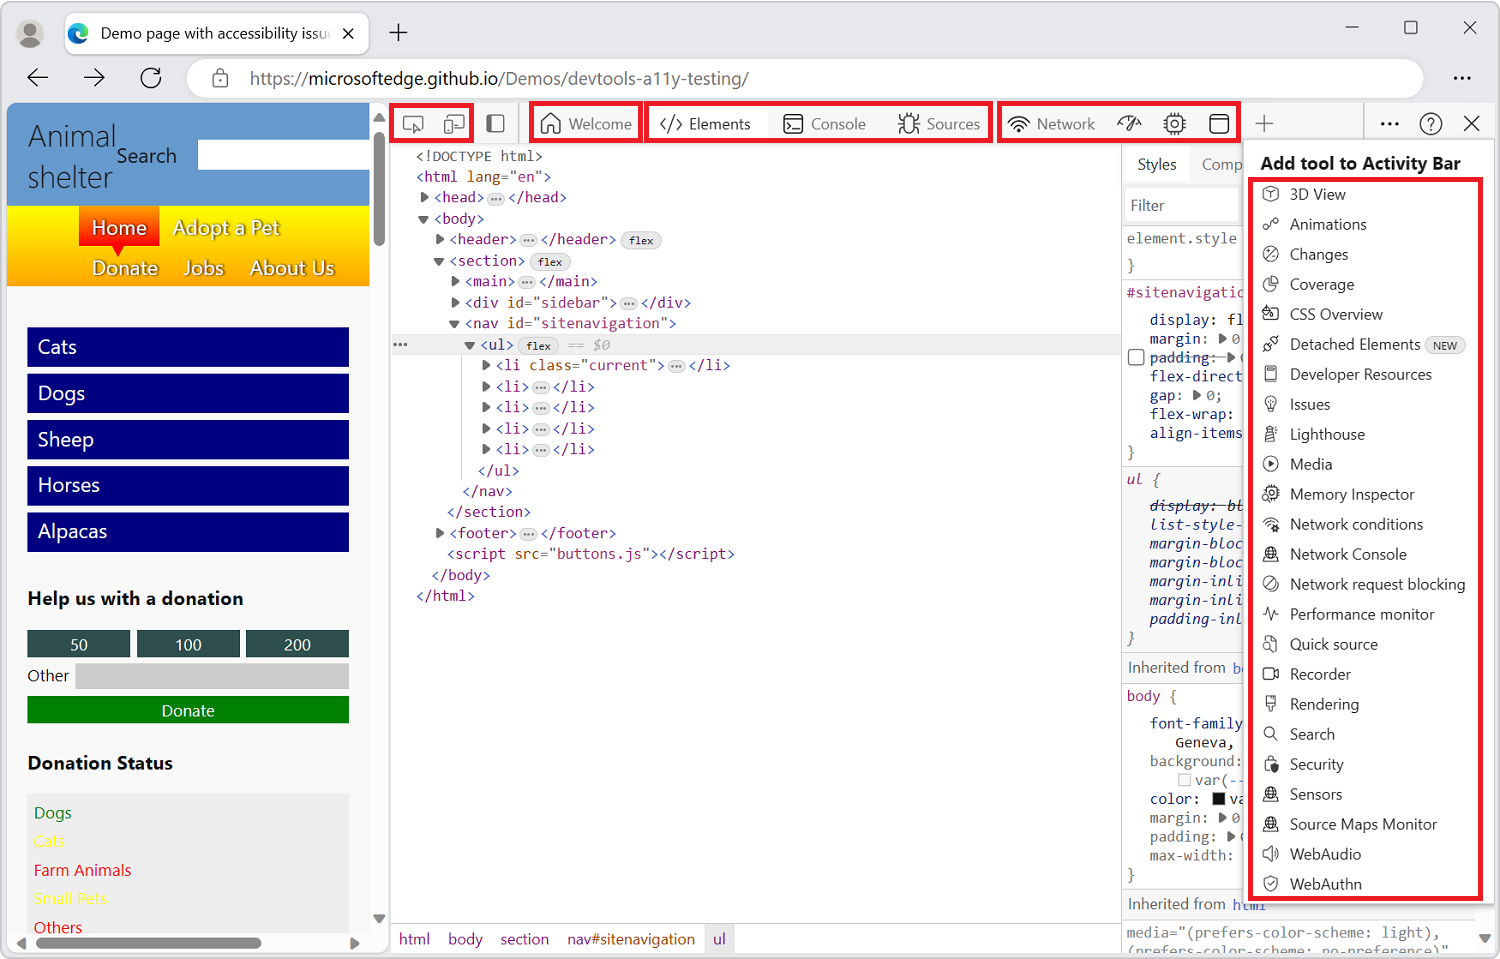
By default, the following tools are listed in the Activity Bar at the top of DevTools:
 Inspect tool
 Device Emulation
 Welcome
 Elements
 Console
 Sources
 Network
 Performance
 Memory
 Application
Overview of the default tools
| Tool | Purpose | Article |
|---|---|---|
| Use the Inspect tool to see information about an item within a rendered webpage. When the Inspect tool is active, you hover over items in the webpage, and DevTools adds an information overlay and grid highlighting on the webpage. | Analyze pages using the Inspect tool | |
| Use the Device Emulation tool, also called Device Simulation Mode or Device Mode, to approximate how your page looks and responds on a mobile device. | Emulate mobile devices (Device Emulation) | |
| The Welcome tool opens when you first open DevTools. It displays links to developer docs, latest features, release notes, and an option to contact the Microsoft Edge DevTools team. | Welcome tool | |
| Inspect, edit, and debug your HTML and CSS. You can edit in the tool while displaying the changes live in the browser. Debug your HTML using the DOM tree, and inspect and work on the CSS for your webpage. | Inspect, edit, and debug HTML and CSS with the Elements tool | |
| An intelligent, rich command line within DevTools. A great companion tool to use with others tools. Provides a powerful way to script functionality, inspect the current webpage, and manipulate the current webpage using JavaScript. | Console overview | |
| Use the Sources tool to view, modify, and debug front-end JavaScript code, and inspect and edit the HTML and CSS files that make up the current webpage. | Sources tool overview | |
| Use the Network tool to make sure that resources are being downloaded or uploaded as expected. Inspect the properties of an individual resource, such as the HTTP headers, content, or size. | Inspect network activity | |
| Analyze runtime performance, which is how your page performs when it's running, as opposed to loading. | Analyze runtime performance (tutorial) | |
| Find memory issues that affect page performance, including memory leaks, memory bloat, and frequent garbage collections. | Fix memory problems | |
| Use the Application tool to manage storage for web app pages, including manifest, service workers, local storage, cookies, cache storage, and background services. | The Application tool, to manage storage |
The Elements, Console, and Sources tools (tabs) are permanent, in the Activity Bar. The other tool tabs can be removed, or moved down to the Quick View toolbar.
More tools
The More tools (![]() ) button on the Activity Bar lists additional, optional tools that can be added to the Activity Bar.
) button on the Activity Bar lists additional, optional tools that can be added to the Activity Bar.
There's also a More tools (![]() ) button on the Quick View toolbar at the bottom of DevTools. To show or hide the Quick View panel, press Esc; or click Customize and control DevTools (...) in the upper right, and then click Toggle Quick View panel.
) button on the Quick View toolbar at the bottom of DevTools. To show or hide the Quick View panel, press Esc; or click Customize and control DevTools (...) in the upper right, and then click Toggle Quick View panel.
Overview of tools in the More tools menu
| Tool | Purpose | Article |
|---|---|---|
| 3D View | Explore the webpage translated into a 3D perspective. Debug your webpage by navigating through the DOM or z-index stacking context. | Navigate webpage layers, z-index, and DOM using the 3D View tool |
| Animations | Inspect and modify CSS animation effects by using the Animation Inspector in the Animations tool. | Inspect and modify CSS animation effects |
| Changes | Tracks any changes you've made to CSS or JavaScript in DevTools. Shows you what changes to make to your actual source files after you use DevTools to modify your webpage files sent from the server. | Track changes to files using the Changes tool |
| Coverage | Help you find unused JavaScript and CSS code, to speed up your page load and save your mobile users cellular data. | Find unused JavaScript and CSS code with the Coverage tool |
| Crash analyzer | Analyze crashes of your web app. You can input a JavaScript production stack trace, such as for non-fatal JavaScript exceptions, and then have your source maps applied to the stack trace so that you can debug faster. | Crash analyzer tool |
| CSS overview | Help you better understand your page's CSS and identify potential improvements. | CSS overview tool |
| Developer resources | Shows resource URLs for the webpage. | Developer resources tool |
| Issues | The Issues tool automatically analyzes the current webpage, reports issues grouped by type, and provides documentation to help explain and resolve the issues. | Find and fix problems using the Issues tool |
| Lighthouse | Use the Lighthouse tool to identify and fix common problems that affect your site's performance, accessibility, and user experience. | Lighthouse tool |
| Media | Use this tool to view information and debug the media players per browser tab. | View and debug media players information |
| Memory inspector | Inspect JavaScript ArrayBuffer with the Memory inspector. | Inspect a JavaScript ArrayBuffer with the Memory inspector tool |
| Network conditions | Use the Network conditions tool to disable the browser cache, set network throttling, set the user agent string, and set Content-Encodings such as deflate, gzip, and br. | Network conditions tool |
| Network Console | Use the Network Console tool to make changes to network requests (network calls) to see why they fail. Change and replay any of the network requests, and make detailed network API calls. | Network Console tool |
| Network request blocking | Use the Network request blocking tool to test blocking network requests to a specified URL pattern and see how a webpage behaves. | Network request blocking tool |
| Performance monitor | Provides a real-time view of the runtime performance of a webpage, to determine where performance problems come from, making a website run slowly. Finds whether problems are from high memory or CPU usage, too-frequent layout and style calculations, or too many DOM nodes and event listeners. | Measure runtime performance of a page using the Performance monitor tool |
| Quick source | Use the Quick source tool to display or edit source files when using a tool other than the Sources tool. | Display or edit source files using the Quick source tool |
| Recorder | Use the Recorder tool to record user flows manually, and then replay them automatically to speed up testing and performance investigations. | Record and replay user flows and measure performance |
| Rendering | Use the Rendering tool to see what your webpage looks like with different display options or vision deficiencies. | Rendering tool, to see what a webpage looks like with different display options or vision deficiencies |
| Search | Use the Search tool to find specific source files for a webpage, including HTML, CSS, JavaScript, and image files. | Find source files for a page using the Search tool |
| Security | Inspects the security of a page. | Understand security issues using the Security tool |
| Sensors | Override geolocation, simulate device orientation, force touch events when clicking, and emulate device idle state. | Emulate device sensors |
| Source Maps Monitor | Use the Source Maps Monitor tool to monitor your source maps. | Source Maps Monitor tool |
| WebAudio | Use the WebAudio tool to monitor WebAudio traffic. The WebAudio tool uses the WebAudio API. | WebAudio tool |
| WebAuthn | Use the WebAuthn tool to create and interact with software-based virtual authenticators. | Emulate authenticators and debug WebAuthn |
The More tools (+) menu in the Activity Bar and in the Quick View toolbar is dynamic: it omits any tab tools that are open on that toolbar.
Additional ways to access the tools
The following features are additional ways to access the tools:
The Quick View panel is an additional toolbar and area to hold tools, below or to the right of the Activity Bar panel.
The Command Menu is a way to directly use features of tools.
The Settings pages can turn on additional features of tools.
Experimental tools
Microsoft Edge DevTools potentially includes additional tools, if you select the experiment's check box in DevTools Settings > Experiments. For example:
| Tool | Purpose | Article |
|---|---|---|
| Protocol monitor | Displays the DevTools protocol messages that are sent and received by DevTools, to debug the inspected page. | Protocol Monitor in Experimental features. |
Activity Bar tools vs. Quick View tools
Activity Bar tools are tools that open in the Activity Bar (the upper pane) by default. Quick View tools are tools that open in the Quick View panel (the lower pane) by default. To show or hide the Quick View panel: when focus is on DevTools, press Esc.
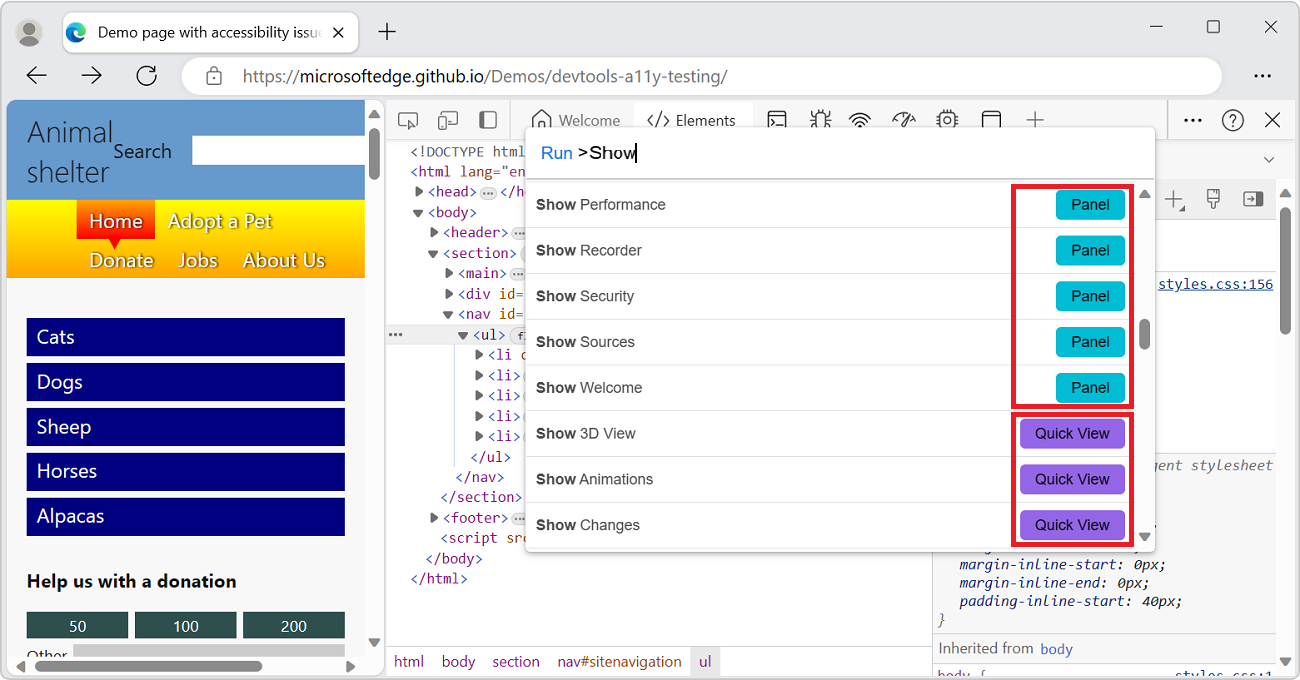
The Command Menu first lists the Activity Bar tools (indicated by the Panel label), and then the Quick View tools:
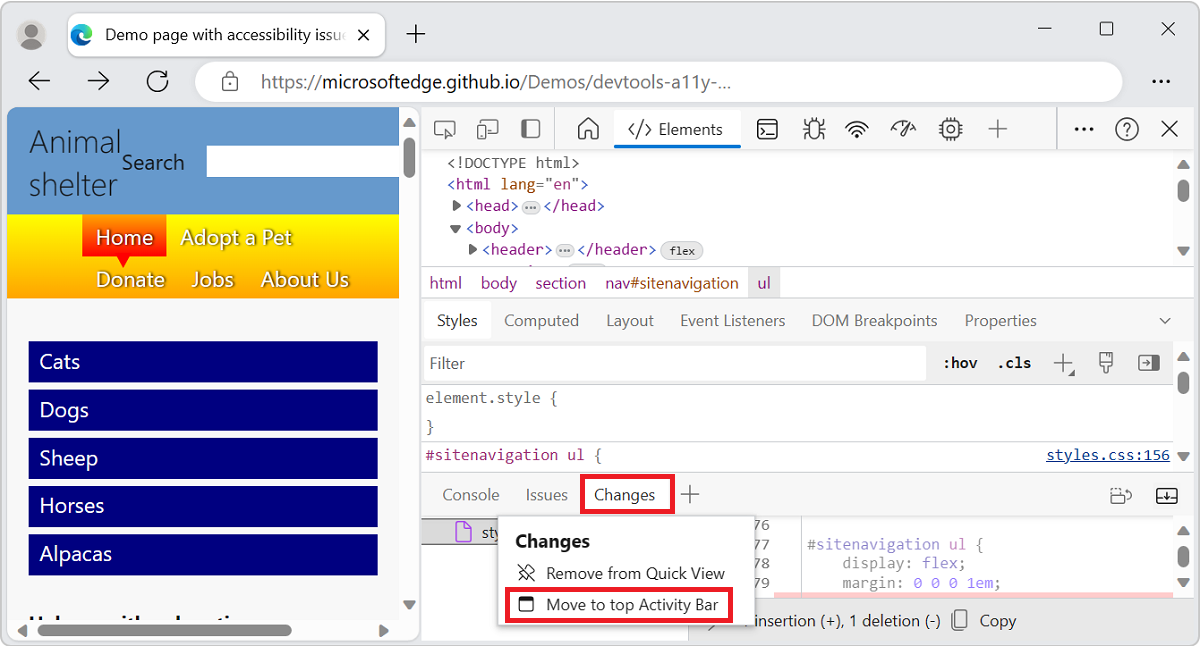
To move a tool to the other toolbar, right-click the tool's tab and then select Move to bottom Quick View, Move to side Quick View, or Move to top Activity Bar:
To open the Command Menu, press Ctrl+Shift+P (Windows, Linux) or Command+Shift+P (macOS). Or, click the Customize and control DevTools (![]() ) button and then select Run command.
) button and then select Run command.
Closing tool tabs
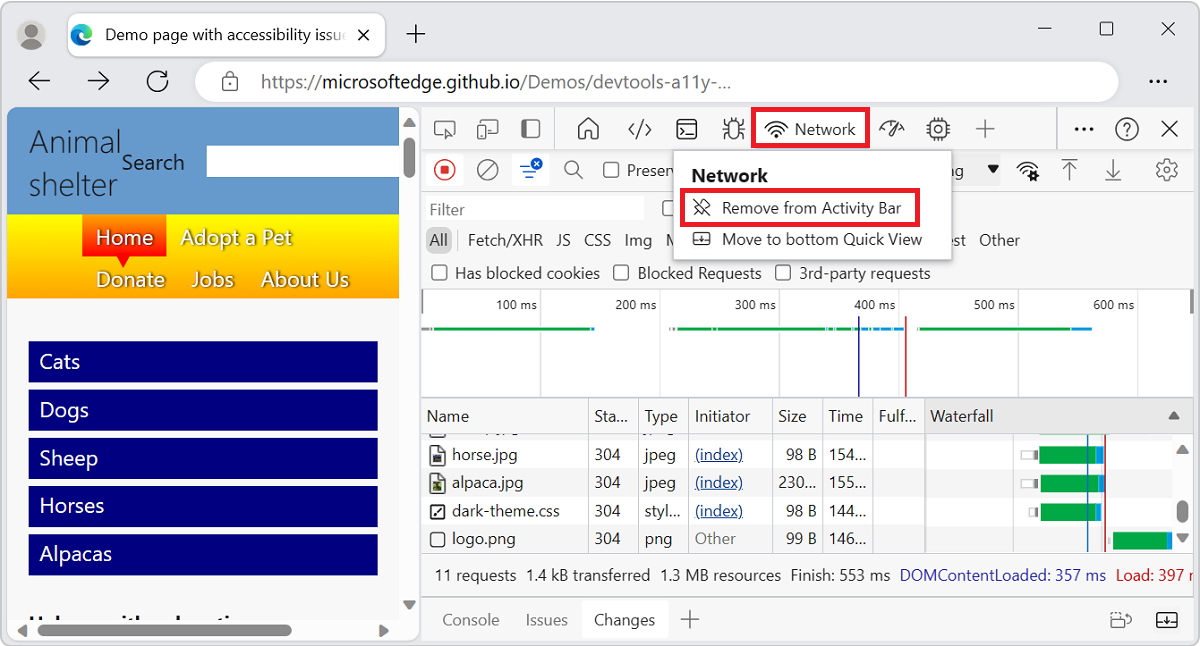
To close a tool tab that's on a toolbar, right-click the tab, and then select Remove from Activity Bar or Remove from Quick View:
The Elements, Console, and Sources tools are permanent tabs and cannot be closed or moved from the Activity Bar to the Quick View panel. You can drag their tabs to reorder them in the Activity Bar.
The Console tool is also a permanent tab on the Quick View toolbar. In contrast, the Issues tool on the Quick View toolbar can be removed.
Restoring the default tool tabs
To restore all of the default tool tabs in the Activity Bar and Quick View:
In DevTools, select Customize and control DevTools (
 ) > Settings (
 ) > Preferences.
Click the Restore defaults and refresh button. DevTools restarts, and the default tabs appear in both toolbars.
See also
- Overview of DevTools - Similar to the present article, but broader coverage, with a top-level introduction to DevTools.