Note
Access to this page requires authorization. You can try signing in or changing directories.
Access to this page requires authorization. You can try changing directories.
The Analytics tab shows the same runs as the Recent run(s) page, presented as charts so you can spot trends, drill into failure patterns, and read the mix of refresh work at a glance.
Prerequisites
A lakehouse with one or more materialized lake views.
Read permission on the workspace.
Open the Analytics tab
Open the lakehouse in your workspace.
Select Materialized lake views in the ribbon.
Select the Analytics tab.
The tab opens with Last 7 days selected by default. The KPI strip, filter bar, and date pills work the same way as on the Recent run(s) page. For details, see Recent runs of materialized lake views.
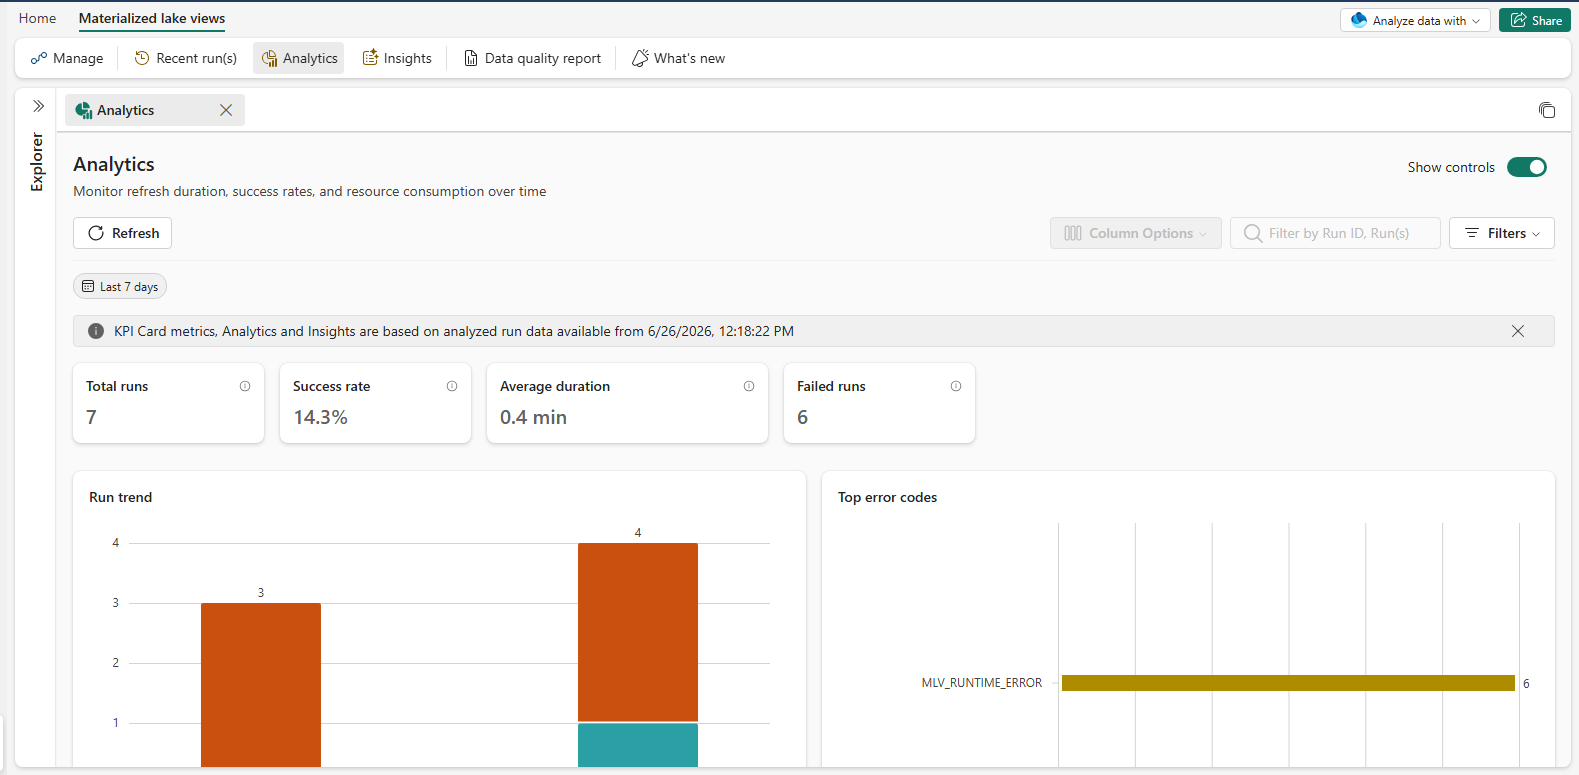
The Analytics tab answers three operational questions:
| Question | Widget |
|---|---|
| Did anything break, and how does it compare to last week? | KPI strip |
| When did failures start, and which error codes drive them? | Run trend + Top error codes charts |
| How much of my schedule does refresh work? | Run status distribution + Refresh policy distribution donuts |
Run trend chart
The Run trend chart shows runs per day for the selected period, stacked by status (Completed, Failed, Canceled, Skipped).
Use this chart to:
Spot the day a cluster of failures started.
Confirm that a fix takes effect: the failed segment should drop after you act.
Correlate failures with a schedule change or a deployment.
Top error codes chart
The Top error codes chart lists the error codes that appear most often across failed runs in the period. Focus on the top entry first; it accounts for the most run failures. When the period has no failures, the chart shows an empty state, which is expected.
Run status distribution donut
The Run status distribution donut shows the share of runs by terminal status: Completed, Failed, Canceled, Skipped. Use it to read overall health at a glance; a healthy lakehouse shows a donut dominated by Completed.
Refresh policy distribution donut
The Refresh policy distribution donut shows the share of refresh work that Fabric did, by policy:
Full: the view recomputes end-to-end.
Incremental: Fabric processes only the changed rows.
No refresh: the source has no changes, so the run does no work.
Tip
Hover over any slice to read the tooltip {N}% of MLV refresh work used {policy} refresh.