Note
Access to this page requires authorization. You can try signing in or changing directories.
Access to this page requires authorization. You can try changing directories.
The Recent runs page is a single place to confirm data freshness, identify problems, and review details for every materialized lake view refresh in the lakehouse. Use the runs grid for row-level detail, or switch to the sibling Analytics tab for trends, top errors, and refresh-policy distribution as charts.
Prerequisites
A lakehouse with one or more materialized lake views.
Read permission on the workspace.
Open the Recent runs page
Open the lakehouse in your workspace.
Select Materialized lake views in the ribbon.
Select the Recent run(s) tab.
The page opens with the Last 7 days date filter and the Grid view active. The Analytics and Insights sibling tabs share the same KPI strip, filter bar, and date pills.
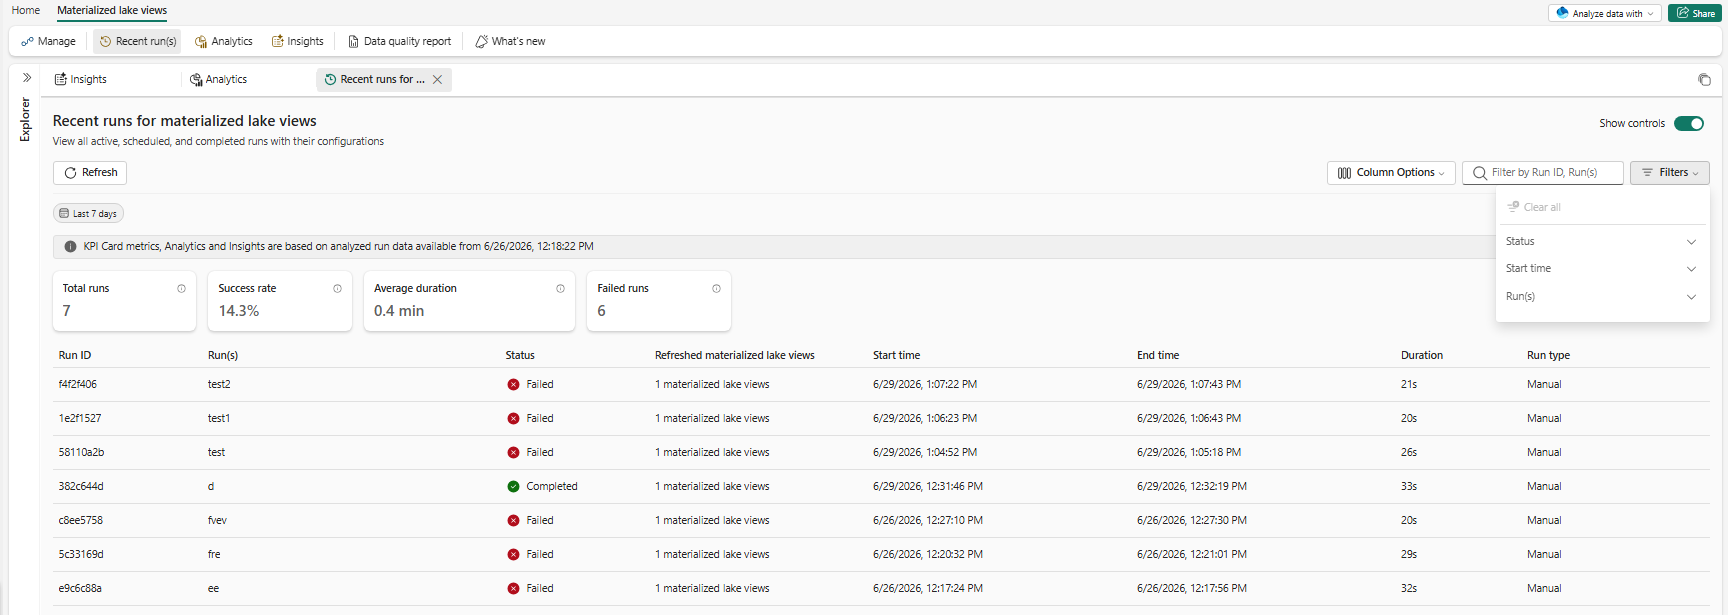
KPI strip
Four cards summarize the runs in the selected period. Each card shows the period value and a trend arrow that compares it to the prior period of the same length.
| Card | What it shows |
|---|---|
| Total runs | Number of materialized lake view runs in the selected period, excluding skipped and in-progress runs. |
| Success rate | Percentage of runs that completed successfully in the selected period. |
| Average duration | Average end-to-end duration of completed runs, displayed as {N} min. |
| Failed runs | Number of runs that ended in failure in the selected period. |
All four cards use the same arrow colors: up arrow (green) when the value increases, down arrow (red) when it decreases. A card shows no arrow in the first period after the feature turns on, because there's no prior-period baseline yet. Select the i icon next to a card label to read its full tooltip definition.
Filters
Filter by date
Use the date pills above the page header:
Anytime, Last 24 hours, Last 7 days, Last 30 days.
Customize to set a
Custom date rangewithStart date,End date, andTime zone. The window must be 30 days or shorter.
The default is Last 7 days. The selection persists for the session.
Filter by status, run, start date, or keyword
Select Filters to open the filter dropdown:
| Accordion | Use |
|---|---|
| Run(s) | Limit to one or more materialized lake view runs. |
| Status | Filter by Completed, Failed, Canceled, Skipped, or In progress. |
| Start date | Narrow further by run start time. |
Type in the keyword box to filter by Run ID or Run(s) name. Active filters appear as removable chips below the bar. Select Clear all to reset.
View recent refreshes
Grid view is the default. Each row represents one refresh operation on the lakehouse. The default columns are Run ID, Run(s), Status, and Start time. Select Column Options to add Refreshed materialized lake views, End time, Duration, Scheduled by, and Run type.
The Run(s) column displays the name of the schedule or run that triggered the refresh. For scheduled runs, the column shows the schedule name. For on-demand runs, it shows the name you entered when you started the run.
Each row's status:
| Status | Description |
|---|---|
| In progress | The refresh is running. |
| Completed | All views refresh successfully. |
| Failed | One or more views encounter an error. Fabric marks child views of a failed view as Skipped. |
| Skipped | Fabric skips this run when another active run refreshes the same view. |
| Canceled | A user cancels the run. |
Investigate why a run failed
In the Grid, select the failed run row to open the run detail page.
Scroll to the Activities panel. Select the Failed sub-tab to see only the views that failed in this run.
Select a failed view in the lineage graph to see the Error Code, Message, and Detailed logs with a More details link.
Use Copy all to clipboard to share the error with the team.
Select Open Spark UI in the Activities row's Spark link column when the error message alone isn't enough to diagnose driver or executor failures.
Find a specific run
Search: Type a keyword in the search box to filter by Run ID or run name.
Filters: Filter by status, run, or start date.
Column Options: Show or hide columns. Select Apply to save the selection, or select Reset to default to restore the original layout.
To see the same runs as charts (trends, top error codes, and refresh-policy distribution), select the Analytics sibling tab. For details, see View analytics for materialized lake view runs.
Note
- The Recent runs grid keeps runs from the last 30 days.
- Environment details appear only if you have access to the environment and it still exists.