Note
Access to this page requires authorization. You can try signing in or changing directories.
Access to this page requires authorization. You can try changing directories.
Tip
Key points:
- Your agent queries Application Insights, Log Analytics, Azure Monitor metrics, Resource Graph, Activity Logs, and resource-specific diagnostics, all in one investigation.
- You don't need connectors. Everything works through managed identity and Azure RBAC.
- Your agent decides which sources to query based on the symptom, correlates evidence across them, and explains what it found.
- Deep diagnostics go beyond metrics and include CPU profiling, memory analysis, connectivity checks, and deployment history.
The problem: too many places to look
Azure's observability stack is comprehensive. Application Insights captures traces and dependencies. Log Analytics stores custom logs and events. Azure Monitor tracks resource metrics. Resource Graph maps topology. Activity Logs record configuration changes. Each Azure service has its own diagnostics, including Container Apps console logs, App Service deployment history, Function App health checks, and AKS pod status.
That breadth is the problem. During an incident, you need data from several of these sources, but you have to remember which portal has which data, write KQL from scratch, manually copy operation IDs between tools, and correlate timestamps across tabs. The data exists everywhere. Knowing where to look and connecting what you find takes the most time.
How your agent investigates

Your agent has built-in access to Azure's full diagnostic surface. Grant permissions once, and your agent queries the right sources automatically based on the symptom:
- Discovers resources: Resource Graph finds topology, relationships, and connected resources across your subscriptions.
- Queries logs: Application Insights for request traces, exceptions, and dependencies; Log Analytics for custom workspace data.
- Analyzes metrics: Azure Monitor for CPU, memory, request rates, and availability with automatic time-series analysis.
- Checks changes: Activity Logs surface recent configuration changes and deployments that might correlate with the issue.
- Runs deep diagnostics: Built-in skills do CPU profiling, memory analysis, latency assessment, connectivity checks, and resource-specific health analysis.
- Executes Azure CLI commands: Reads resource state, checks configurations, and inspects properties that APIs don't expose directly.
- Correlates everything: Evidence from all sources is connected automatically, with no copy-paste between portals.
Note
Your agent selects the right tools for each resource type automatically. You don't configure which tools to use. Your agent decides based on the symptom and the resource involved.
Before and after using Azure observability diagnostics
| Before | After | |
|---|---|---|
| Tools opened | 3-5 portals, separate browser tabs | None. Your agent queries them all. |
| Query writing | KQL from scratch for each source | Your agent constructs queries from symptoms |
| Correlation | Copy operation IDs between portals | Automatic cross-source correlation |
| Deep diagnostics | Go to resource-specific blades | Your agent runs CPU profiling, connectivity checks, and deployment history automatically |
| Interpretation | You read raw results across tools | Your agent explains what the evidence means together |
| Which tool? | You remember which portal has which data | Your agent knows |
Built-in diagnostic capabilities
Your agent uses these capabilities automatically during investigation.
Application Insights
Your agent queries Application Insights resources directly by using their resource ID or app ID. It runs KQL, correlates time series, traces distributed transactions, and assesses the scope of impact.
When investigating slow responses, for example, your agent might query the requests table for duration spikes, use time-series correlation to identify which endpoints and result codes contribute, trace a slow request through all dependencies, and report: "Endpoint /api/orders is 5x slower due to SQL dependency timeout."
Log Analytics
Your agent runs KQL queries against Log Analytics workspaces by using either resource ID or workspace ID. This covers custom logs, performance counters, Azure diagnostic logs, and any other data routed to a workspace.
Azure Monitor metrics
Your agent discovers available metrics for any resource type, queries time-series data with dimension filtering, and performs automated trend analysis. It can also generate charts from metric data for inclusion in reports and investigation threads.
When your agent uses Azure Monitor as its incident platform, it also manages alerts directly by acknowledging and closing them during investigation.
Note
Alert management requires the Monitoring Contributor role at subscription scope. Your agent receives this role automatically when you configure managed resource groups during agent creation, or when you connect Azure Monitor as your incident platform. If the role is missing, a banner in the portal prompts you to assign it.
Resource Graph and Activity Logs
Resource Graph discovers resources across your subscriptions, maps topology, and finds connected resources. Your agent uses this tool to understand the full blast radius by finding related resources in the same resource group, virtual network, or App Service plan.
Activity Logs surface recent configuration changes, deployments, and administrative actions. These logs help your agent correlate an outage with a recent change, such as "App started failing 4 minutes after this deployment" or "network rules changed at the same time availability dropped."
Built-in skills and Azure CLI
Beyond metrics and logs, your agent has specialized capabilities that go deeper.
| Category | What it does |
|---|---|
| Deep diagnostics | CPU profiling, memory analysis, latency assessment, thread pool starvation detection |
| Connectivity checks | TCP connectivity tests, DNS resolution, storage connectivity verification |
| Resource-specific diagnostics | Container App revision management, App Service configuration checks, Function App deployment history, AKS kubectl commands, Redis diagnostics, PostgreSQL health, API Management analysis |
| Reliability assessment | App Service health scoring: AlwaysOn, health checks, instance count, autoheal configuration |
| Azure CLI | Read commands (az ... show, az ... list) for any Azure service, and write commands (az ... update, az ... scale) with approval |
| ARM operations | Direct resource property inspection, app settings management, deployment slot operations |
Your agent selects these tools based on the resource type and the nature of the problem. A container app issue triggers revision listing and console log inspection. An App Service issue triggers CPU profiling and deployment history. You don't configure this behavior because it happens automatically.
Network troubleshooting
Describe a connectivity problem in chat and the agent resolves the resources, discovers the network path, classifies the scenario, and checks every hop. It covers same-VNet, peered VNets, hub-spoke with firewall/NVA, ExpressRoute, VPN (including IKE phase 1/2 log analysis), Virtual WAN, Private Endpoints, Private Link Services, Service Endpoints, and outbound internet paths.
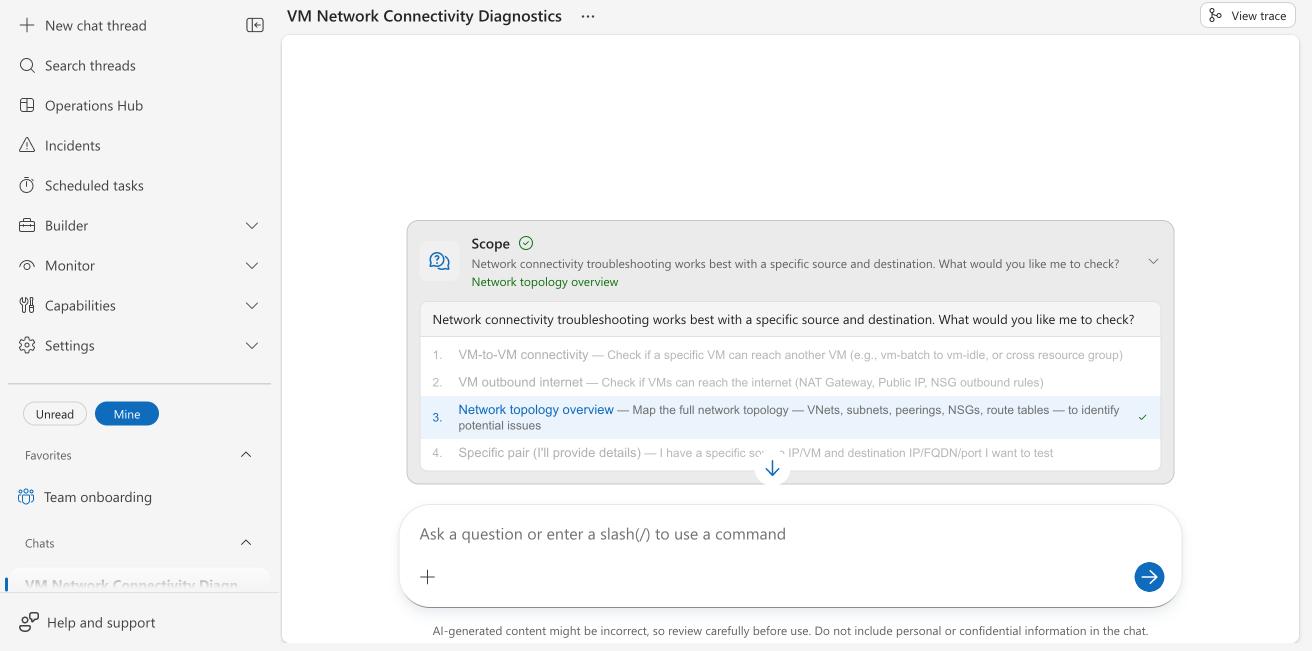
The agent starts by discovering your VMs and presenting scoping options: VM-to-VM connectivity, outbound internet checks, full topology mapping, or a specific source-destination pair.
Before running diagnostics, the agent asks: "Do you grant permission to run diagnostic commands on the VM(s)?" If you say yes, it runs in Active mode, executing MTR traceroute, tcpdump, guest-OS firewall checks, and ARP table inspection via az vm run-command. If you decline, it runs in Passive mode using only control-plane APIs (Reader + Monitoring Reader is enough). Hops it can't fully verify appear gray in the output diagram.
Every session ends with a color-coded Mermaid network path diagram (green = pass, red = root cause with inline reason, yellow = warning, gray = not checked) and a four-option prompt: save the report, create an Azure support request, get a PDF, or ask follow-up questions.
Network topology mapping
Ask the agent to find your full network architecture by using Azure Resource Graph. It creates per-VNet IP-to-resource tables, a VNet-to-VNet connectivity graph (peering, gateway transit, Virtual WAN hubs, ExpressRoute), paths to on-premises through every VPN, ExpressRoute, and vWAN egress, a Mermaid topology diagram, and a severity-coded observation table. It uses read-only access and requires only Reader access at the subscription scope.

The agent automatically identifies critical infrastructure problems, including overlapping address spaces, disconnected peerings, deallocated firewalls, blackhole UDRs, and orphaned NICs.

Support request creation
After diagnosing a network problem, your agent can create an Azure support request with the diagnostic evidence attached as a PDF. The PDF includes a structured description, validated routing to the correct engineering team, and full analysis.
Investigation example
You: "My container app ca-web is throwing errors."
Agent investigates:
Finds the resource via Resource Graph:
Found: /subscriptions/.../resourceGroups/rg-groceryapp/providers/Microsoft.App/containerApps/ca-web-3syj3i2fat5dm
Latest revision: ca-web-3syj3i2fat5dm--azd-1769393374 (100% traffic)
Checks logs, metrics, and diagnostics:
- Console logs: web starts normally, listens on port 3000
- Metrics (last 30 min): requests = 0, CPU approximately 0%, memory about 3%
- Container health: running, no restarts
- No stack traces or 4xx/5xx errors in this container
You provide more context: "ERROR Supplier API is rate limited!"
Continues investigation checks related API container logs and configuration:
ContainerAppConsoleLogs_CL
| where RevisionName_s contains "ca-api"
| where Log_s contains "rate" or Log_s contains "limit"
Found:
SUPPLIER_RATE_LIMIT=5in the environment, but the agent observed request bursts of 40/min.
Agent conclusion: "API exceeding supplier rate limit configured at 5 requests/min but observed bursts up to 40/min. Recommend implementing client-side throttling with exponential backoff."
Get started
Azure observability works automatically when you grant your agent Reader access to your subscription during initial setup.
| Resource | What you learn |
|---|---|
| Create and set up | Grant permissions during initial agent setup |
| Manage permissions | Add or change resource access after setup |