Create a report using the Report Wizard
Use the Report Wizard to create reports with charts and tables that allow you to easily analyze your data.
All reports that are created using the Report Wizard are Fetch-based reports. All reports generated with the Report Wizard print in landscape mode.
Create a new report
From the left navigation pane, select the reports area.
On the command bar, select New.
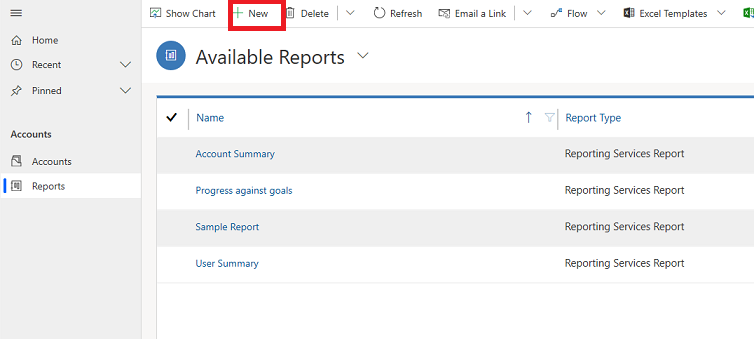
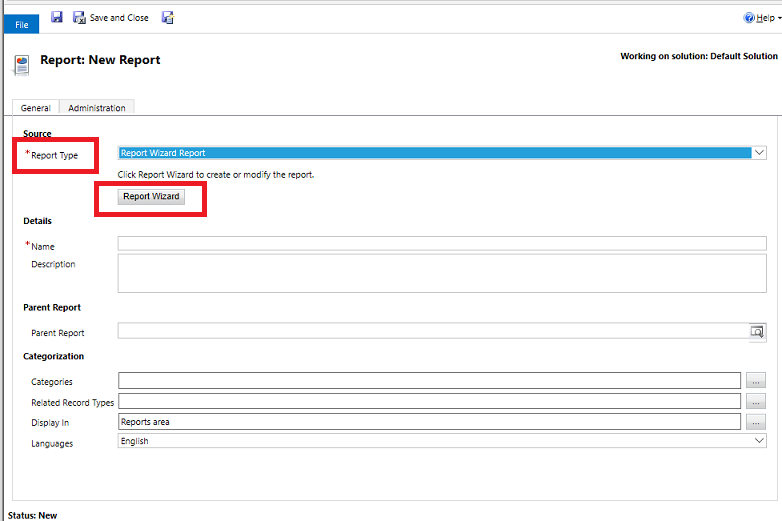
A Report:New Report screen appears. For Report Type leave the default selection to, Report Wizard Report and select the Report Wizard button.
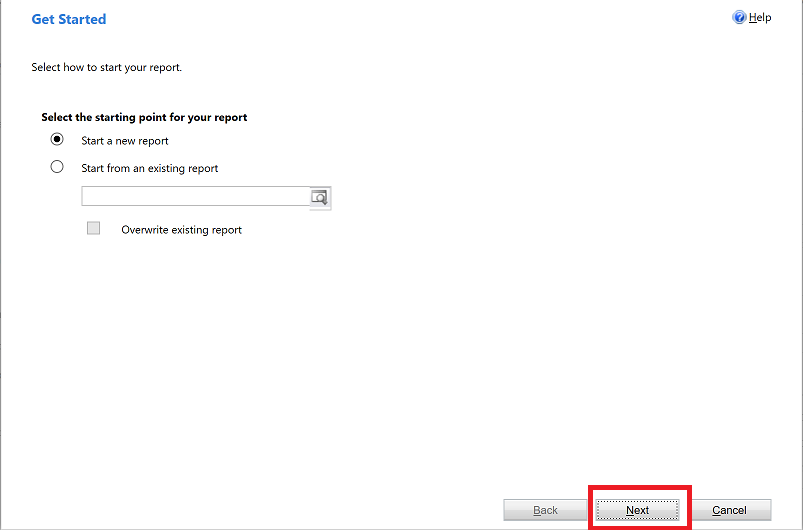
In the next screen, leave the default selections and then select Next.
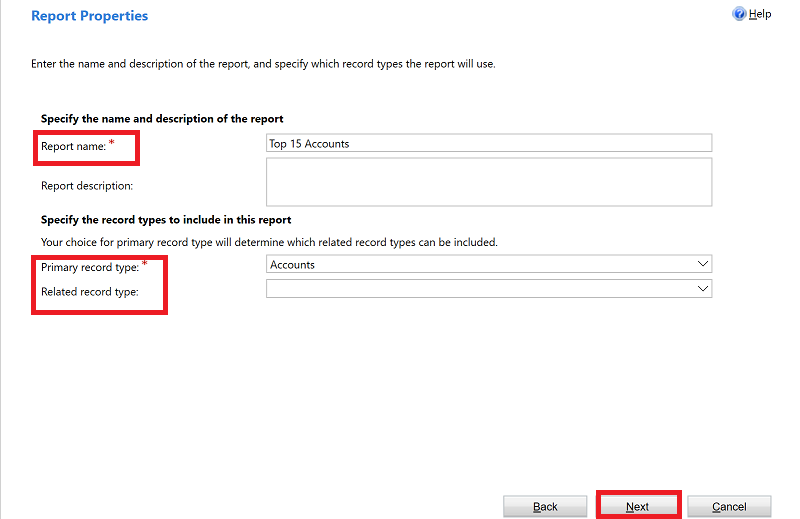
On the Report Properties screen, enter a name for the report and then choose the row to include in the report and then select Next.
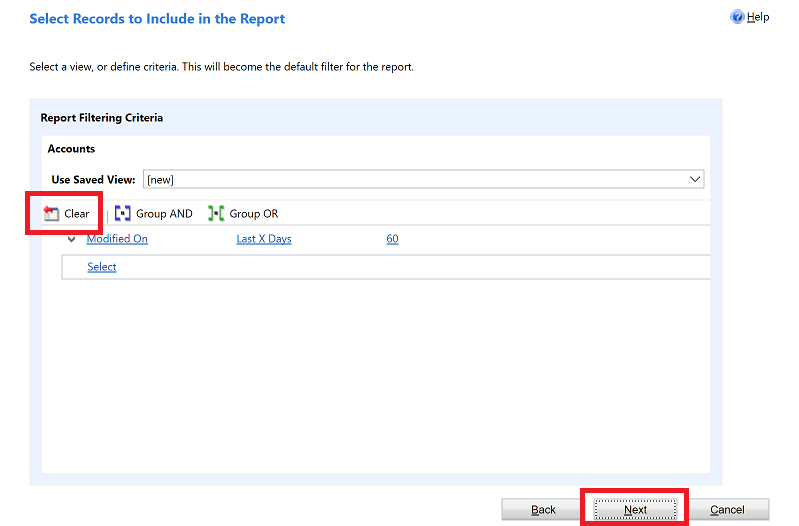
On the Select Rows to Include in the Report screen, choose the filters to determine which rows are included in your report. For example, if you only want to see results for rows modified in the last 60 days, you can set that filter in this screen. If you don’t want the data filtered, select Clear.
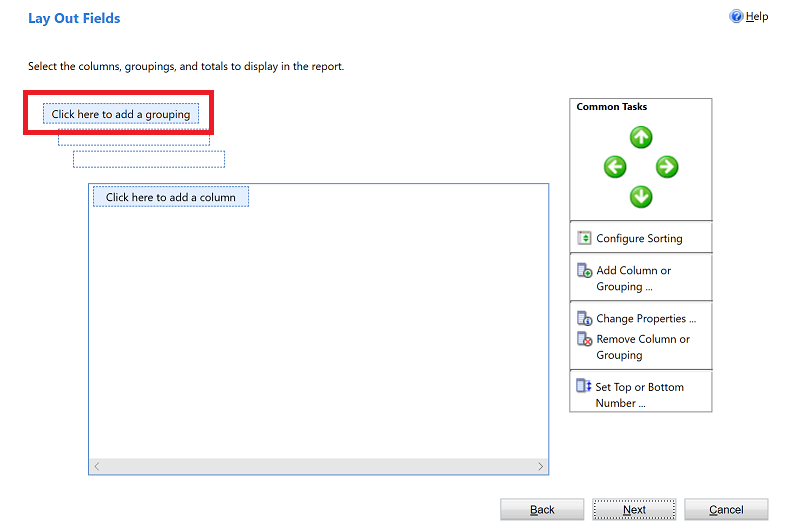
On the Lay out Columns screen, choose the layout of your report. Select Click here to add a grouping and choose how you want your data grouped.
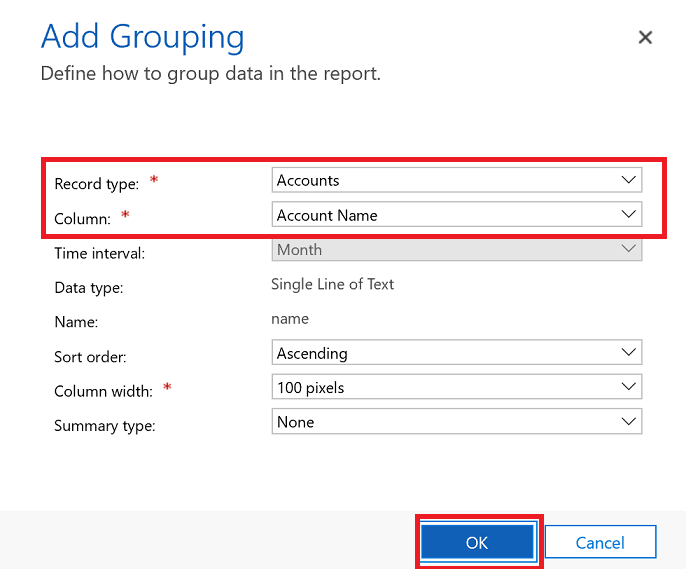
Select the Row type and the Column for the data you want to have grouped in the report. When you are done with your selections, select OK.
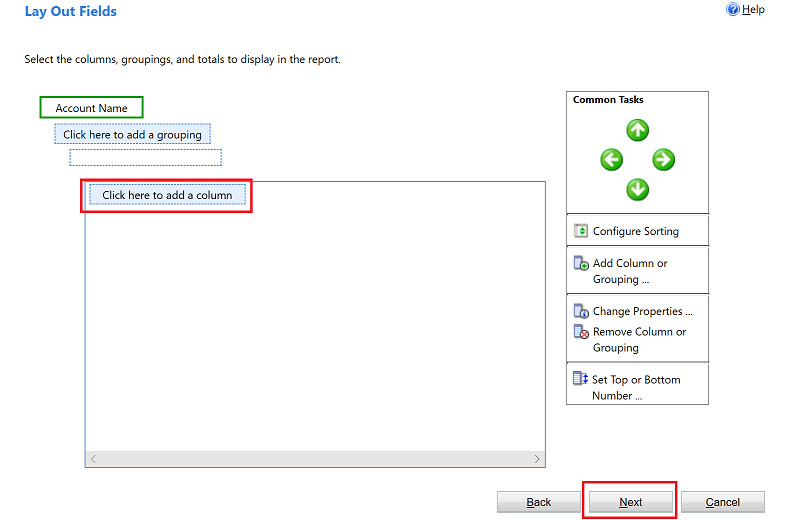
Select Click here to add a column to columns of data related to the row type you chose in the previous step.
On the Add Column screen choose the data you want to have displayed for the column and then select OK.
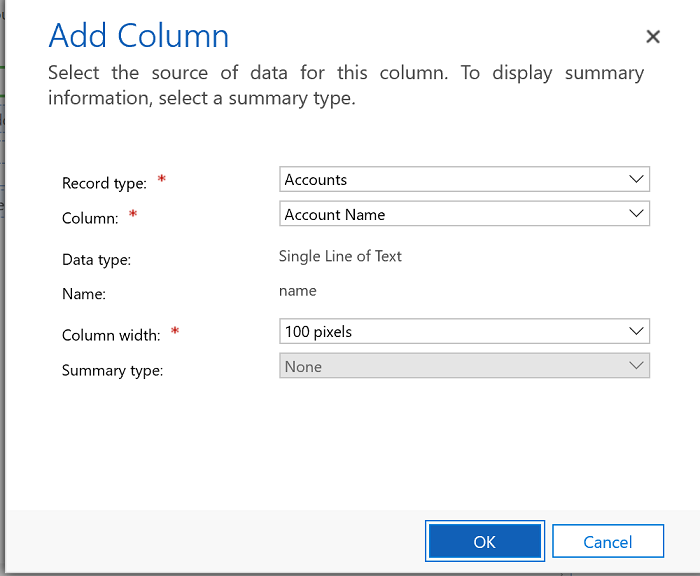
Repeat the previous step for any more columns that you want to add. When you are done, on the Lay Out Columns screen, select Next.
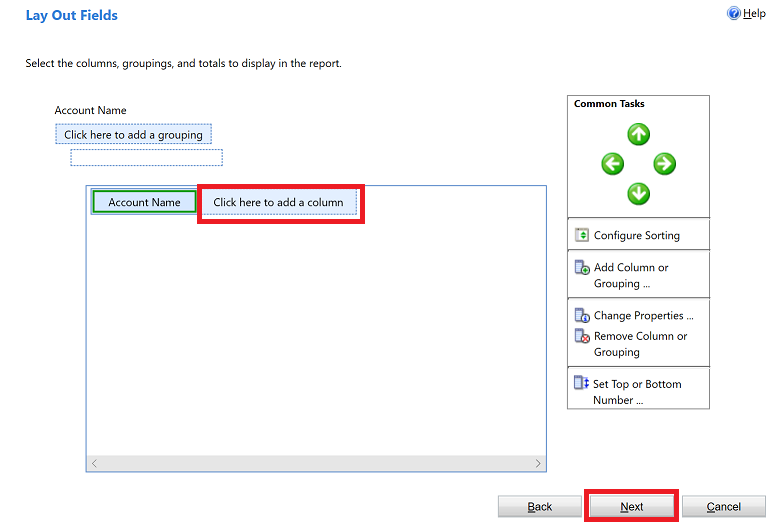
On the Format Report screen, choose how to format your report and then select Next.
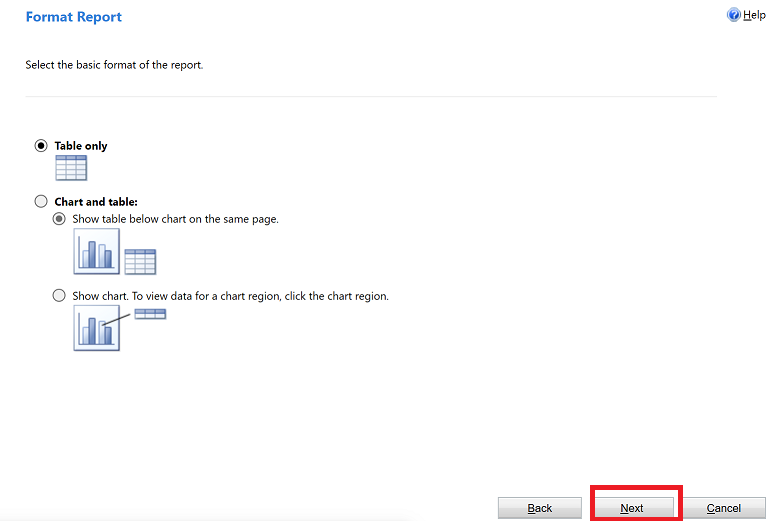
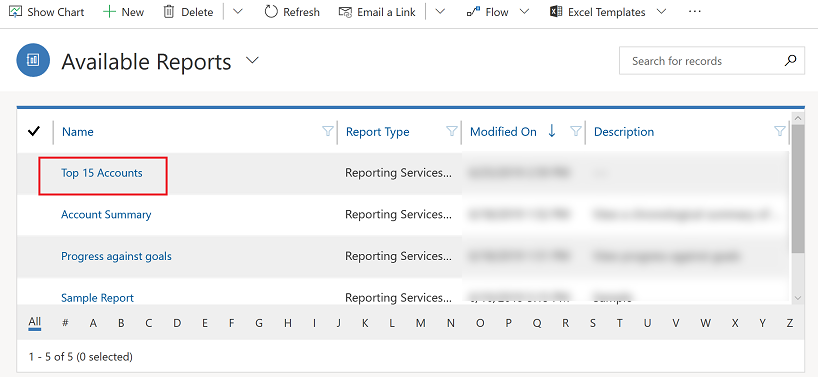
Review the summary of your report and select Next and then select Finish. You can now see this report in the list of report in the system.
Note
The reports that are querying notes, may display in HTML-formatted text instead of plain text. This is because the rich-text editor is enabled by default. To workaround this issue, do one of the following:
- Disable the rich-text editor. For more information, see Rich text editor control in Power Apps. When you disable the rich-text editor, new notes that are created will not then have the HTML tags. The existing notes that were created when the rich-text editor was enabled will still show in HTML-formatted text.
- Update the report definition to support formatted text. For more information, see Importing HTML into a Report.
Note that multi-select picklist fields are not fully supported in the Report Wizard. Multi-select picklist fields can't be added as a grouping or a column to the report.