Note
Access to this page requires authorization. You can try signing in or changing directories.
Access to this page requires authorization. You can try changing directories.
A deep investigation is a troubleshooting workflow run by the Azure Copilot Observability Agent. The following examples show how a deep investigation can connect application, infrastructure, dependency, and database signals to explain why failures occur and what to do next.
Virtual machine performance regression
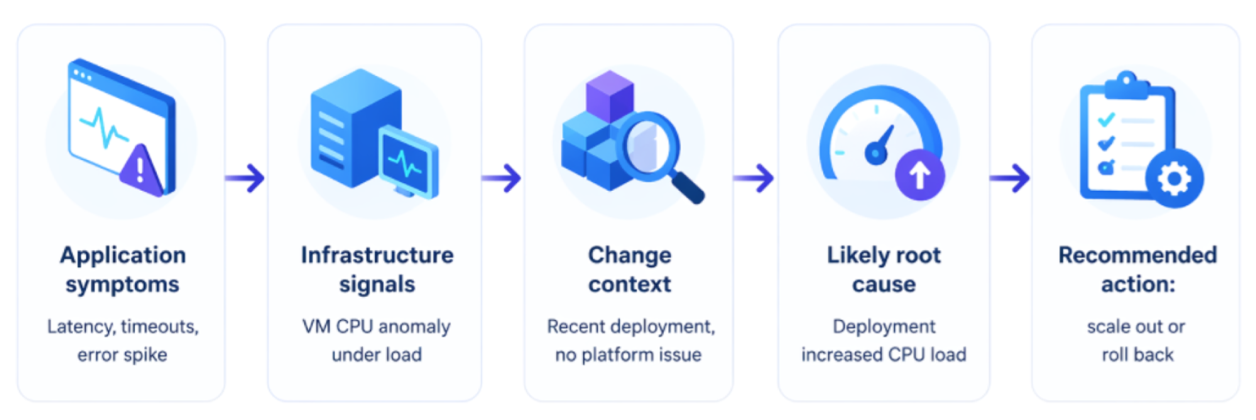
Here’s an example of a latency alert that fires on an Application Insights resource backed by a virtual machine:
- The agent uses the alert’s resource and time range to scope the problem.
- It expands scope from the application to the host virtual machine and the dependencies the application calls.
- It correlates signals across layers: a CPU spike on the virtual machine (based on metric anomaly), increased latency and error rates in application requests (based on logs analysis), and a deployment to the virtual machine just before the spike (Activity Log).
- The agent concludes that the application latency spike is likely caused by CPU pressure, which in turn was probably caused by the recent deployment.
Suggested next steps: scale out the virtual machine or roll back the deployment.
AKS pods stuck in Pending after a rollout
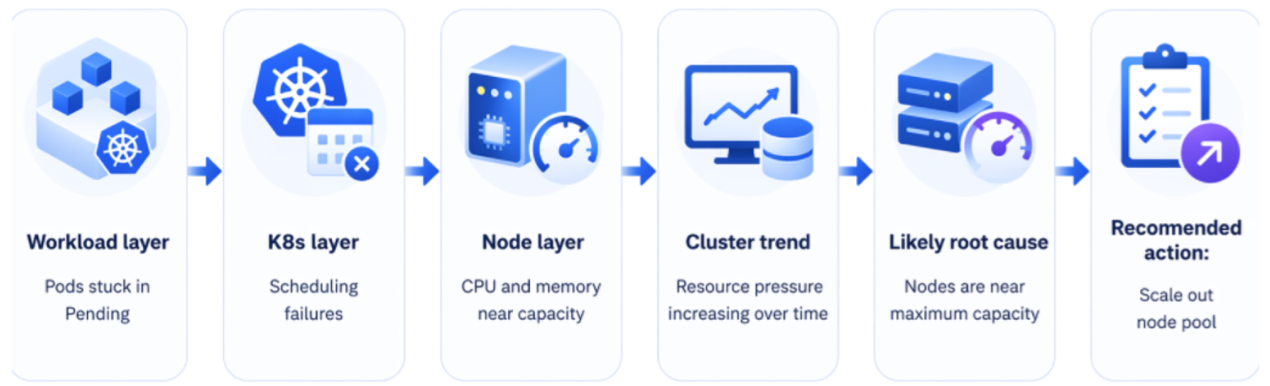
Here’s an example of an AKS workload where pods from a recent rollout sit in Pending and never reach Running:
- The agent scopes to the workload and its hosting cluster.
- It analyzes signals at three levels: the workload (pod state and Kubernetes events), the node (CPU and memory near capacity), and the cluster (resource trend over recent hours).
- It correlates the workload’s
Pendingstate with node-pool saturation (based on node CPU and memory metrics) and surfaces the matching scheduler events. - The agent concludes that the pods can’t be scheduled because the node pool is at capacity.
Suggested next steps: scale out the node pool or right-size the workload’s requests.
Agent failures caused by backend SQL saturation
This pattern is common across Foundry agents, Foundry GenAI agents, and other application-hosted agents when the backend database is briefly saturated.
- The agent scopes to the affected agent or application, its dependencies and tool calls, and the SQL backend.
- It analyzes cross-layer signals, including runs and errors, dependency/API failures, logs, and SQL resource metrics.
- It correlates failures with SQL timeouts and a spike in failed dependency calls at incident start.
- It rules out alternatives such as cache issues, unrelated dependency failures, or broader service outage.
- It identifies a short SQL saturation window (often driven by a high-cost query) and concludes that transient SQL pressure caused the failures.
Suggested next steps: optimize expensive queries, improve backend resilience, and monitor SQL resource utilization during peak periods.