Note
Access to this page requires authorization. You can try signing in or changing directories.
Access to this page requires authorization. You can try changing directories.
A deep investigation is the troubleshooting workflow that the Azure Copilot Observability Agent runs when something is already wrong and you need to know what happened and what to do next. The agent collects signals from across the application, infrastructure, and Azure platform layers, correlates them automatically, and produces a report with findings and recommended next steps. Deep investigations replace the manual work of pivoting across dashboards, logs, and deployment history to piece together what changed. Deep investigations work across Azure resource types, including Azure Kubernetes Service (AKS), virtual machines, and Application Insights.
This article explains when to use a deep investigation, where you start one, how the agent runs it, and what the report contains. For ad-hoc questions that aren't tied to an active incident, see Chat with your observability data.
Deep investigation versus chat exploration
Use a deep investigation when:
- An Azure Monitor alert fires and you don't yet know the cause.
- You see a latency or error spike across multiple resources and want a cross-layer view.
- An incident spans your application code, the host infrastructure, and Azure platform conditions.
Use chat with your observability data instead when:
- You have an ad-hoc question about a single resource ("What were the top exceptions yesterday?").
- You're exploring telemetry without an active incident.
- You want to draft a Kusto query or understand a pattern in your logs.
For chat workflows, see Chat with your observability data. A single deep investigation operation is capped at 300 Azure Agent Credits (AACs). For cost details, see Billing and cost management for Observability Agent in Azure Monitor.
Supported incident scenarios
Deep investigations target the following incident categories. For walkthroughs of different scenarios, see Deep investigation examples in the Azure Copilot Observability Agent.
- Application issues
- Deployment regressions
- Request and dependency failures
- Performance regressions
- Resource exhaustion
- Identity or configuration errors
- Infrastructure issues
- Compute saturation
- Disk I/O throttling
- Misconfigured dependencies
- Network connectivity failures
- Platform issues
- Azure maintenance or outages
- Managed infrastructure issues, such as SNAT port exhaustion and upgrade blocking issues
Where you start a deep investigation in the Azure portal
Users with access to Azure Copilot can perform deep investigations. If your organization restricts Azure Copilot access, you can't use the Observability Agent. For more information, see Manage access to Azure Copilot.
You start a deep investigation from several places in the Azure portal. Each entry point provides the agent with the resource and time-range context for the incident.
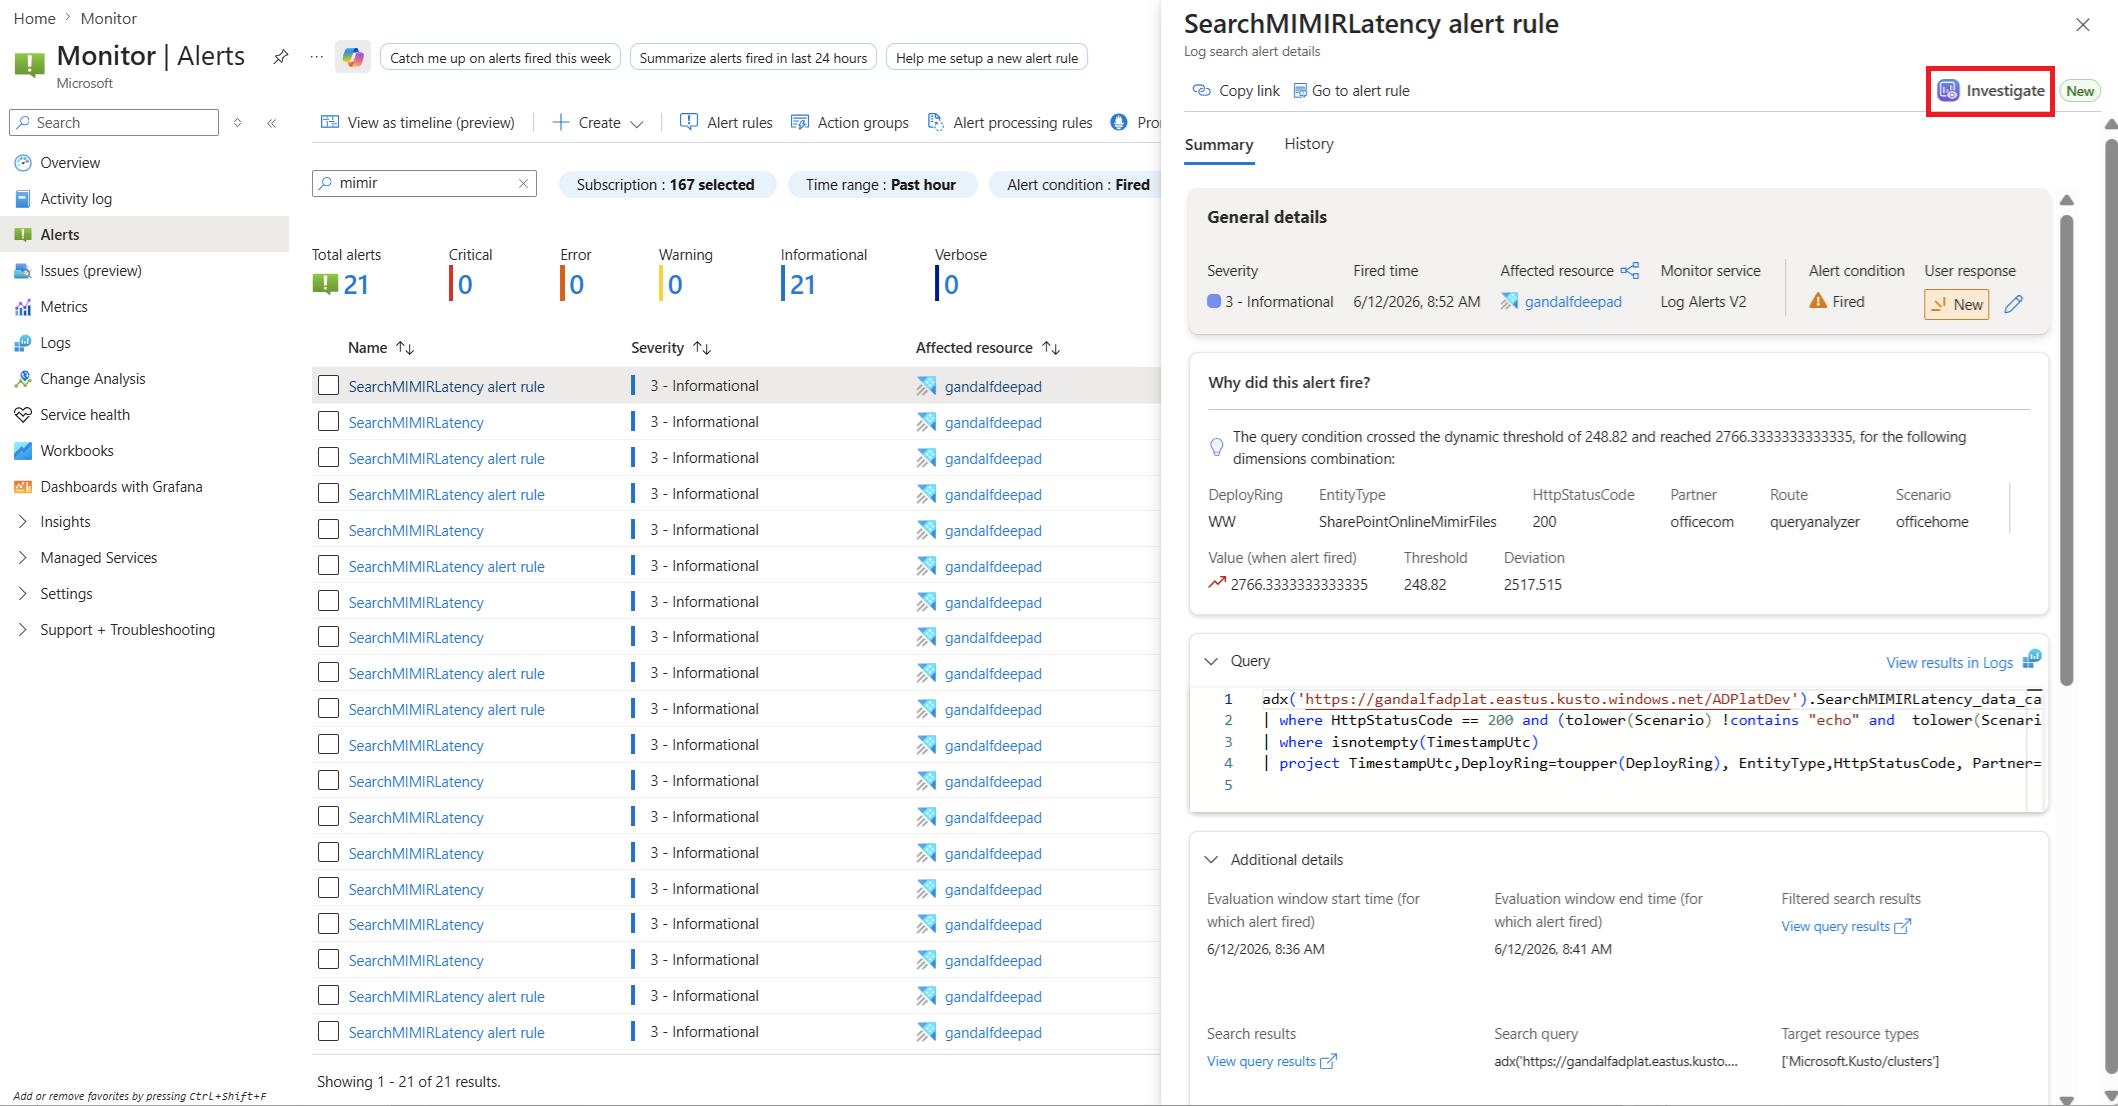
Azure Monitor alert (recommended) — open a fired alert in the portal and select Investigate. This entry path is primary because an alert already carries the affected resource, the symptom, and the firing time.
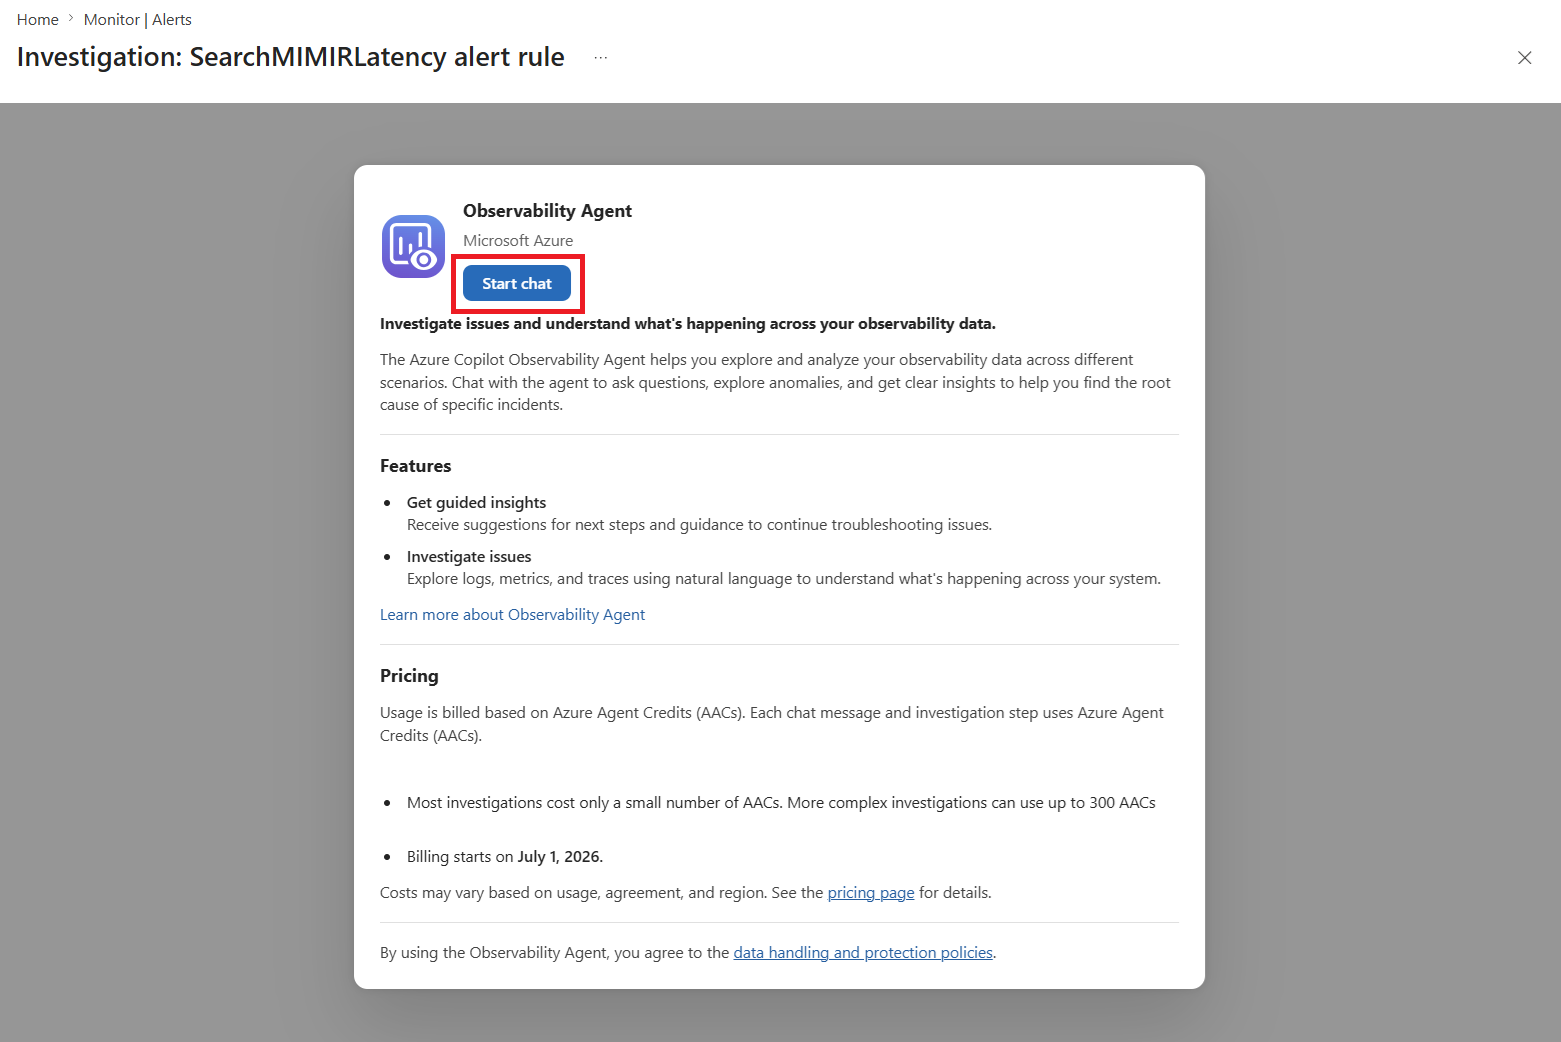
After you select Investigate, the Observability Agent opens with a brief summary of its features and Azure Agent Credit (AAC) usage. Select Start chat to begin the investigation.
Alert email notification — open the Investigate link from an Azure Monitor alert email to start an investigation without going through the alerts list first.
Logs blade — opens chat scoped to a Log Analytics workspace or query, where you can escalate to a deep investigation.
Activity log — start an investigation from a Failure Resource Health event in the Activity log.
Application Insights — start directly from the Failures blade with the selected failure context handed to the agent, or open chat from the Agents view and escalate to a deep investigation.
AKS — open chat from the Container Insights blade or the AKS resource page and escalate to a deep investigation.
For details on chat entry points, see Chat with your observability data.
The six-stage investigation pipeline
When you start a deep investigation, the agent runs a fixed sequence of stages. These stages run without your input. The agent runs each stage automatically and streams progress as it works.
| Stage | What the agent does |
|---|---|
| 1. Scope the problem | Identifies the most likely affected resources and their connected dependencies, based on the entry-point context. |
| 2. Collect data | Pulls metrics, logs, traces, events, Activity Log entries, and change history for the in-scope resources. |
| 3. Detect anomalies | Applies learned baselines to metrics and analyzes logs for outliers and unusual patterns. |
| 4. Correlate across resources | Aligns signals across the application and infrastructure layers to find evidence that moves together. |
| 5. Run deep diagnostics | Invokes resource-specific tools where needed (for example, AKS node-level diagnostics or Application Insights dependency analysis). |
| 6. Summarize findings | Produces a report that explains what happened, why, and what to do next. |
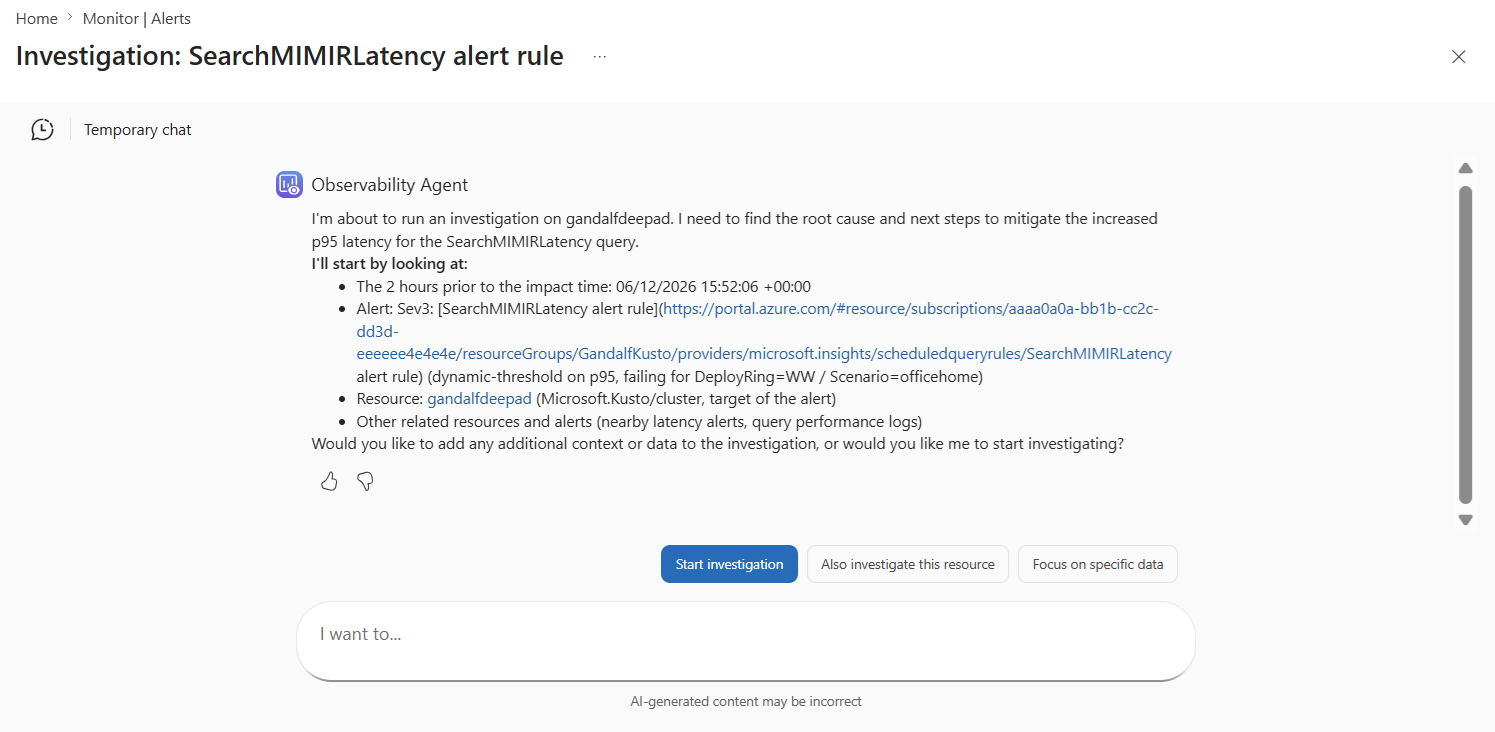
The following image shows the agent summarizing the actions it plans to take after scoping the problem.
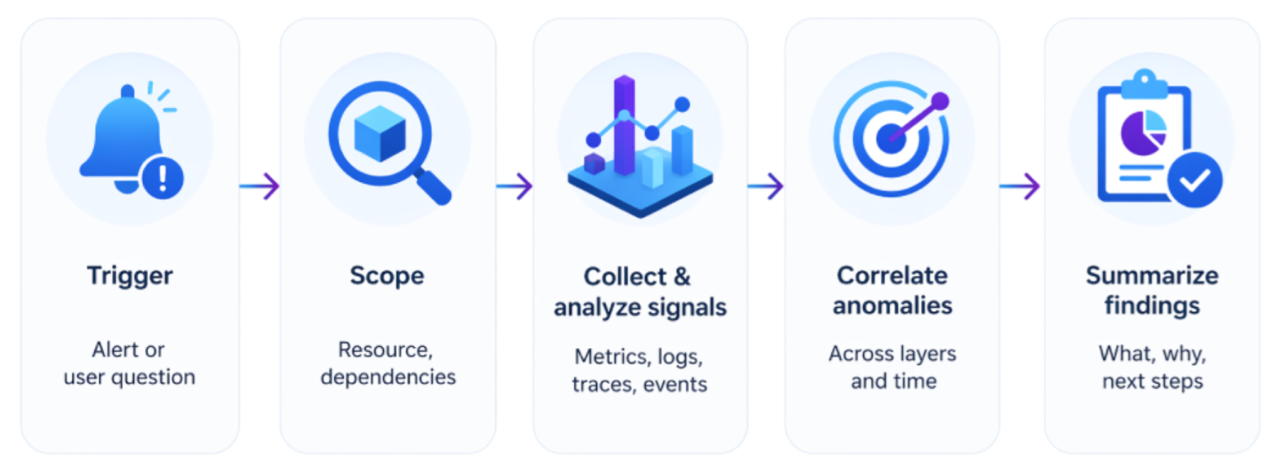
The following diagram shows the deep investigation at a glance. The Collect & analyze signals box covers both data collection and anomaly detection from the detailed table, and resource-specific deep diagnostics run as part of Correlate anomalies.
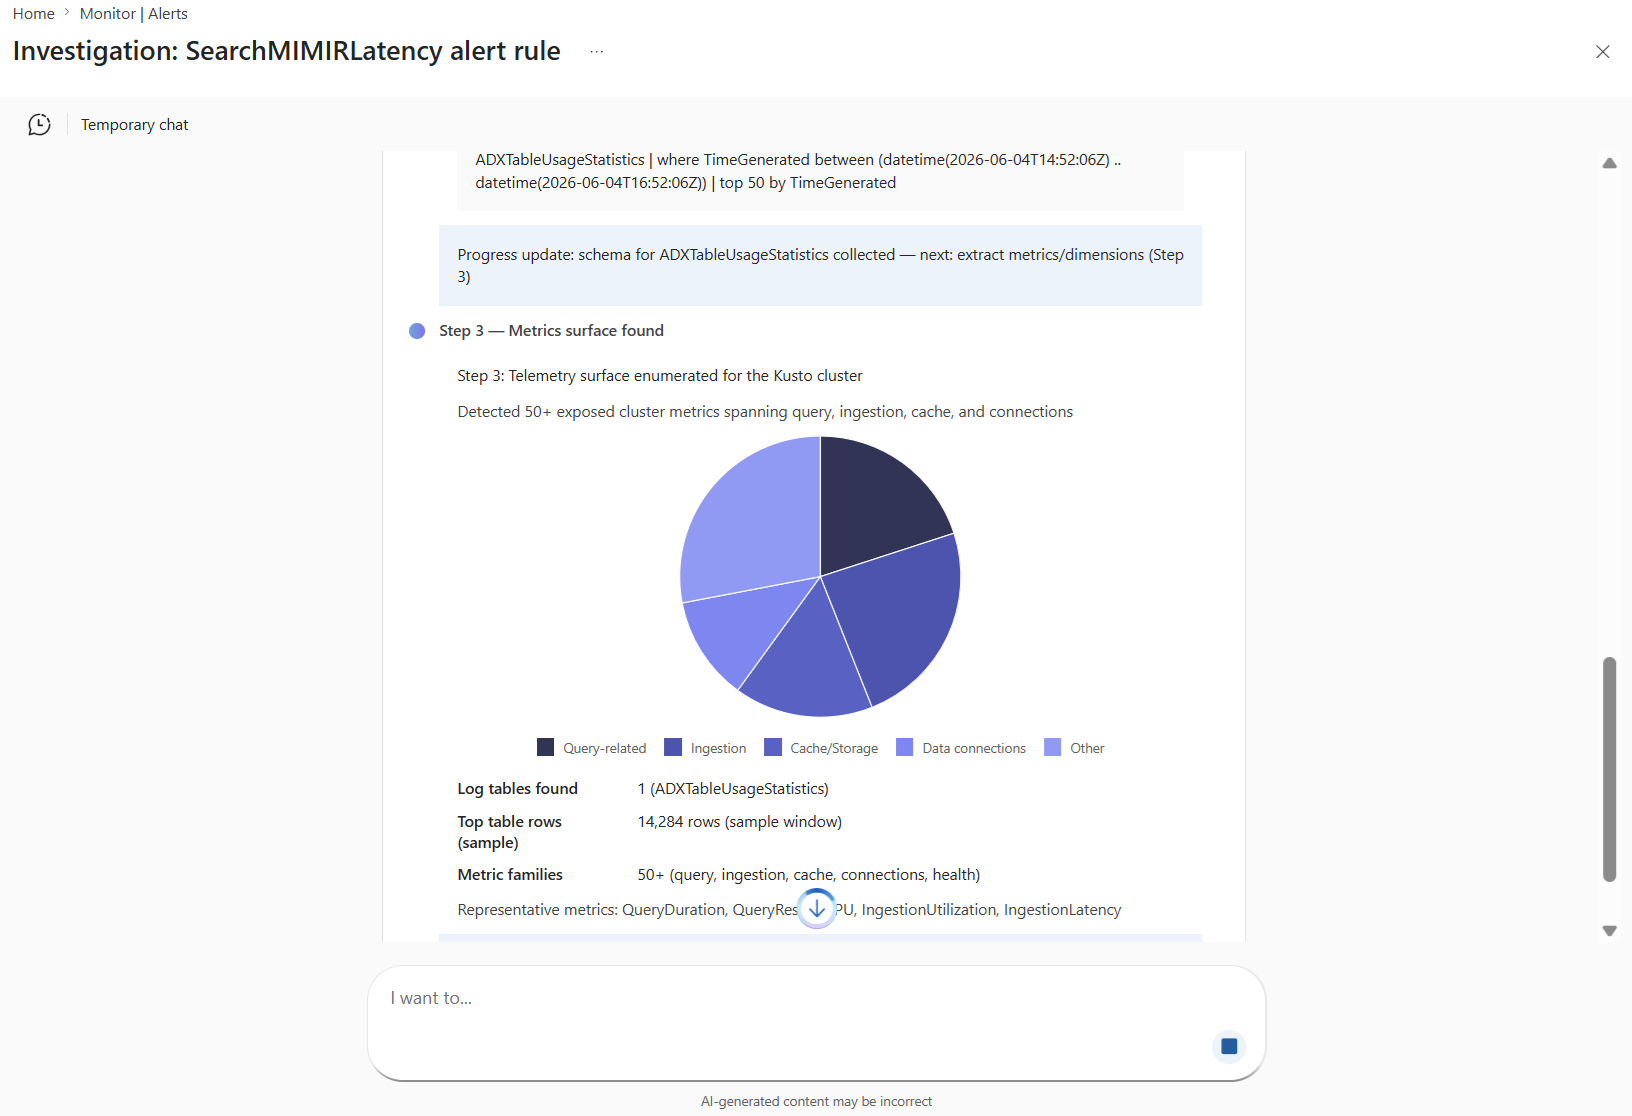
As the investigation progresses, the agent streams its findings in real time.
How the agent reasons through an incident
Deep investigations follow a practical control loop that mirrors how experienced responders work:
- Frame a hypothesis from the incident trigger and scope.
- Collect and correlate evidence across application, infrastructure, and platform signals.
- Test alternative explanations by checking whether signals align by time, scope, and type.
- Rule out weak hypotheses when supporting evidence is missing or inconsistent.
- Refine and summarize the most likely explanation with recommended next steps.
This loop is why investigation output includes both findings and hypotheses that were ruled out. It helps you audit the reasoning path, not just the final conclusion.
How the agent aligns signals by time, scope, and type
The agent aligns evidence along three axes so the final report ties cause to effect rather than listing every anomaly it found.
- Time — did the signal move with the incident? A CPU spike that started 20 minutes before the alert fired and matches its trajectory is correlated. A spike from the previous day isn't.
- Scope — does the signal share resource, dependency, operation, or region with the incident? Latency on a dependency that the affected app calls is correlated. Latency on an unrelated app in the same region isn't.
- Type — does the signal match the symptom? Increased exception counts correlate with an error-rate alert. A slow disk doesn't, unless it's on the path of the failing request.
This three-axis alignment is what lets the agent rule out unrelated noise and present a short list of causally relevant evidence.
A deep investigation correlates evidence across multiple layers and resources, so root cause analysis isn't limited to a single resource or signal type. The agent treats alerts as supporting evidence, not as the root cause. The agent uses alerts to anchor the time window and the affected resources, then looks behind the alert to find what actually changed.
What the investigation report contains
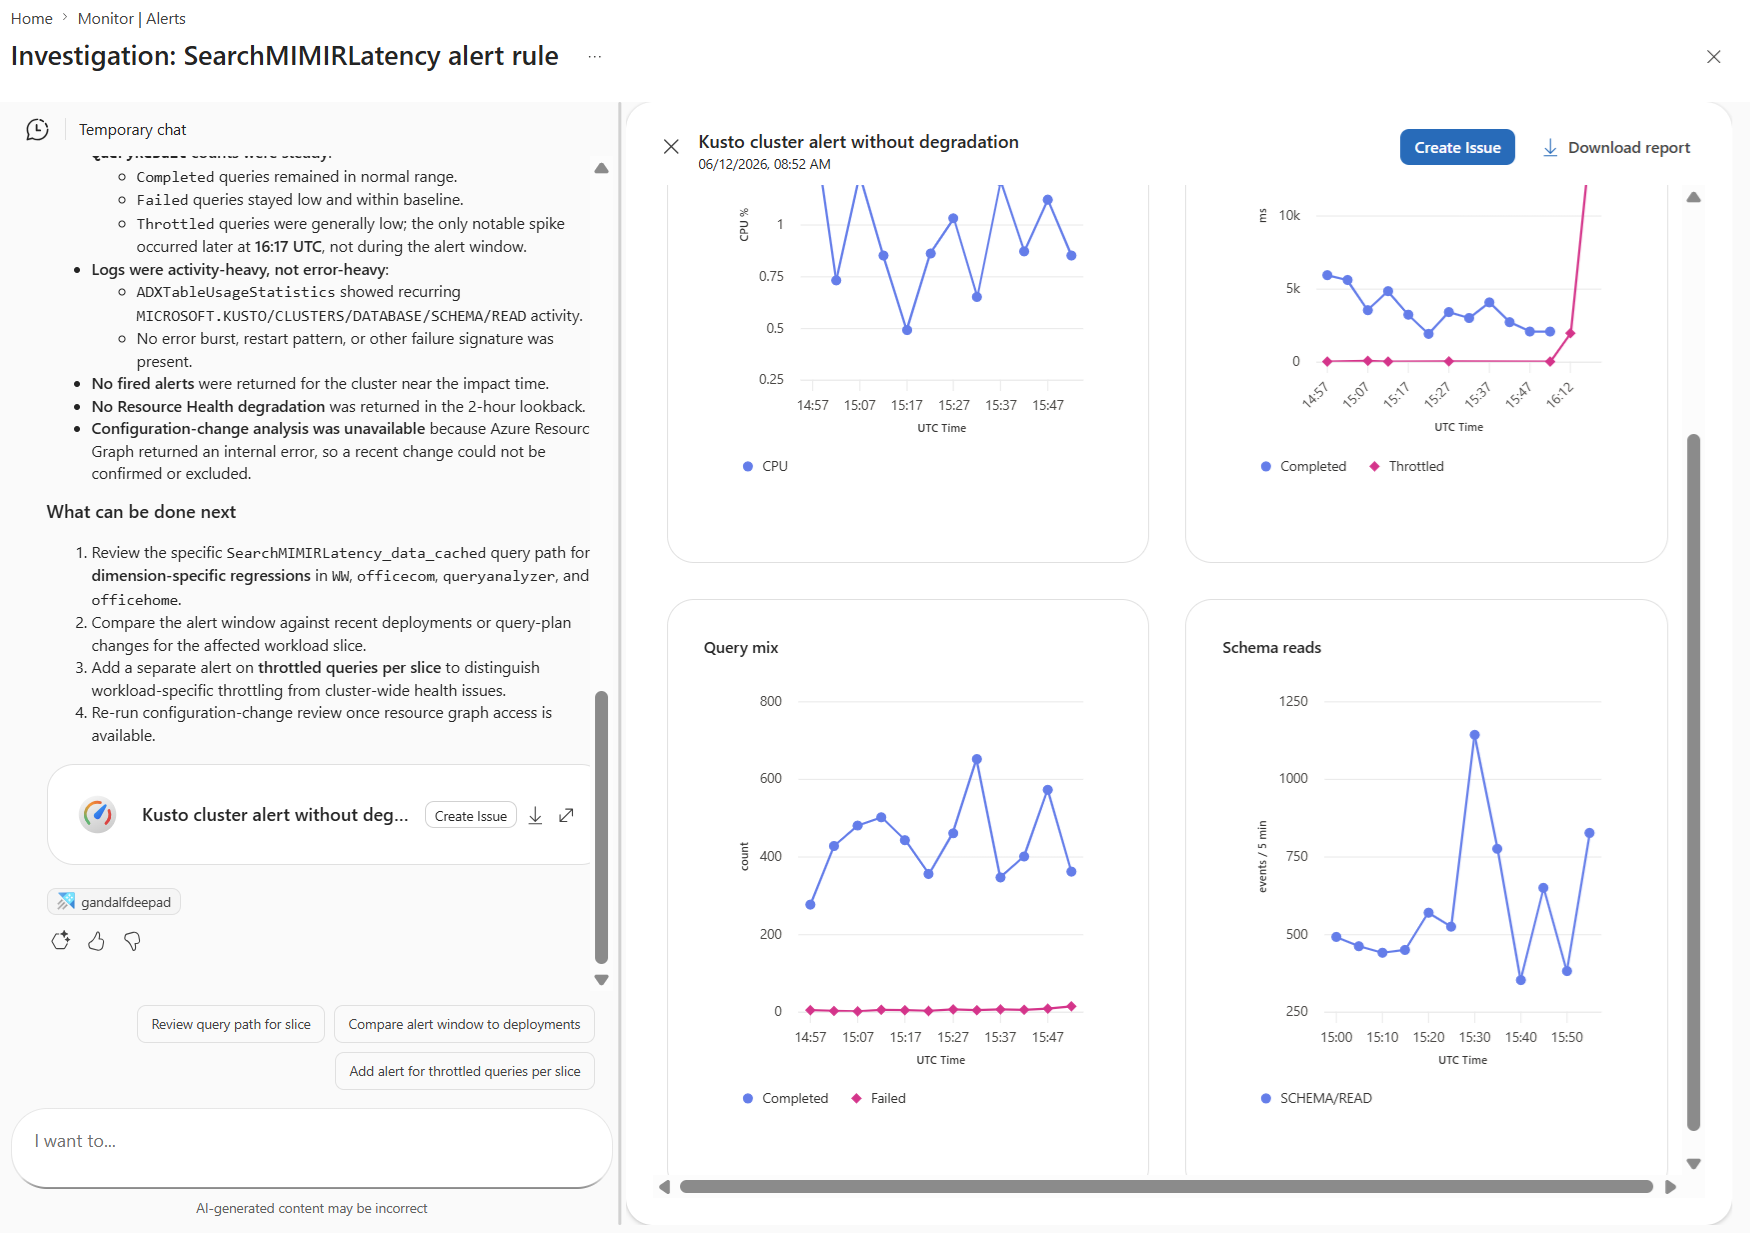
The investigation report answers the questions that an on-call engineer asks during an incident:
- Incident framing — what triggered the investigation, the time window, and the blast radius (which resources are affected).
- Affected components — application, infrastructure, and platform resources that show evidence of the problem.
- Hypotheses ruled out — alternative causes the agent considered and the evidence that ruled them out. This evidence makes the conclusion auditable.
- Mitigation steps — recommended actions to stabilize the system.
- Supporting data — links back into the metrics, logs, queries, and Activity Log entries the agent used.
- Live progress — the report streams while the investigation runs, so you can see findings as they're produced.
The following image shows an investigation report with the agent's findings and a list of recommended next steps.
Follow-up prompts that refine an investigation
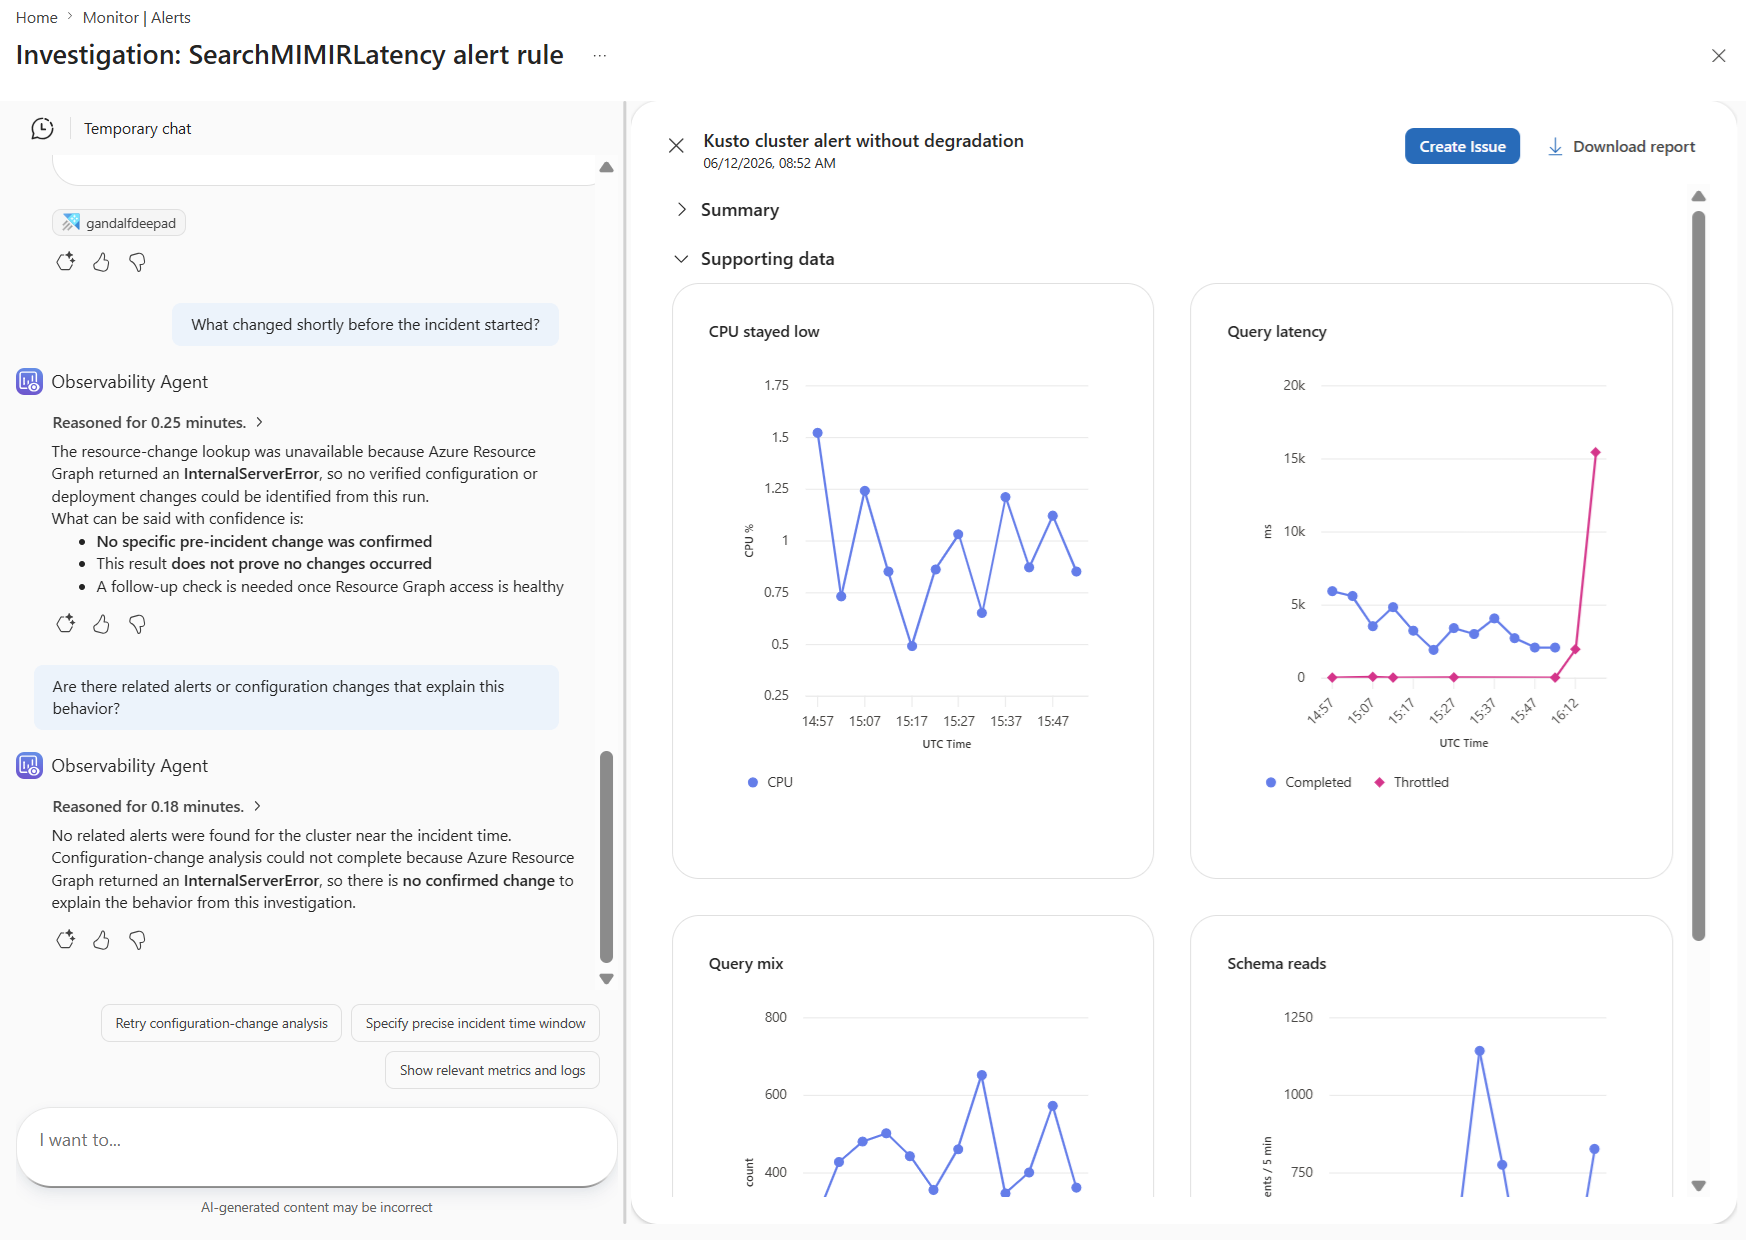
After the agent returns a report, ask follow-up questions to refine scope, test alternative hypotheses, or pivot to a related resource. The conversation keeps the investigation's context, so you don't restate the incident.
Useful follow-up prompts include:
- "What changed shortly before the incident started?"
- "Are there problems in VM
<vm-id>and are they related? If yes, run a deep investigation including this VM." - "Which dependencies are most correlated with this failure spike?"
- "Are there related alerts or configuration changes that explain this behavior?"
Here's an example where a user asked follow-up questions.
Save investigation results as an Azure Monitor issue
Investigation results are temporary. Save the investigation as an Azure Monitor issue to preserve the full context, including the report, the agent's reasoning, the supporting data, and the follow-up conversation. From the issue, you can resume the conversation later, share it with teammates, and continue analysis without losing context.
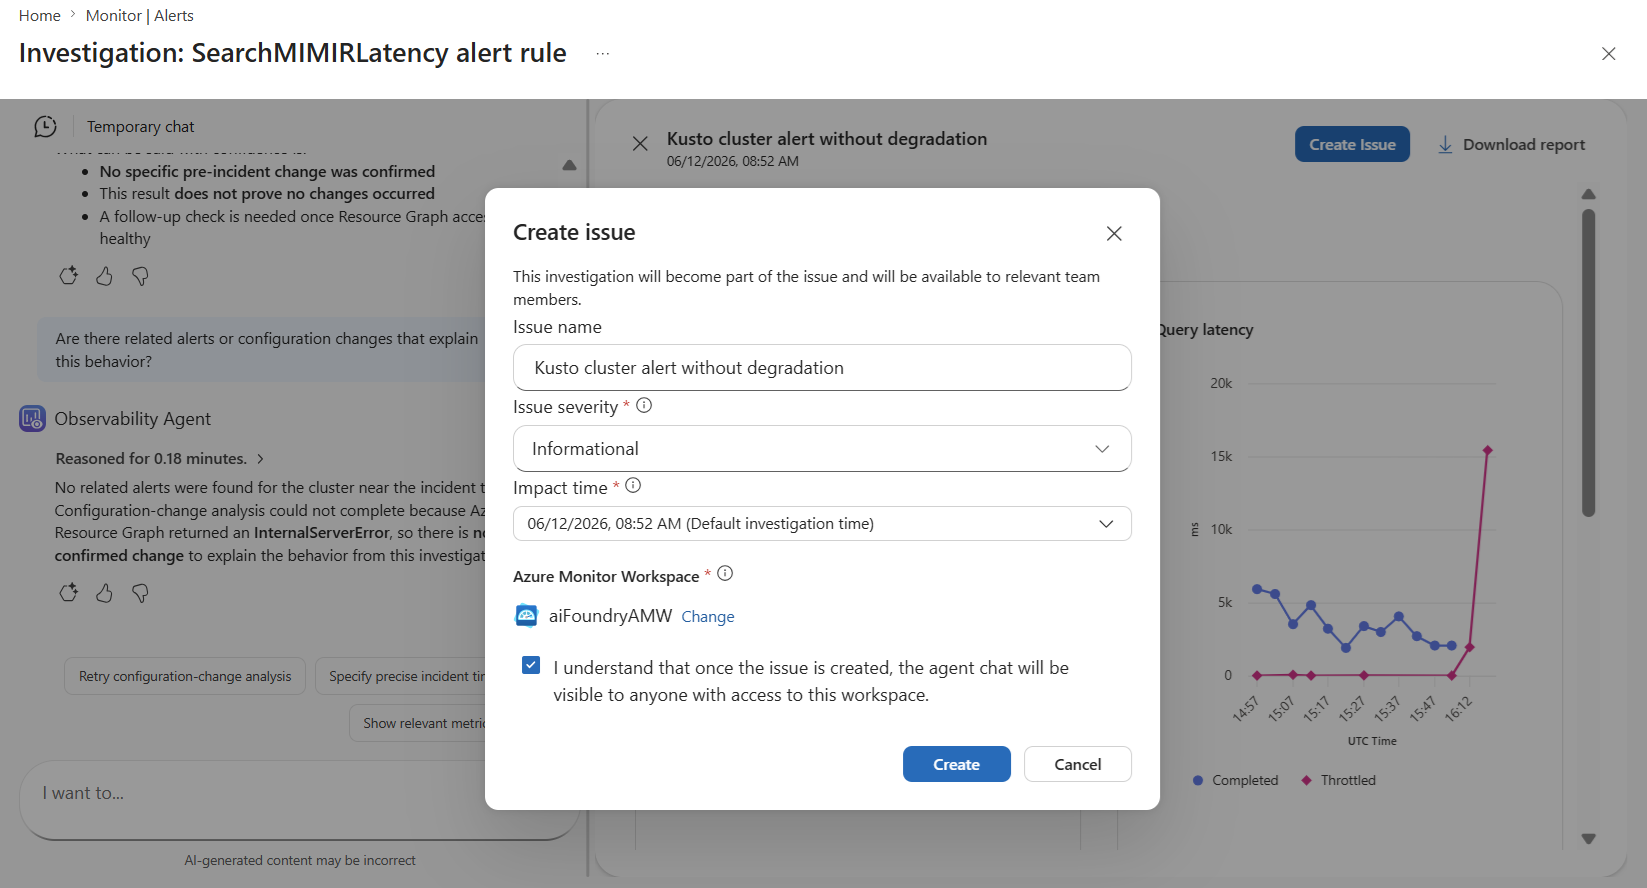
For more information about issues, see Azure Monitor issues and Use Azure Monitor issues.
Escalate from chat to a deep investigation
When chat exploration in the Logs page surfaces a deeper problem than ad-hoc questions can resolve, escalate to a full deep investigation without leaving the chat. The agent carries the chat context forward as the starting scope for the investigation.
For more information about the chat workflow, see Chat with your observability data.
How the agent explains its reasoning
The Observability Agent surfaces its reasoning as it works: which signals it considered, which queries it ran, and which Azure resources it accessed. This transparency lets you verify the agent's conclusions, learn the patterns it uses, and catch cases where the available signals don't support the suggested next step.
For details about what's logged, how reasoning is presented, and how to audit agent actions, see Transparency in the Azure Copilot Observability Agent.
Data retention, privacy, and responsible use
The service might retain investigation data for up to 30 days to support investigations and user interactions. Microsoft doesn't use prompts or agent responses to train or improve the underlying AI models.
For transparency and reliability expectations, see Transparency FAQ for Azure Copilot Observability Agent. For governance, privacy, and compliance details, see Data, privacy, and governance FAQ for Azure Copilot Observability Agent.
Regions and current limitations
Deep investigations are available in the same Azure regions as the Observability Agent itself. For the current region list, see Regions in the overview. For known limitations and troubleshooting, see Troubleshoot the Azure Copilot Observability Agent.
What's next: autonomous operations
In addition to the user-initiated deep investigations described in this article, the Observability Agent can run deep investigations automatically against agent-created issues, without a user prompt. Autonomous operations is in public preview at launch, is on by default with opt-out, and billing for autonomous deep investigations started July 1, 2026.
For setup, opt-out, custom instructions, role-based access control, and the billing details specific to autonomous operations, see Autonomous operations in the Azure Copilot Observability Agent.
Related content
- Azure Copilot Observability Agent overview
- Chat with your observability data
- Deep investigation examples in the Azure Copilot Observability Agent
- Transparency in the Azure Copilot Observability Agent
- Autonomous operations in the Azure Copilot Observability Agent
- Azure Monitor issues overview
- Best practices for the Azure Copilot Observability Agent
- Billing and cost management for Observability Agent in Azure Monitor