Azure APIM : Latency measurement using Azure Monitor time entry logs

Amit-J 341 Reputation points
2022-10-31T14:16:40.253+00:00

Hi,

We are sending APIM logs to external party (datadog) via Diagnostic Settings in APIM portal.
We want to calculate the latency induced by APIM and differentiate the time taken by -

  1. api gateway
  2. backend call
  3. client time

But, in datadog, we see only 3 values related to time -

  1. durationMs
  2. backendtime
  3. clienttime

The confusion is regarding the value of durationMs because MS resource log schema doc talks about "Total Time" here - https://learn.microsoft.com/en-us/azure/api-management/gateway-log-schema-reference

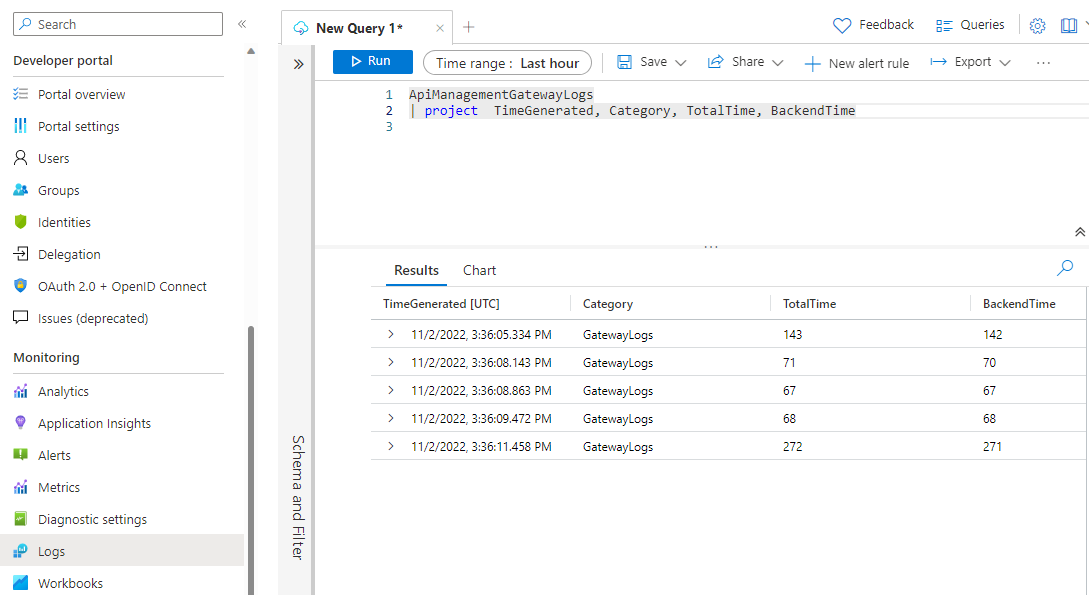
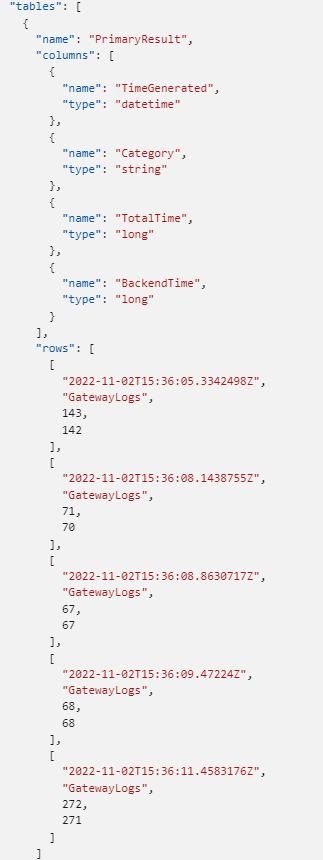
I am not getting Total Time in my logs and this is actually expected behaviour according to another MS docs line here - https://learn.microsoft.com/en-us/azure/api-management/api-management-howto-use-azure-monitor#view-diagnostic-data-in-azure-monitor

So, my question is how to calculate the api gateway time ? (Please resolved discrepancy in ms docs because it does not explain the meaning of durationMs in apim schema reference logs page)

Another weird observation is :
a lot of times durationMs is less than backendtime with "client time" missing from the logs (assuming its value is so less that it might be equal to 0)
and sometimes both are same with "client time" missing from the logs.
and sometimes durationMs = backendtime + clienttime
and sometime durationMs is more than backendtime but durationMs is less than backendtime + clientime

No logic is fitting here, other than rounding error by MS (if I may assume)

Please guide.

Azure Monitor
Azure Monitor
An Azure service that is used to collect, analyze, and act on telemetry data from Azure and on-premises environments.
3,364 questions
Azure API Management
An Azure service that provides a hybrid, multi-cloud management platform for APIs.
2,214 questions
{count} votes

2 answers

Sort by: Most helpful
  1. MuthuKumaranMurugaachari-MSFT 22,361 Reputation points
    2022-11-01T17:45:42.1+00:00

    @Amit-J Thank you for reaching out to Microsoft Q&A. I assume you have configured to send resource logs to Datadog as described here (and for API Management resource). GatewayLogs is supported log category for APIM resource and as you mentioned it follows API Management resource log schema along with top-level common schema emitted by Azure services. Top-level common schema has durationMs field which is not specific to APIM or related to Gateway time and see the description below:

    256128-image.png

    For your question on calculating APIM gateway time, you can calculate it using apimTime = totalTime - (backendTime + clientTime + cacheTime).

    You mentioned there are only 3 values related to time in datadog. I couldn't find docs describing schema resource logs in https://docs.datadoghq.com/integrations/azure_api_management/#data-collected. Have you already reached out to Datadog support as mentioned in docs: https://learn.microsoft.com/en-us/azure/partner-solutions/datadog/get-support#contact-support? Otherwise, I would recommend you reaching out to them for assistance.

    Feel free to add a comment if you have any other questions. We would be happy to assist you. Please 'Accept as answer' and ‘Upvote’ if it helped so that it can help others in the community.
  2. Ryan Hill 29,211 Reputation points Microsoft Employee
    2022-11-11T15:47:42.157+00:00

    Hi @Amit-J , I've been investigating this issue. I haven't received an ironclad answer yet, but what I'm hearing is that the GatewayLogs data is being transformed into the top-level schema used by Azure Diagnostics. I'm not familiar with the inner workings of Data Dog so I'm not sure what sources it can retrieve from i.e., pulling directly from APIM. As I get more information, I'll update my answer.


Your answer

Answers can be marked as Accepted Answers by the question author, which helps users to know the answer solved the author's problem.