Azure Monitor
An Azure service that is used to collect, analyze, and act on telemetry data from Azure and on-premises environments.
3,662 questions
This browser is no longer supported.
Upgrade to Microsoft Edge to take advantage of the latest features, security updates, and technical support.
' cx='32' cy='32' r='32' /%3E%3Ctext x='50%25' y='55%25' dominant-baseline='middle' text-anchor='middle' fill='%23FFF' %3ESH%3C/text%3E%3C/svg%3E)
I'm looking at Application Insights Auto-Instrumentation Support and would like to demo this for a prospective client.
Thanks
' cx='32' cy='32' r='32' /%3E%3Ctext x='50%25' y='55%25' dominant-baseline='middle' text-anchor='middle' fill='%23FFF' %3EAM%3C/text%3E%3C/svg%3E)
Hi @Siegfried Heintze ,
Please find below the response your queries:
1. Application Insights Auto-Instrumentation is a way to enable ApplicationInsights tracing in your application without requiring code changes.. For the console application, Auto Instrumentation is not available, as there are some code changes required in console application for it to be able to send telemetry to ApplicationInsights. For example, in the code snippet available in Application Insights for .NET console applications, it would require adding some lines in the code itself - for example the following snippets:
TelemetryConfiguration configuration = TelemetryConfiguration.CreateDefault();
configuration.ConnectionString = "removed";
configuration.TelemetryInitializers.Add(new HttpDependenciesParsingTelemetryInitializer());
var telemetryClient = new TelemetryClient(configuration);
You can still use "Application Insights" to monitor .NET console applications, as mentioned in the article, but it cannot be enabled using "Auto Instrumentation".
The dependency related information (in the example, related to HttpClient), it will be available in "dependencies" table of ApplicationInsights. Please see this link for list of tables available and the data they contain.
2. No, "Auto-Instrumentaion" only means a way to enable Application Insights without requiring any code changes. The other way of enabling ApplicationInsights is by using the SDK directly, which requires creating instance of AppInsights classes and calling its method (as seen in the console application example).
3.
If you would like to demonstrate Auto-Instrumentation, you would have to use one of the supported frameworks and languages, as available in this link. You could follow the link below which contains complete training with documentation required to learn this feature. This training path also contains details about viewing some of the commonly collected information in Azure portal through various visualization tools available.
Capture and view page load times in your Azure web app with Application Insights
4.
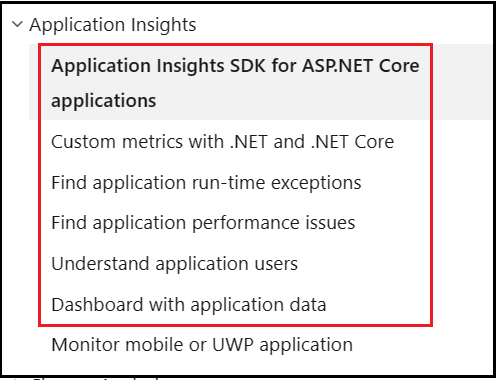
The data collected by ApplicationInsights can be viewed from various views/dashboards available in "Applicaiton Insights" or by querying the logs directly. Please follow the tutorial set available here - Application Insights tutorials. Various sections are available, as highlighted below and each contains details about the various ways to view data for a typical scenario.
Alternatively, you could query raw data from various tables directly by using the Kusto Query Language in "Logs" of ApplicationInsights resource. Tha available tables are listed here - Table structure
5.
Enabling ApplicationInsights for Java application follows a different path. Here, you download a jar file (applicationinsights-agent-XX.jar) and provide its path as parameter to JVM using -javaagent: parameter. Please see the following link for more details - Azure Monitor OpenTelemetry-based auto-instrumentation for Java applications
6.
GitHub codespaces is a developer environment in the cloud that starts in seconds. It is similar to having your own machine with required tools (VS Code, Jupyter, or JetBrains) installed. If you are only interested in trying out ApplicationInsights, you don't need codespace or a VM in Azure. You can use your own machine (laptop, desktop or notebook) with VS code/Visual studio etc. on it, to develop application, run it locally and send telemetry to ApplicationInsights to view result.
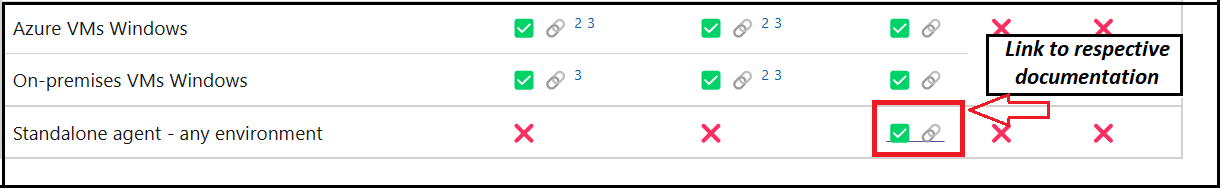
The Supported environments, languages, and resource providers table also mentioned links to respective tutorial/steps which can be used to configure that particular option. For example, see the following image -
7.
Yes, you could do that. Or you could simply enable applicationInsights in your application from the IDE that you are using, run it locally and view collected data in ApplicationInsights in Azure Portal. For data to flow from application to ApplicationInsights, the application need not be published to Azure. Please see this link for details - Application Insights for ASP.NET Core applications
This would work for blazer server as well or any type of Asp.Net Core application.
You could also explore the following link, which contains advance usage scenarios - Application Insights API for custom events and metrics
To check whether data is being received by ApplicationInsights, you can use either of the following:
union * I hope the information above helps. Please let me know if you have any questions.
---
Please 'Accept as answer' if it helped so that it can help others in the community looking for help on similar topics.
I
Please elaborate on 6 & 7:
Yes, you could do that. Or you could simply enable applicationInsights in your application from the IDE that you are using, run it locally and view collected data in ApplicationInsights in Azure Portal.
I'm confused. Is running a sample C# razor/blazorserver webapp (console is not allowed, I believe you explained above) locally on windows one of the development environments listed in table of supported environments? The closest option I see for C# development is on-prem VMs for windows and I believe that would require me to buy another license for windows so I could create a windows VM... Is this correct? Linux VMs are no problem ... especially with WSL in Windows 11 but I don't see that listed.
@Siegfried Heintze , thank you for the reply. There are 2 separate topics in discussion here :-
1. Hosting environment - A machine (like Windows/Linux desktop/server) OR a Platform as a Service (like Azure Web Apps). A hosting environment is where you will host your application and run it.
Depending on the type of Application and your requirement, this will vary. For Web Application (like ASP.NET Core based), you can host it in Azure Web Apps OR on a machine that you have (Windows/Linux). A console application will typically run on a computer (it could be physical machine, virtual machine or even virtual machine in the cloud like Azure VM).
The table referred in the replies above does not talk about the supported hosting environment.
---
(1/3)
2. Monitoring using Application Insights - Application Insights lets you monitor the performance of your application (that you write), collect telemetry and helps you analyze & visualize them. Once you have written your application, you can enable ApplicationInsights for it (so that the telemetry from your application can be sent to Application Insights Workspace in Azure). To enable Application insights, you have 2 options
---
(2/3)
@Siegfried Heintze , Since you mentioned that you were trying to demo AppInsights feature, I recommended that you could simply enable ApplicationInsights for your application using IDE of your choice and when you run it on your dev machine (for example using F5 button in Visual Studio) for test, the application would send telemetry to AppInsights workspace for that duration and you could see the data in ApplicationInsights in Azure. This method would not require you to actually host the application anywhere.
If you are looking for full demo of ApplicationInsight's auto-instrumentation feature, you could follow the information as available in the table here. For example, if you are interested to enable ApplicationInsights for your Asp.Net Core razor/blazor application, you can host this application in any of the "Application Insight's auto-instrumentation" supported Hosting Environment like Azure App Service on Windows, Azure App Service on Linux, On-premises VMs Windows etc.
After that, you could follow the steps in respective link to enable AppInsights using "Auto-Instrumentation" method.
Hope this helps. Please let me know if you have any questions.
---
(3/3)
Please 'Accept as answer' if it helped so that it can help others in the community looking for help on similar topics.
@Siegfried Heintze , I wanted to check if you had a chance to review my answer above. Please let me know if you have any questions.
Please 'Accept as answer' if it helped so that it can help others in the community looking for help on similar topics.
orry for the delay...
OK, I'm running my Blazer server Web app Locally and Visual Studio prompted me for Application Insights configuration and I selected a new application insight in my resource group on azure. It looks like visual studio instrumented my code.
Here is the source code : Index.razor
I'm a little overwhelmed at the fancy GUI in the portal for the workbooks and logs (with the kusto query editor)... Please guide me in making some queries show off the auto instrumentation feature.
I've tried a few Kusto queries and I don't see anything.
FYI: I'm having some trouble deploying Application Insights (via bicep) to the App Service: see my post in github.
I'm thinking it should still work locally, however. Please recommend some kusto queries for me to try to see the auto instrumentation feature work. Maybe I don't have enough C# source code? What C# source code might I add?
While I am waiting for a response from the github forum regarding bicep, I might try to deploy application insights again via the portal, store the application insights connection string in a web app setting and see if I can make it work again (if bicep would not hang, it would be a lot easier!).
@Siegfried Heintze , thank you for the reply. In "Application Insights" --> Logs, you can run the query below after setting the time range. The query will give you a union of all data in all tables in the ApplicationInsights workspace. You can see the itemType column in the result to know the name of table from which that particular row is pulled.
union *
For this to work, you may have to run the application in Visual Studio for a couple of minutes and interact with it (click on links, use some features for the application to generate some telemetry data which can be sent to ApplicationInsights workspace).
Please note, this method sends data to appinsights workspace, but is not an example of "Auto-instrumentation". Because, by enabling the ApplicationInsights through VS, it adds some lines in the "program.cs" file. As mentioned above, if you are really interested in the "auto-instrumentation" (which is a way to enable ApplicationInsights on your application), you would have to deploy the application to a supported HostingEnvironnment and enable ApplicationInsights for it. The details are available in the table - https://learn.microsoft.com/en-us/azure/azure-monitor/app/codeless-overview#supported-environments-languages-and-resource-providers
I'm following all of your guidance:
@Siegfried Heintze - Based on my understanding, I see that you are getting results after running the query "union *" - please correct me if I missed something.
If you are getting data in ApplicationInsights, it means that your application is instrumented.
Please note that you have to enable Applicationinsights on your application only once
If both of the above methods were used to enable AppInsights, the SDK method take precedence.
Can you please explain "Auto instrumentation does not seem to be working." - why do you think so?
I don't believe I'm seeing the auto-instrumentation feature in action because
Please guide me in making a change to my source code (like adding a new function and executing it with my push button) that would appear in the kusto query that is a result of automated parsing of my source code (in contrast to me manually adding log statements or performance counters to my source code).
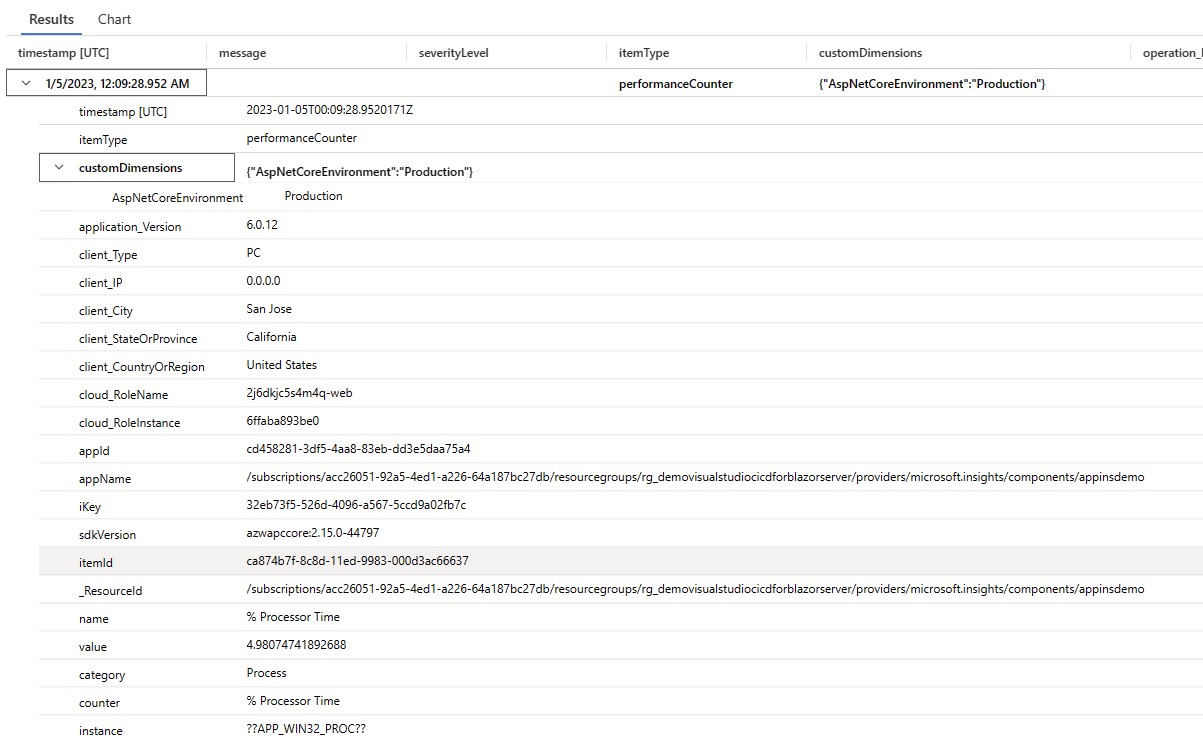
Here is the performance counter I'm seeing this morning and it looks very similar to what I was seeing last night.
I noticed this in the logs:
2023-01-06T22:49:41 PID[13760] Information 01-06 22:49:41 Critical: Profiler is not supported on Dynamic, Free or Shared sites. Please upgrade your site to Basic or above.
Ah hah! I thought! I'll just upgrade my app service plan to Basic!
Ah shucks! This did not help!
My expectation is that I could take a large existing C# web app and use the auto-instrumentation feature to see what is going on without have to add any log statements. Is this how auto-instrumentation works? If so, how is it different from the Profiler? Perhaps the Profiler and the auto-instrumentation are the same? If not, what is the difference?
My experience with profilers is that they give you nice little bar graphs of which lines of source code are consuming how much CPU. I'm thinking the auto-instrumentation feature to be like a coverage analyzer which tells you which lines of source code had been executed but (unlike a profiler) don't tell you how much CPU they consume.
Thanks
Siegfried
@Siegfried Heintze , thank you for the detailed reply. Yes, profiler and auto-instrumentation are 2 different things:-
Profiler - helps you trace the code execution and figure out the time spent in particular methods/stack. This is supposed to be used only for debugging purposes and should not be enabled perpetually. Auto-instrumentation - is a way to enable "Application Insights". This means - without making changes to your code, some of the basic telemetry data (enabled by default and seemingly useful for a majority use case) is auto-enabled for the application.
Due to the nature of these queries, for a faster resolution I feel that dedicated 1:1 support will best suit your needs to help troubleshoot and answer your questions related to your app deployment and application Insights enablement. I request you to please Submit a Support Ticket, so that one of our support engineers can connect with you through your preferred mode of contact and help you. For more details, please see Azure support.
Thanks for your help so far. I believe I am running an application in an environment where I meet the requirements of auto-instrumentation.
And we are in agreement that auto-instrumentation means that I should not have to make changes to my code! As I explained, the only thing I am seeing with the kusto query is a change to my code (log statement) and a performance counter.
Have you been able to make the auto-instrumentation feature work without adding log statements and performance counters to your code?
Let me add some more application code and see if I see anything thing more. Unfortunately, due to the erratic nature of my schedule, now would not be a good time to open up a support ticket and it might be a while until I can add more application code.
I also need some time to study kusto queries...
I wish there was an example in the azure samples in github somewhere I could clone and run!
Would it make more sense to close this and open a new query in a month or so when I have time to work on this?
Siegfried
' cx='32' cy='32' r='32' /%3E%3Ctext x='50%25' y='55%25' dominant-baseline='middle' text-anchor='middle' fill='%23FFF' %3ESO%3C/text%3E%3C/svg%3E)
I wanted to check if you had a chance to review my answer above. Please let me know if you have any questions.