Azure Data Factory
An Azure service for ingesting, preparing, and transforming data at scale.
This browser is no longer supported.
Upgrade to Microsoft Edge to take advantage of the latest features, security updates, and technical support.
' cx='32' cy='32' r='32' /%3E%3Ctext x='50%25' y='55%25' dominant-baseline='middle' text-anchor='middle' fill='%23FFF' %3EDB%3C/text%3E%3C/svg%3E)
For very basic activities (eg lookup) I'm finding large differences in performance between one execution of a pipeline and the next.
For example the following sometimes runs in 3 seconds and other times runs in 20 seconds.
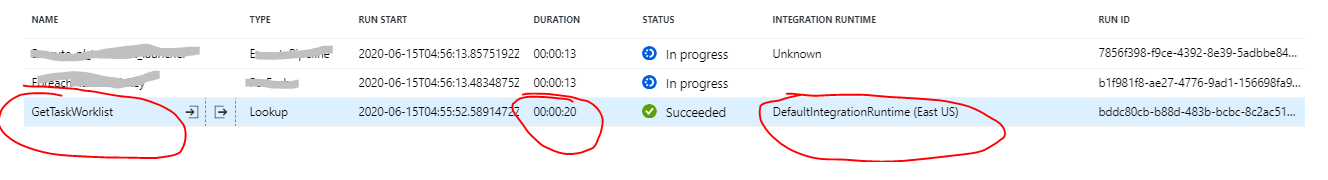
What can I do to investigate these types of performance inconsistencies? In this case the lookup is running a stored procedure in an azure-hosted sql database via the "AutoResolveIntegrationRuntime". When I monitor xevents in the database, the query executes instantaneously. The performance problems must be happening in ADF or in the integration runtime itself (autoresolve runtime).
Essentially I'm asking where I get profiling information. Preferrably this type of profiling would be available both in the real ADF environment and in the debug environment.
Side question. Is the "auto resolve integration runtime" shared with lots of other customers? Is there a chance that my stuff is getting queued up behind a dozen other customers in the US east region? If so , then is there a way to monitor how busy that integration runtime is at any given moment? Is there a service tier where I don't share my "auto resolve" with other customers?
I still don't have a formal document that says so, but Microsoft engineers are standing by their undocumented "SLA" that says any interaction with a stored procedure in SQL may take up to four minutes. This includes an Azure SQL resource in the same azure region.
So, if a stored procedure should execute in 1 second, the ADF IR is reasonably permitted to spend an extra 4 minutes going to sleep, or doing whatever else it feels like doing. In practice I've noticed that the IR can often spend an additional 10 or 20 seconds doing nothing at all. Microsoft claims there are no configuration options (even in the self-hosted IR) to adjust that time that is being wasted.
If you see an IR going to sleep for longer than 4 minutes per activity, then that justifies opening a support ticket to troubleshoot performance.
Here is the complete response from the support engineer (Tyler, Big Data Support Engineer):
As stated from the Product Team, any stored procedure activity that performs within 4 minutes has met SLA within ADF--this SLA covers the overhead of ADF communicating with SQL server. With that said, your current performance within ADF is normal.
Here is the four minute SLA for all activity runs!
https://azure.microsoft.com/en-gb/support/legal/sla/data-factory/v1_2/
' cx='32' cy='32' r='32' /%3E%3Ctext x='50%25' y='55%25' dominant-baseline='middle' text-anchor='middle' fill='%23FFF' %3ECM%3C/text%3E%3C/svg%3E)
To answer your question, no, each Azure Data Factory has a dedicated Azure IR assigned. 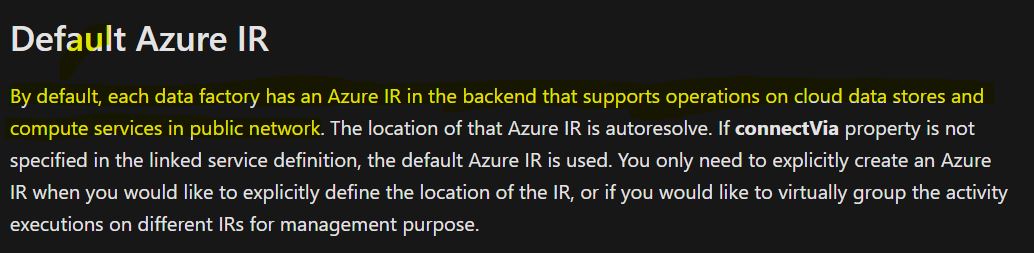
You can monitor your Integration Runtime to get a bunch of properties as well as the status of your IR :
Monitoring Integration Runtime in ADF
Hope this helps.
I'm wrapping up a support case with Microsoft related to the performance of ADF. To be more specific , this is related to the performance of a sequence of interactions with Azure SQL. We find that ADF introduces a ton of overhead when performing a sequence of activities. For example, 100 individual activities could add ~10-15 mins of unexpected overhead. The additional delays are taking place within the internal workings of the ADF IR.
In my phone call with Microsoft, it was explained that the overhead in the ADF IR is typically attributed to "task pickup time". The architecture consists of an asynchronous queue that needs to be polled in order for the IR to pick up each individual task.
Unfortunately for a large pipeline, this "task pickup time" can be a substantial percentage of the overall execution. In the example given by @MartinJaffer-MSFT
above, the task pickup time added 10 mins on top of the "real" work - that was only supposed to take one second.
Ideally there would be a way to configure/tune the "task pickup time" - especially for an on-prem self-hosted IR. However Microsoft said there is no supported mechanism for configuring the IR (either on -prem or in azure).
Barring the ability to configure/tune the IR, it would be nice if ADF would at least give us some additional visibility or metrics. ADF should indicate how much of the overall time is spent on "task pickup". If a pipeline takes an extremely long time, customers should be able to determine whether the problem is in their own code, or if the problem is an unavoidable consequence of using ADF.
As it turns out, there is supposedly an "SLA" for ADF when it interacts with SQL. I still have to find a formal reference for this, but I'm told that ADF is supposed to be allowed to contribute an additional four minutes of its own overhead! Ie. according to the SLA, it’s acceptable for ADF to introduce up to four minutes of its own overhead, for a every interaction with SQL - even when a stored proc can be otherwise executed in one second. To me that seems like an extremely lenient SLA and, if it came to that, I'm sure most customers would be very unhappy with a four minute delay for each SQL activity. Even a 5 second delay for every nested pipeline can be a problem, when it accumulates within a sequence of other activities.
Thanks for your response. I had looked in the azure portal and I believe that I found visuals for everything that was mentioned in that powershell interface you pointed me to. (The CPU visual was a bit hard to find. I think it is what you see in the azure portal outside of the authoring interface).
I guess the follow-up question is whether the dedicated Azure IR is running on dedicated compute (perhaps a dedicated VM)? If it is not on dedicated compute then it may as well be a shared IR.
How do you recommend that I dig into the reason for a 20 second activity on an ADF IR? The azure SQL server xevents indicate that only 10 ms of that was spent interacting with SQL! Is there a way to get profiling information? When this runs on -prem (self-hosted) there are log files and application log messages in the event log. I'm not sure how to find the corresponding information for the "auto-resolve" version of the ADR IR.
Was wondering if you would provide any further clues regarding our performance issues in ADF. We are using ADF for lots of small activities that should execute with sub-second responses. But for some unexplained reason we are watching some of them sit in queue for very long periods of time. Sometimes a sub-second SQL activity will sit in the runtime for a much longer period of time than we care to wait (eg. ~20 seconds instead of ~1 second).
This is fine if a given pipeline was just doing one or two activities, but in many cases we are doing one or two dozen activities. It may be that 12 1 seconds is a reasonable amount of time to wait for a pipeline ... but when that unexpectedly grows to 12 20 seconds then it becomes quite a problem, and can negatively impact developer productivity.
In order to continue troubleshooting, I am happy to run a self-hosted runtime if that would help to isolate the issue. I can dig into the event logs, or run process monitor, or even attach a debugger. It is clear from the event log that, in many cases, there are long and unnecessary delays during the execution of a pipeline activity. The delays seem to be self-imposed by the runtime service itself, and must be due to the way that its workload is queued up and executed. If there were some config value to adjust a polling interval, or some other type of governor, then I'd really like to hear about it. I haven't been able to find anything like that yet on my own...
The problem is quite reproducible. You just need to create a sequence of activities that interact with SQL for a simple request (eg. a sproc that takes ~10 ms or less). If you stack up a lot of these ADF activities in sequence you will see that they execute in an unpredictable amount of time that ranges from one to twenty seconds apiece. This is reproducible both in a self-hosted runtime and in an azure-hosted runtimes.
Is it possible that there was a recent regression in the runtime that is causing it to perform worse than in the past? When we first start building these pipelines they seemed to run faster. Any help would be very much appreciated. It would enhance my productivity if I could repeatedly run these pipelines without spending so much time waiting for them to finish.
Hi @David Beavon ,
Firstly, sorry for the delay in my response. If it's possible for you, can you run the same pipeline on a Self-Hosted IR to do a quick comparison that can help us narrow down to the exact issue?
Hi @DavidBeavon-2754 ,
Was your issue resolved? Do you still need asisstance?
We are rebuilding our ADF, with a new auto-resolve runtime in azure.
Can you set expectations, or give me your own understanding of how well things should perform? I'm not an ADF expert, and still relying on consultants to build this part of our solution.
From your own experience, what would be the performance of a loop of the same repeated activity in ADF. If the activity ran a stored procedure against an azure database and the stored procedure only took ~10 ms and the ADF activity was run 100 times in the loop then how long should it take for ADF to do this? Have you tried?
My experience is that the best (and normal) case is that each activity will take about 1 second because of overhead in ADF itself. And some iterations within that same loop will take up to 20 seconds for inexplicable reasons. So a loop of ADF that runs 100 times and does 10 ms of "real" work on each iteration may actually take a couple minutes (rather than 1 second).
Can you confirm?
Tried to post earlier but could not. How long would you expect it to take to run 100 activities in a loop, provided that each one interacts with SQL for ~10 ms?
I've seen overhead of at least 1 second apiece for activities, plus there can be occasional unexpected delays of up to 20 seconds. The entire loop of 100 activities might take many minutes, right?
I can open a support case to get to the bottom of this. It is odd that I don't find more discussion around this type of thing.
' cx='32' cy='32' r='32' /%3E%3Ctext x='50%25' y='55%25' dominant-baseline='middle' text-anchor='middle' fill='%23FFF' %3EMM%3C/text%3E%3C/svg%3E)
That matches my experiences, and seems about right.
@DavidBeavon-2754 I did a test run.
Given a stored procedure defined as
```
CREATE PROCEDURE wait010
AS
BEGIN
WAITFOR DELAY '00:00:00.010';
END
GO
```
and a sequential forEach loop iterating over @range(1,100)
I published and did a "trigger now" run.
The run took 9 minutes 54 seconds. The Gantt looks like

Thanks for working on that. 10 mins? Was this what you expected? Shouldn't that have taken 1 second or 100 second max? Should I open a support case?
I would have expected every iteration of the loop in ADF to take ~1 second or so. (ie. I would expect that each iteration would demonstrate the same fixed overhead performance penalty).
Based on your Gantt, it looks like there were inconsistent delays, and it appears that each iteration does not taken the same amount of time. If you run the entire repro again a few more times, will they all take ~10 mins or will they take a range of times (ie. unpredictable).
If the time in the SQL WAITFOR accounted for about 1 second of the total, then where is the rest of the 10 mins being spent?
If I open an Azure support case on my subscription, can we attach your current repro to it? Even if the ADF developers don't actually improve the performance, it would be helpful to understand what is happening, and learn how to investigate these unpredictable ADF performance delays.
Well, I can try asking. There are many factors in why it takes so long.
I am not a developer of the product, so I do not have complete knowledge of implementation, but here is what I suspect:
I think all activities are placed in a queue. As the queue gets checked as compute resources become available, they get taken. I think not all compute nodes are of the same quality. If some are slower in general, that increases duration of overhead and duration of execution, and duration of cleanup.
I'll share my gantt and ask.
I would appreciate it.
I suspected the same type of thing that you described. There is some async worker in the integration runtime that is polling for new work (rather than allowing clients to make their own synchronous requests on demand). The async nature of the worker allows it to be a lot more "lazy" than it should be.
I would also suspect that there are configuration settings that might be tweaked to tell the async worker to do more polling, more frequently... so that new work doesn't just sit around for ten minutes. I would guess that your reproducible could run up to 5x faster if the async workers weren't as "lazy" as they are right now.
There is probably a trade-off or compromise that would be made by tweaking configuration (ie. higher CPU or more network traffic). This is probably a compromise we would be willing to make in our development environment. Nobody wants to sit around for 10 mins, only to wait for 1 second's worth of real SQL activity!
If they do allow the tweaking of IR configuration, it probably would only be supported in the on-prem self-hosted integration runtime and not in the built-in "auto resolve" Azure integration runtime.
I'm happy to open a tech support case either way, if needed. There should be a KB or blog that tells us why 1 second of real work in a SQL procedure is taking an overall total duration of 10 minutes. It seems that ADF isn't a very efficient tool for running tight loops, and we should be able to find that type of information in the ADF documentation. I suspect other ADF developers might also spend a lot of time scratching their heads and wondering about these types of performance issues.
I really appreciate your help.
Sorry to bug you again.
Were you able to get any further on determining why there is the 10 minute overhead when interacting with SQL via 100 ADF activities? I suspect this mystery is one that a lot of ADF customers would love to solve.
Did anyone from the ADF team give you any feedback?
It would be nice to get some direction from them about how to troubleshoot this type of performance issue in ADF.
Please let me know. We've recently seen the delays grow from just seconds to minutes!!! That happens when we switch to the new version of IR that supports private vnets (an ADF feature that is in "preview").
If I don't hear back then I will open a support case, and post their response here. Ideally the performance characteristics of ADF would be a bit more consistent and easier to troubleshoot.
No, I didn't get any reply previously. I will try again.