I have a bar chart where my categories are in reverse order. When the value of one of the data points is 0, the label is placed to the right of the Y axis. I want the label on the left of the Y axis, as when it is placed on the right side, the data label
overlaps with the category name.
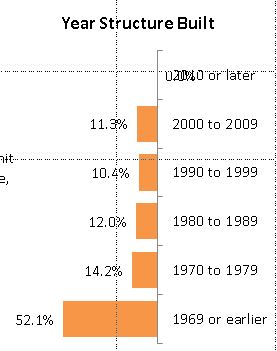
Below you can see that the first category of "2010 or later" has a value of 0.0%, which is labeled to the right of the Y axis.
Labels options are set to:
Label Contains: Value
Label position: Outside End
When the values are not in reverse order, the labeling works correctly, with the 0.0% data label to the right of the Y axis (along with all the other data labels).
I would like to keep the data label, but I do not want to reset the label position manually. I have over 200 documents, each containing 40+ charts, so manually reviewing each document and each chart is cumbersome.
I am open to a VBA solution.
Thank you.
' cx='32' cy='32' r='32' /%3E%3Ctext x='50%25' y='55%25' dominant-baseline='middle' text-anchor='middle' fill='%23FFF' %3EA%3C/text%3E%3C/svg%3E)