Hi Joshua,
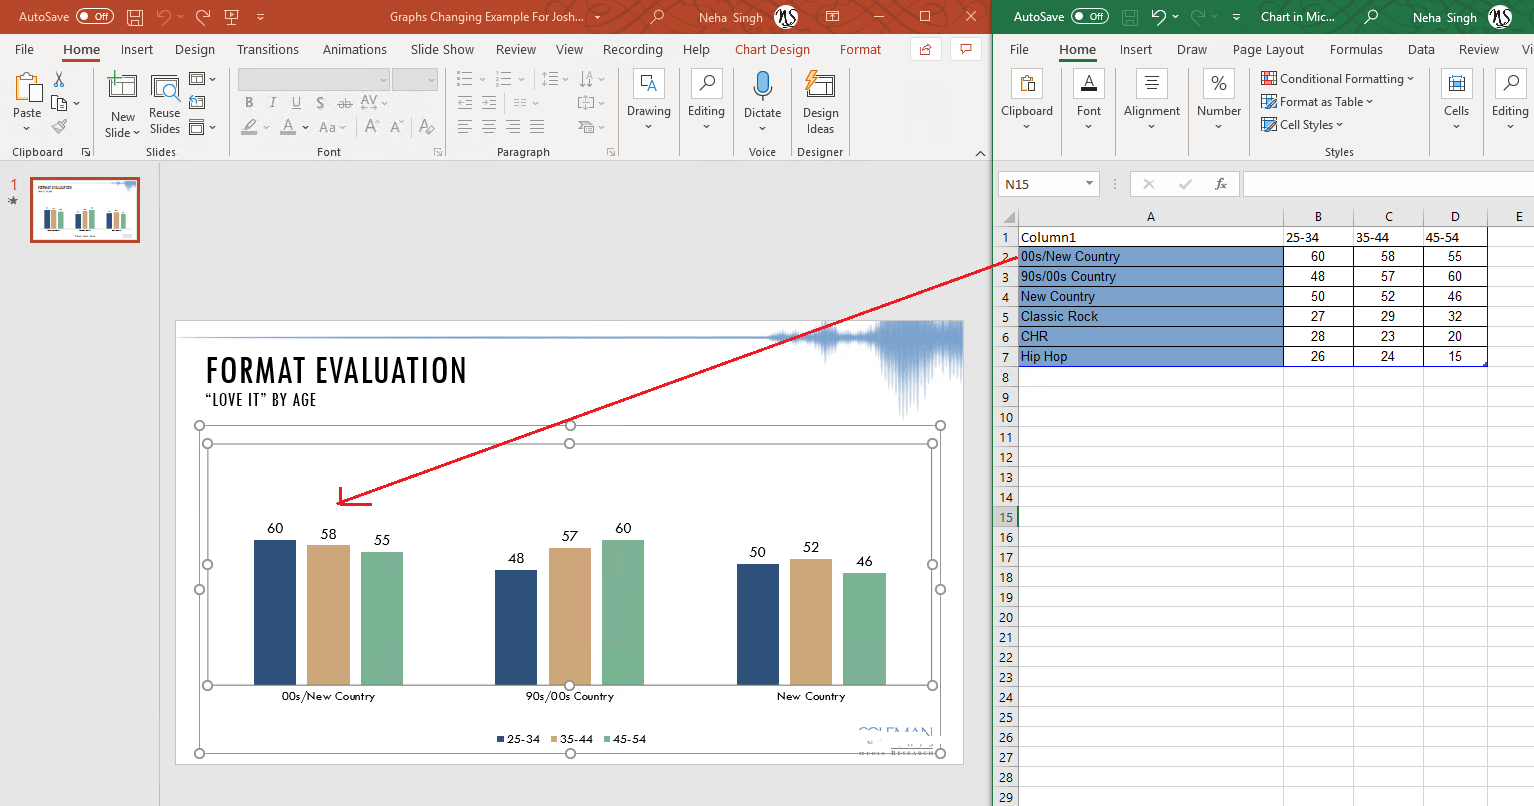
I downloaded your sample PowerPoint and when I opened, I could see the same data in PowerPoint that I see in Excel. For 00s/New Country, the data is 60,58, 55 in both PowerPoint chart and Excel.
Note*: I have removed the URL from your post to protect your privacy since it contains your tenant name and email id (personally identifiable information PII).*
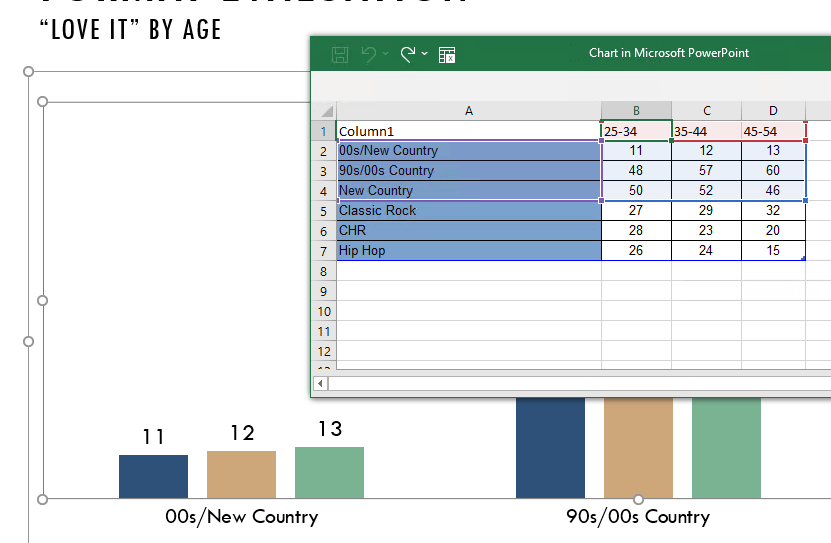
I even updated the values for 00s/New Country in Excel which reflected the chart in PowerPoint**,** saved the PPT and re-opened, I can still see the new values,
I would like to confirm the behavior I mentioned above is what you are expecting, If I misunderstood the case, please feel free to correct me.
If this is the case, for the test purpose please try saving the PowerPoint to your local computer and check if you experience the same behavior. This will help us confirm if the issue appears only when saving the file to network or local drive as well.
Besides, please ensure your Microsoft 365 apps are fully updated, sometime updating Office fixes issue. To check version information, open any Office app, such as Excel or Word, click File>Account, check for the info mentioned under Product Information. The latest version of Current channel is 2106 (Build 14131.20278). For other channel version info, see Update history for Microsoft 365 Apps (listed by date).
If the version is not updated as mentioned in the article, please install updates and check if the issue remains. To know how to install updates, see Install Office updates.
If the issue persists,****please provide us with the following information:
- Please provide the screenshot of Microsoft 365 Product Information. To get this screenshot, open Word or Excel on your system, click File>Account, capture the screenshot of all the information mentioned under Product Information.
- May I know whether you see this issue on network drive or local computer?
Regards,
Neha
' cx='32' cy='32' r='32' /%3E%3Ctext x='50%25' y='55%25' dominant-baseline='middle' text-anchor='middle' fill='%23FFF' %3EA%3C/text%3E%3C/svg%3E)