Note
Access to this page requires authorization. You can try signing in or changing directories.
Access to this page requires authorization. You can try changing directories.
APPLIES TO: All API Management tiers
You can easily integrate Azure Application Insights with Azure API Management. Azure Application Insights is an extensible service for web developers building and managing apps on multiple platforms. In this guide, you will:
- Walk through Application Insights integration into API Management.
- Learn strategies for reducing performance impact on your API Management service instance.
Note
In an API Management workspace, a workspace owner can independently integrate Application Insights and enable Application Insights logging for the workspace's APIs. The general guidance to integrate a workspace with Application Insights is similar to the guidance for an API Management instance; however, configuration is scoped to the workspace only. Currently, you must integrate Application Insights in a workspace by configuring a connection string (recommended) or an instrumentation key.
Warning
When using our self-hosted gateway, we do not guarantee all telemetry will be pushed to Azure Application Insights given it relies on Application Insights' in-memory buffering.
Prerequisites
You need an Azure API Management instance. Create one first.
To use Application Insights, create an instance of the Application Insights service. To create an instance using the Azure portal, see Workspace-based Application Insights resources.
Note
The Application Insights resource can be in a different subscription or even a different tenant than the API Management resource.
If you plan to configure managed identity credentials to use with Application Insights, complete the following steps:
Enable a system-assigned or user-assigned managed identity for API Management.
- If you enable a user-assigned managed identity, take note of the identity's Client ID.
Assign the identity the Monitoring Metrics Publisher role, scoped to the Application Insights resource. To assign the role, use the Azure portal or other Azure tools.
Scenario overview
The following are high level steps for this scenario.
First, create a connection between Application Insights and API Management
You can create a connection between Application Insights and your API Management using the Azure portal, the REST API, or related Azure tools. API Management configures a logger resource for the connection.
Important
Currently, in the portal, API Management only supports connections to Application Insights using an Application Insights instrumentation key. For enhanced security, we recommend using an Application Insights connection string with an API Management managed identity. To configure connection string with managed identity credentials, use the REST API or related tools as shown in a later section of this article. Learn more about Application Insights connection strings.
Note
If your Application Insights resource is in a different tenant, then you must create the logger using the REST API or related tools as shown in a later section of this article.
Second, enable Application Insights logging for your API or APIs.
In this article, you enable Application Insights logging for your API using the Azure portal. API Management configures a diagnostic resource for the API.
Create a connection using the Azure portal
Follow these steps to use the Azure portal to create a connection between Application Insights and API Management.
Note
Where possible, Microsoft recommends using connection string with managed identity credentials for enhanced security. To configure these credentials, use the REST API or related tools as shown in a later section of this article.
Navigate to your Azure API Management service instance in the Azure portal.
Select Application Insights from the menu on the left.
Select + Add.
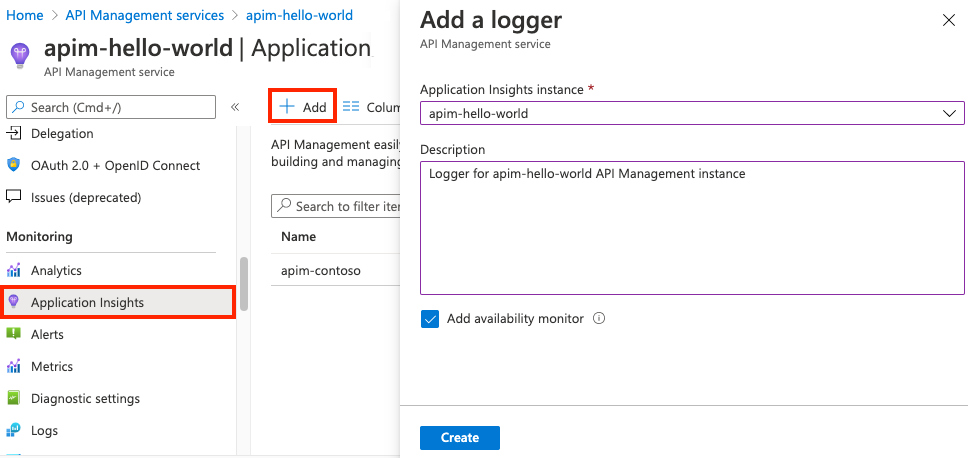
Select the Application Insights instance you created earlier and provide a short description.
To enable availability monitoring of your API Management instance in Application Insights, select the Add availability monitor checkbox.
- This setting regularly validates whether the API Management gateway endpoint is responding.
- Results appear in the Availability pane of the Application Insights instance.
Select Create.
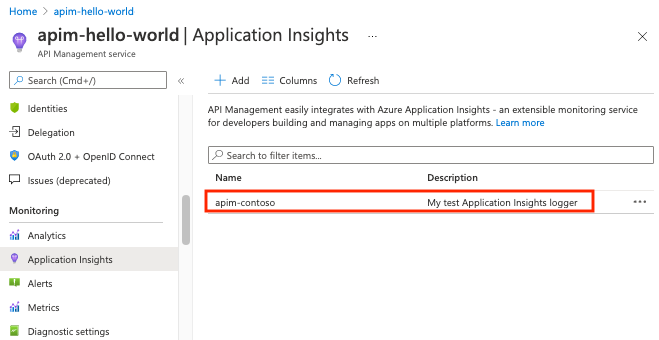
Check that the new Application Insights logger now appears in the list.
Note
Behind the scenes, a logger entity is created in your API Management instance, containing the instrumentation key of the Application Insights instance.
Tip
If you need to update the instrumentation key configured in the Application Insights logger, select the logger's row in the list (not the name of the logger). Enter the instrumentation key, and select Save.
Create a connection using the REST API, Bicep, or ARM template
Follow these steps to use the REST API, Bicep, or ARM template to create an Application Insights logger for your API Management instance. You can configure a logger that uses connection string with managed identity credentials (recommended), or a logger that uses only a connection string.
Logger with connection string with managed identity credentials (recommended)
See the prerequisites for using an API Management managed identity.
The Application Insights connection string appears in the Overview section of your Application Insights resource.
Connection string with system-assigned managed identity
Use the API Management Logger - Create or Update REST API with the following request body.
{
  "properties": {
    "loggerType": "applicationInsights",
    "description": "Application Insights logger with system-assigned managed identity",
    "credentials": {
         "connectionString":"InstrumentationKey=00000000-0000-0000-0000-000000000000;IngestionEndpoint=https://xxxx.applicationinsights.azure.com/;...",
         "identityClientId":"SystemAssigned"
    }
  }
}
Connection string with user-assigned managed identity
Use the API Management Logger - Create or Update REST API with the following request body.
{
  "properties": {
    "loggerType": "applicationInsights",
    "description": "Application Insights logger with user-assigned managed identity",
    "credentials": {
         "connectionString":"InstrumentationKey=00000000-0000-0000-0000-000000000000;IngestionEndpoint=https://xxxx.applicationinsights.azure.com/;...",
         "identityClientId":"<ClientID>"
    }
  }
}
Logger with connection string credentials only
The Application Insights connection string appears in the Overview section of your Application Insights resource.
Use the API Management Logger - Create or Update REST API with the following request body.
If you are configuring the logger for a workspace, use the Workspace Logger - Create or Update REST API.
{
  "properties": {
    "loggerType": "applicationInsights",
    "description": "Application Insights logger with connection string",
    "credentials": {
         "connectionString":"InstrumentationKey=00000000-0000-0000-0000-000000000000;IngestionEndpoint=https://xxxx.applicationinsights.azure.com/;..."
    }
  }
}
Enable Application Insights logging for your API
Use the following steps to enable Application Insights logging for an API. You can also enable Application Insights logging for all APIs.
Navigate to your Azure API Management service instance in the Azure portal.
Select APIs > APIs from the menu on the left.
Select an API, such as Swagger Petstore. If configured, select a version.
Tip
To enable logging for all APIs, select All APIs.
Go to the Settings tab from the top bar.
Scroll down to the Diagnostics Logs section.
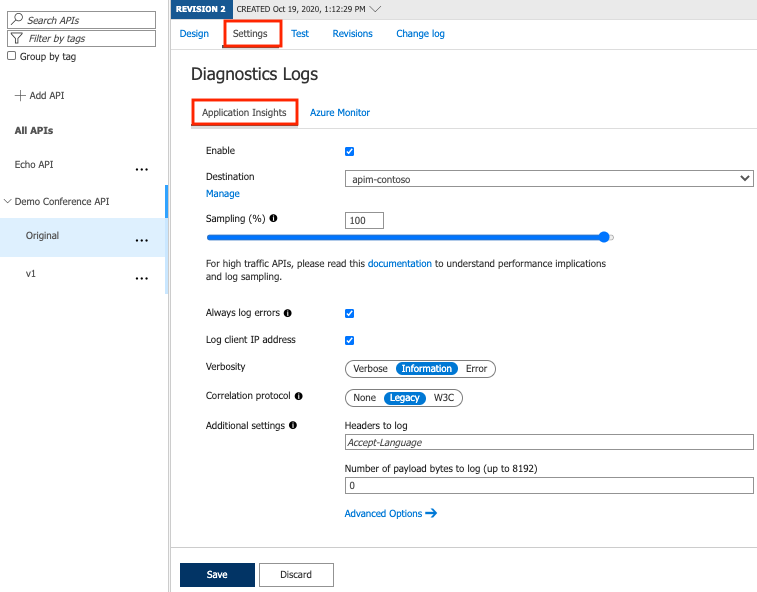
Check the Enable box.
Select your attached logger in the Destination dropdown.
Input 100 as Sampling (%) and select the Always log errors checkbox.
Leave the rest of the settings as is. For details about the settings, see Diagnostic logs settings reference.
Warning
Overriding the default Number of payload bytes to log value 0 may significantly decrease the performance of your APIs.
Select Save.
Behind the scenes, a Diagnostic entity named
applicationinsightsis created at the API level.
Note
Requests are successful once API Management sends the entire response to the client.
Loggers for a single API or all APIs
You can specify loggers on different levels:
- Single API logger
- A logger for all APIs
Specifying both:
- By default, the single API logger (more granular level) overrides the one for all APIs.
- If the loggers configured at the two levels are different, and you need both loggers to receive telemetry (multiplexing), please contact Microsoft Support. Please note that multiplexing is not supported if you're using the same logger (Application Insights destination) at the "All APIs" level and the single API level. For multiplexing to work correctly, you must configure different loggers at the "All APIs" and individual API level and request assistance from Microsoft support to enable multiplexing for your service.
What data is added to Application Insights
Application Insights receives:
| Telemetry item | Description |
|---|---|
| Request | For every incoming request:
|
| Dependency | For every request forwarded to a backend service:
|
| Exception | For every failed request:
|
| Trace | If you configure a trace policy. The severity setting in the trace policy must be equal to or greater than the verbosity setting in the Application Insights logging. |
Note
See Application Insights limits for information about the maximum size and number of metrics and events per Application Insights instance.
Emit custom metrics
You can emit custom metrics to Application Insights from your API Management instance. API Management emits custom metrics using policies such as emit-metric and azure-openai-emit-token-metric. The following section uses the emit-metric policy as an example.
Note
Custom metrics are a preview feature of Azure Monitor and subject to limitations.
To emit custom metrics, perform the following configuration steps.
Enable Custom metrics (Preview) with custom dimensions in your Application Insights instance.
- Navigate to your Application Insights instance in the portal.
- In the left menu, select Usage and estimated costs.
- Select Custom metrics (Preview) > With dimensions.
- Select OK.
Add the
"metrics": trueproperty to theapplicationInsightsdiagnostic entity that's configured in API Management. Currently you must add this property using the API Management Diagnostic - Create or Update REST API. For example:PUT https://management.azure.com/subscriptions/{SubscriptionId}/resourceGroups/{ResourceGroupName}/providers/Microsoft.ApiManagement/service/{APIManagementServiceName}/diagnostics/applicationinsights { [...] { "properties": { "loggerId": "/subscriptions/{SubscriptionId}/resourceGroups/{ResourceGroupName}/providers/Microsoft.ApiManagement/service/{APIManagementServiceName}/loggers/{ApplicationInsightsLoggerName}", "metrics": true [...] } }Ensure that the Application Insights logger is configured at the scope you intend to emit custom metrics (either all APIs, or a single API). For more information, see Enable Application Insights logging for your API, earlier in this article.
Configure the
emit-metricpolicy at a scope where Application Insights logging is configured (either all APIs, or a single API) and is enabled for custom metrics. For policy details, see theemit-metricpolicy reference.
Limits for custom metrics
Azure Monitor imposes usage limits for custom metrics that may affect your ability to emit metrics from API Management. For example, Azure Monitor currently sets a limit of 10 dimension keys per metric, and a limit of 50,000 total active time series per region in a subscription (within a 12 hour period). In API Management, 5 of these are used for default dimensions including the following:
- Region
- Service ID
- Service Name
- Service Type
These limits have the following implications for configuring custom metrics in an API Management policy such as emit-metric or azure-openai-emit-token-metric:
You can configure a maximum of 5 custom dimensions per policy.
The number of active time series generated by the policy within a 12 hour period is the product of the number of unique values of each configured dimension during the period. For example, if three custom dimensions were configured in the policy, and each dimension had 10 possible values within the period, the policy would contribute 1,000 (10 x 10 x 10) active time series.
If you configure the policy in multiple API Management instances that are in the same region in a subscription, all instances can contribute to the regional active time series limit.
Learn more about design limitations and considerations for custom metrics in Azure Monitor.
Performance implications and log sampling
Warning
Logging all events may have serious performance implications, depending on incoming requests rate.
Based on internal load tests, enabling the logging feature caused a 40%-50% reduction in throughput when request rate exceeded 1,000 requests per second. Application Insights is designed to assess application performances using statistical analysis. It's not:
- Intended to be an audit system.
- Suited for logging each individual request for high-volume APIs.
You can manipulate the number of logged requests by adjusting the Sampling setting. A value of 100% means all requests are logged, while 0% reflects no logging.
Sampling helps to reduce telemetry volume, effectively preventing significant performance degradation while still carrying the benefits of logging.
To improve performance issues, skip:
- Request and responses headers.
- Body logging.
Video
Troubleshooting
Addressing the issue of telemetry data flow from API Management to Application Insights:
- Investigate whether a linked Azure Monitor Private Link Scope (AMPLS) resource exists within the VNet where the API Management resource is connected. AMPLS resources have a global scope across subscriptions and are responsible for managing data query and ingestion for all Azure Monitor resources. It's possible that the AMPLS has been configured with a Private-Only access mode specifically for data ingestion. In such instances, include the Application Insights resource and its associated Log Analytics resource in the AMPLS. Once this addition is made, the API Management data will be successfully ingested into the Application Insights resource, resolving the telemetry data transmission issue.
Related content
- Learn more about Azure Application Insights.
- Consider logging with Azure Event Hubs.
- Learn about visualizing data from Application Insights using Azure Managed Grafana