Note
Access to this page requires authorization. You can try signing in or changing directories.
Access to this page requires authorization. You can try changing directories.
Important
AKS preview features are available on a self-service, opt-in basis. Previews are provided "as is" and "as available," and they're excluded from the service-level agreements and limited warranty. AKS previews are partially covered by customer support on a best-effort basis. As such, these features aren't meant for production use. For more information, see the following support articles:
Azure Kubernetes Application Network provides two types of logging that you can configure based on your monitoring and troubleshooting requirements: data plane logs and control plane logs.
- Data plane logs: Include logs from application workloads,
applink-systemnamespace components, and Envoy proxy access logs. - Control plane logs: Include Istiod logs from the Azure Kubernetes Application Network control plane components.
Azure Kubernetes Application Network logging is disabled by default. This article describes how to enable both types of logging and view them in Azure Monitor.
Set environment variables
Set environment variables for your selected workflow using the following commands:
# Set if specifying an existing or creating a new Log Analytics workspace
export LAW_NAME=<log-analytics-workspace-name>

# Set for resource group, location, and AKS cluster name
export AKS_RG=<aks-resource-group>
export LOCATION=<location>
export CLUSTER_NAME=<aks-cluster-name>

# Set for Azure Kubernetes Application Network member resource group, name, and member name
export APPNET_RG=<appnet-resource-group>
export APPNET_NAME=<appnet-name>
export APPNET_MEMBER_NAME=<appnet-member-name>
Enable data plane logs
Data plane logs include logs from your workloads/applications and applink-system workloads (Ztunnel and Istio CNI). The Azure Container Insights add-on is the preferred way to enable and view logs for troubleshooting.
When enabling data plane logs, you have the option to specify an existing Log Analytics workspace, use the default workspace for your resource group, or create a new workspace.
Create a new Log Analytics workspace
If creating a new Log Analytics workspace, use the
az monitor log-analytics workspace createcommand:az monitor log-analytics workspace create \ --resource-group $AKS_RG \ --workspace-name $LAW_NAME \ --location $LOCATION
Enable Container Insights add-on on your AKS cluster
Enable the Container Insights add-on for your Azure Kubernetes Application Network member cluster (optionally omitting the workspace ID) using the
az aks enable-addonscommand.az aks enable-addons \ --addon monitoring \ --name $CLUSTER_NAME \ --resource-group $AKS_RG \ --workspace-resource-id /subscriptions/$SUBSCRIPTION/resourcegroups/$AKS_RG/providers/microsoft.operationalinsights/workspaces/$LAW_NAME
View logs
View the logs by navigating to the Log Analytics workspace and running the following query:
ContainerLogV2
| where PodNamespace == "applink-system"
Envoy access logs
In some cases, you might need to examine Envoy access logs when traffic is generated for your applications/workloads. To enable Envoy access logs, use the Telemetry API.
In the YAML below, specify the namespace where you want to enable Envoy access logging. For mesh-wide Envoy access logs, remove the namespace from the metadata.
cat <<EOF | kubectl apply -n default -f -
apiVersion: telemetry.istio.io/v1
kind: Telemetry
metadata:
  name: mesh-logging-default
  namespace: default
spec:
  accessLogging:
  - providers:
    - name: envoy
EOF
Envoy access logs will be available in the Log Analytics workspace where the Container Insights add-on was enabled.
View the Envoy access logs by navigating to the Log Analytics workspace and running the following query:
ContainerLogV2
| where TimeGenerated > ago(45m)
| where PodName contains "gateway"
| take 10
Enable control plane logs
To enable control plane logs, you create a diagnostic setting and send logs to the Log Analytics workspace.
Set an environment variable for your diagnostic setting name using the following command:
export DS_NAME=<diagnostic-settings-name>Create a diagnostic setting for your Azure Kubernetes Application Network member resource and specify the Log Analytics workspace as the destination using the
az monitor diagnostic-settings createcommand.az monitor diagnostic-settings create \ --resource /subscriptions/$SUBSCRIPTION/resourceGroups/$APPNET_RG/providers/Microsoft.AppLink/appLinks/$APPNET_NAME/appLinkMembers/$APPNET_MEMBER_NAME \ --workspace /subscriptions/$SUBSCRIPTION/resourcegroups/$AKS_RG/providers/microsoft.operationalinsights/workspaces/$LAW_NAME \ --logs "[{category:istiod,enabled:true}]" \ --name $DS_NAMEOnce enabled, navigate to the Log Analytics workspace and run the following query:
Note
$appnet_member_resourceIdshould be in the format:/subscriptions/$subscription/resourceGroups/$appnet_rg/providers/microsoft.applink/applinks/$appnet_name/applinkmembers/$appnet_member_name.MeshControlPlane | where TimeGenerated > ago(1h) | where _ResourceId == $appnet_member_resourceId // appnet member resourceId
Log tables and schema
The following tables contain Azure Kubernetes Application Network logs in your Log Analytics workspace:
| Log table | Description |
|---|---|
ContainerLogV2 |
Contains your application/workload logs |
MeshControlPlane |
Contains Istiod logs |
Schema
To find the ContainerLogV2 schema, see ContainerLogV2 columns.
MeshControlPlane is a custom table with the following schema:
| # | Column name | Type |
|---|---|---|
| 0 | TenantId | string |
| 1 | TimeGenerated | datetime |
| 2 | Category | string |
| 3 | Level | string |
| 4 | Message | string |
| 5 | Container | string |
| 6 | PodName | string |
| 7 | SourceSystem | string |
| 8 | Type | string |
| 9 | _ResourceId | string |
Sample queries
Filter logs by AKS cluster resource ID
Filter logs based on your AKS managed cluster resource ID in the ContainerLogV2 table using the following query:
ContainerLogV2
| where TimeGenerated > ago(45m)
| where _ResourceId == $aks_cluster_resource_id // managed cluster resourceId
Filter logs by Azure Kubernetes Application Network member resource ID
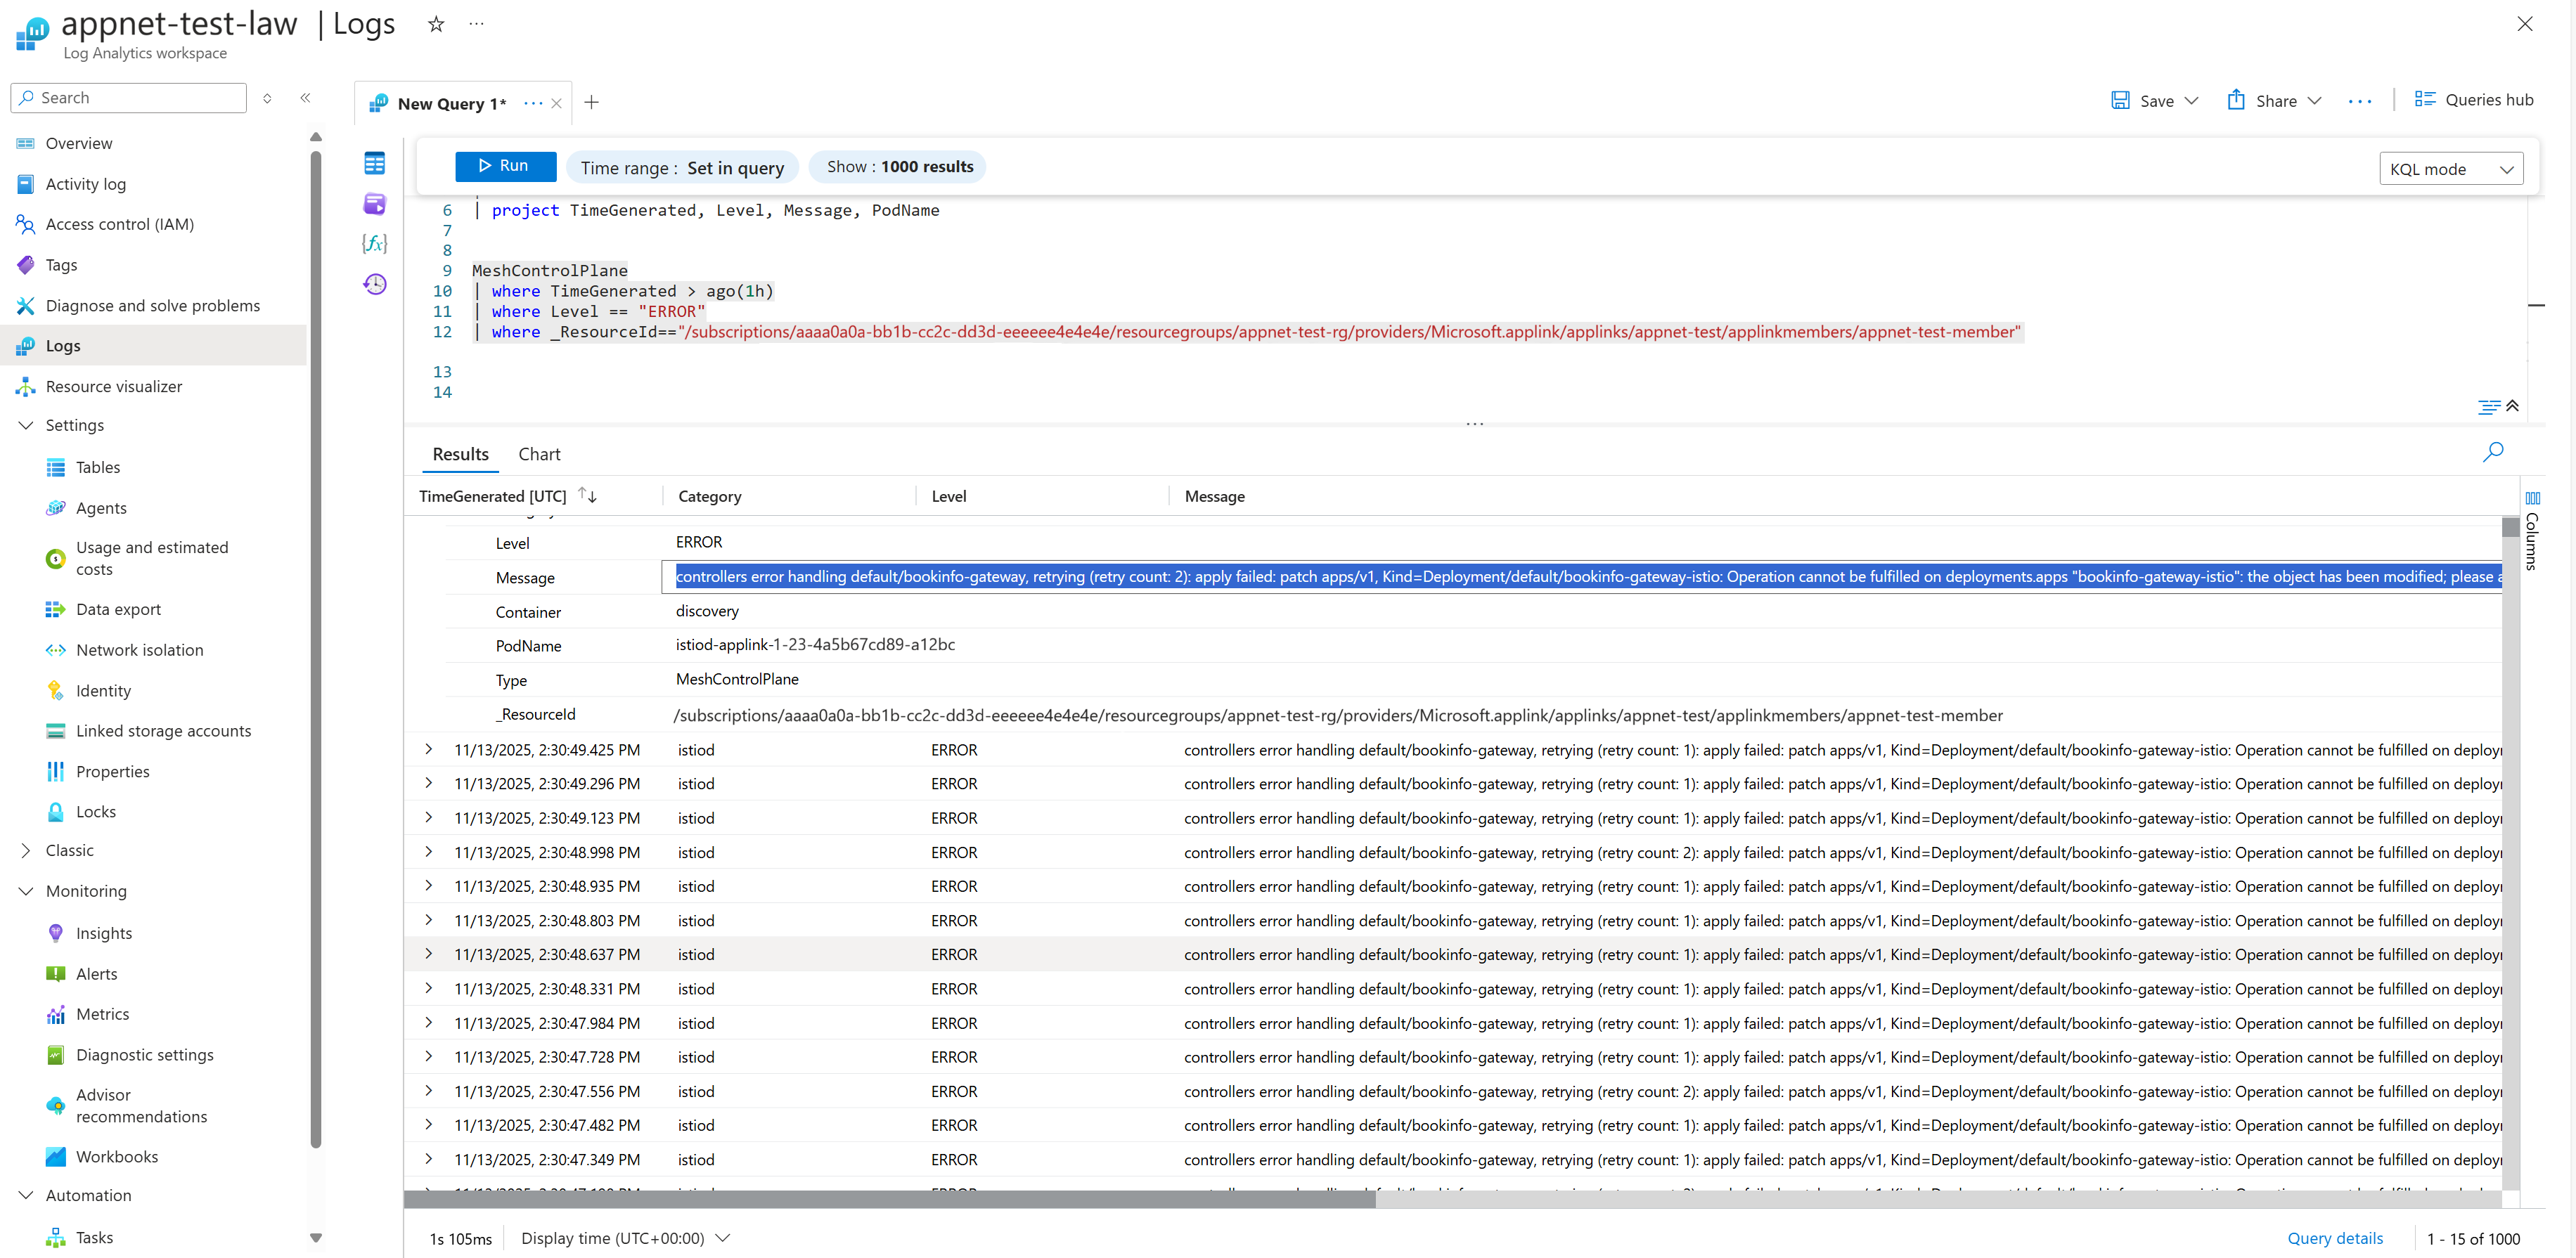
Filter logs based on your Azure Kubernetes Application Network member resource ID in the MeshControlPlane table for control plane logs using the following query:
MeshControlPlane
| where TimeGenerated > ago(45m)
| where Level == "ERROR"
| where _ResourceId == $appnet_member_resourceId // appnet member resourceId
The following screenshot shows an example of the Application Network Istiod errors in Azure Monitor Logs:

Related content
For more information about Azure Kubernetes Application Network observability and monitoring, see the following articles: