Note
Access to this page requires authorization. You can try signing in or changing directories.
Access to this page requires authorization. You can try changing directories.
Important
AKS preview features are available on a self-service, opt-in basis. Previews are provided "as is" and "as available," and they're excluded from the service-level agreements and limited warranty. AKS previews are partially covered by customer support on a best-effort basis. As such, these features aren't meant for production use. For more information, see the following support articles:
Azure Kubernetes Application Network provides comprehensive metrics for your workloads and the Azure Kubernetes Application Network data plane components (ZTunnel, Istio CNI, and Waypoint) through Azure Monitor metrics. This article explains how to configure and view these metrics in Azure Monitor.
Limitations
Control plane metrics aren't currently supported. However, data plane metrics are available, and you can use them to monitor the health and performance of your workloads and Azure Kubernetes Application Network components.
Data plane metrics
Data plane metrics include metrics from your workloads/applications and the appnet-system namespace. Azure Kubernetes Application Network currently only provides support for data plane metrics.
Configure data plane metrics
Workspace configuration options for data plane metrics
When you enable Prometheus metrics collection for Azure Kubernetes Application Network member clusters, you have the following options for workspace configuration:
- Use an existing Azure Monitor workspace.
- Omit the workspace resource ID and use the default workspace created for your resource group.
- Create a new Azure Monitor workspace.
Enable data plane metrics collection
- Use an existing Azure Monitor workspace
- Use the default workspace
- Create a new Azure Monitor workspace
Enable Prometheus metrics collection on your Azure Kubernetes Application Network member cluster using the
az aks updatecommand with the--azure-monitor-workspace-resource-idparameter set to your existing workspace ID. If Azure Monitor Metrics is already enabled on your member cluster, you can skip to the next step.az aks update --enable-azure-monitor-metrics \ --name $CLUSTER_NAME \ --resource-group $AKS_RG \ --azure-monitor-workspace-resource-id $WORKSPACE_IDCreate and apply the following ConfigMap in the
kube-systemnamespace using thekubectl applycommand. This ConfigMap enables scraping of Ztunnel, Istio CNI, waypoint, and your application/workloads.kubectl apply -f - <<EOF kind: ConfigMap apiVersion: v1 metadata: name: ama-metrics-settings-configmap namespace: kube-system data: schema-version: v1 config-version: ver1 prometheus-collector-settings: |- cluster_alias = "" https_config = true default-scrape-settings-enabled: |- ztunnel = true istio-cni = true pod-annotation-based-scraping: |- podannotationnamespaceregex = ".*" default-targets-metrics-keep-list: |- ztunnel = "" istio-cni = "" minimalingestionprofile = true default-targets-scrape-interval-settings: |- ztunnel = "30s" istio-cni = "30s" podannotations = "30s" debug-mode: |- enabled = false EOFAdd annotations to the applications pods you want to scrape.
prometheus.io/scrape: "true"is required to indicate that the pod should be scraped.prometheus.io/pathis optionally used to indicate the path where metrics are hosted. If omitted, it defaults to/metrics.prometheus.io/portis optionally used to indicate the port where metrics are hosted. If omitted, Prometheus will use the container's declared ports from the pod spec. For containers with no declared ports, Prometheus creates a port-free target (IP only), which requires proper relabeling configuration to work with port annotations. It is recommended to explicitly specify the port to ensure reliable scraping.
The following sample defines annotations for a pod that is hosting metrics at
<pod IP>:15020/metricsprometheus.io/scrape: "true" prometheus.io/port: "15020" prometheus.io/path: "/metrics"It might take a few minutes for the AMA metrics ReplicaSet to load this configuration.
View data plane metrics
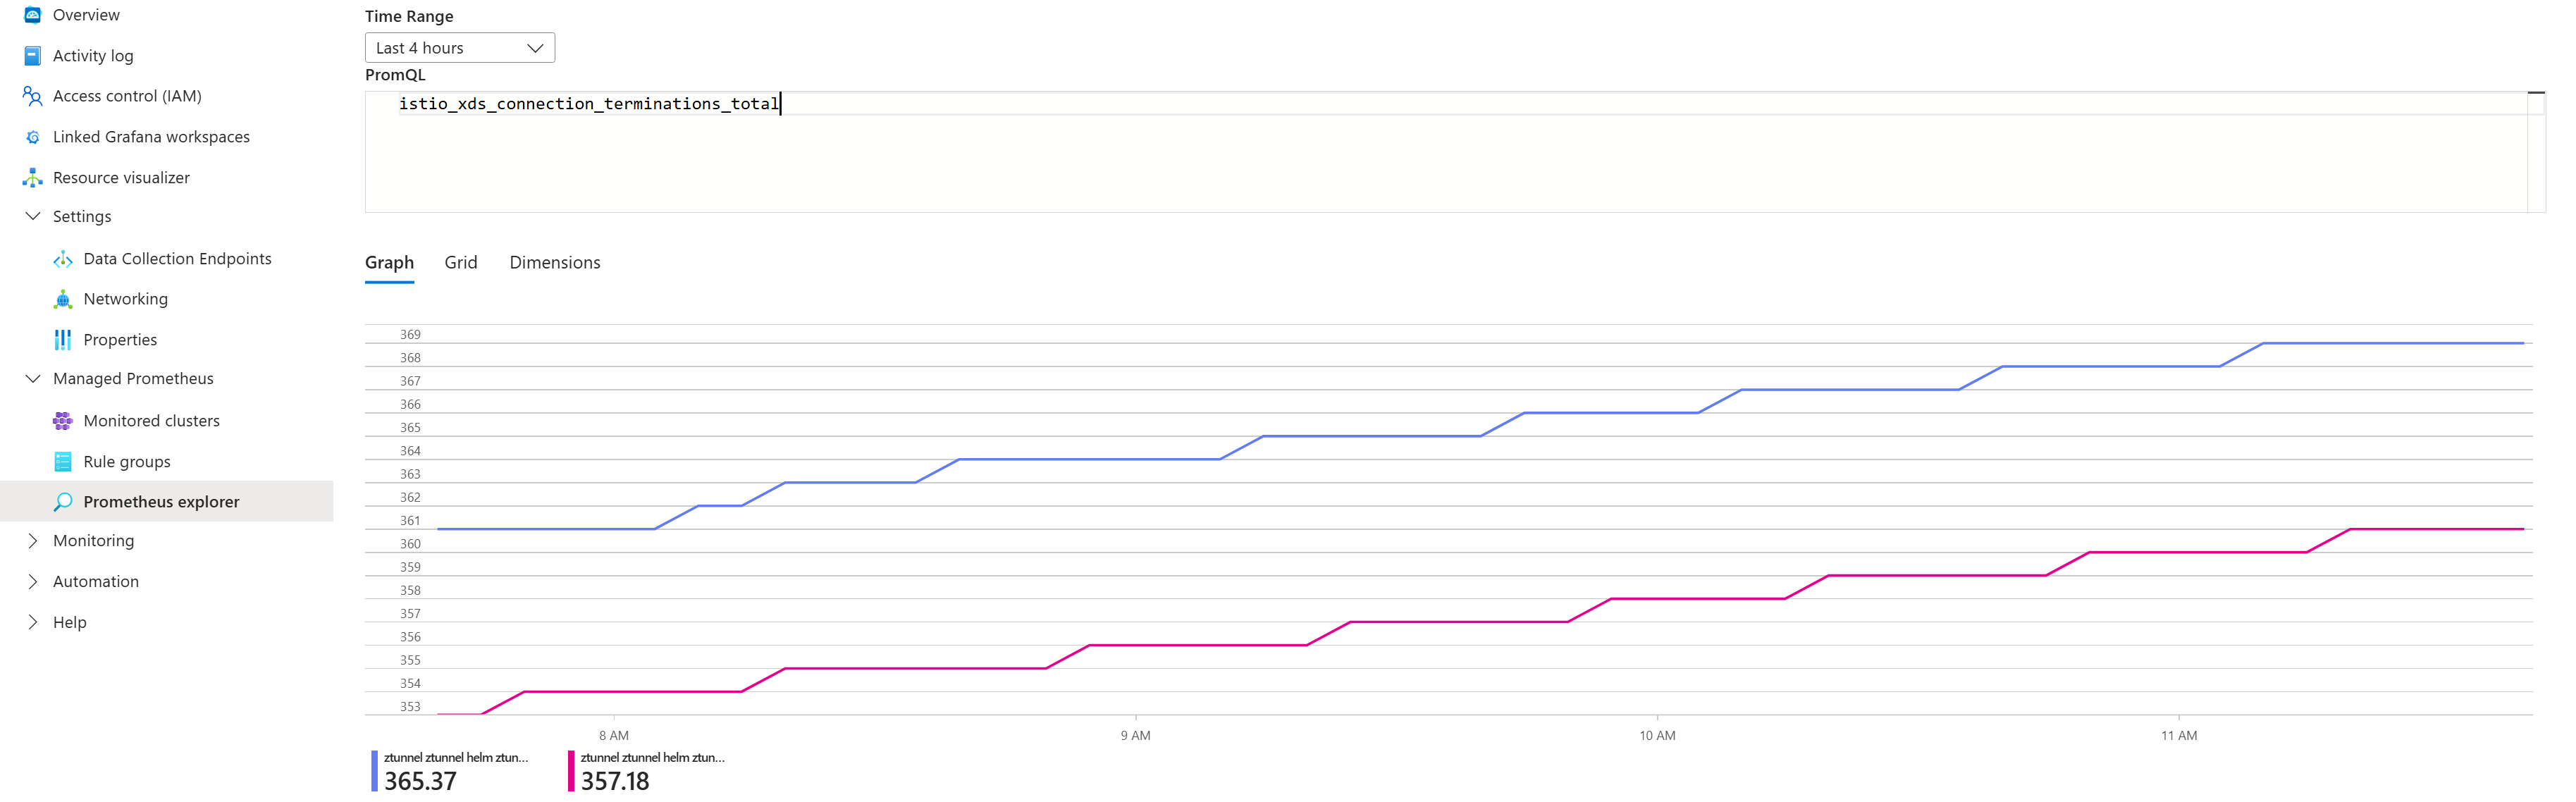
Navigate to your Azure Monitor workspace in the Azure portal to query the metrics using PromQL.
Generate some traffic, then select queries from the exposed metrics to view metrics. For example, you can run the following query to view the total number of requests handled by waypoint:
# ztunnel
istio_xds_connection_terminations_total

# waypoint
istio_requests_total

# istio-cni
istio_cni_install_ready
The following screenshot shows results for the sample queries:

List of metrics exposed
| Component | Metrics exposed |
|---|---|
| ZTunnel | istio_buildistio_xds_connection_terminations_totalistio_xds_message_totalistio_xds_message_bytes_totalistio_tcp_connections_opened_totalistio_tcp_connections_closed_totalistio_tcp_received_bytes_totalistio_tcp_sent_bytes_totalistio_on_demand_dnsistio_dns_requests_totalistio_dns_upstream_requestsistio_dns_upstream_failuresistio_dns_upstream_request_duration_secondsworkload_manager_active_proxy_countworkload_manager_pending_proxy_countworkload_manager_proxies_started_totalworkload_manager_proxies_stopped_total |
| Istio CNI | istio_cni_install_readyistio_cni_installs_totalnodeagent_reconcile_events_totalztunnel_connected |
| Waypoint | istio_buildistio_request_bytes_bucketistio_request_bytes_countistio_request_bytes_sumistio_request_duration_milliseconds_bucketistio_request_duration_milliseconds_countistio_request_duration_milliseconds_sumistio_requests_totalistio_response_bytes_bucketistio_response_bytes_countistio_response_bytes_sum |
Access metrics directly from waypoint proxies
Aside from the Istio request/response metrics, waypoint proxies also emit Envoy metrics.
To find a complete list of metrics emitted by waypoint, you can port-forward to a waypoint proxy in your namespace and list the metrics using following commands:
# Port-forward to waypoint proxy
kubectl port-forward -n <namespace> deployment/waypoint 15020:15020 &

# List metrics exposed by waypoint
curl http://localhost:15020/stats/prometheus | grep -v '^#' | grep -v '^$' | awk -F'{' '{print $1}' | sort -u
Visualize metrics with Grafana in Azure portal
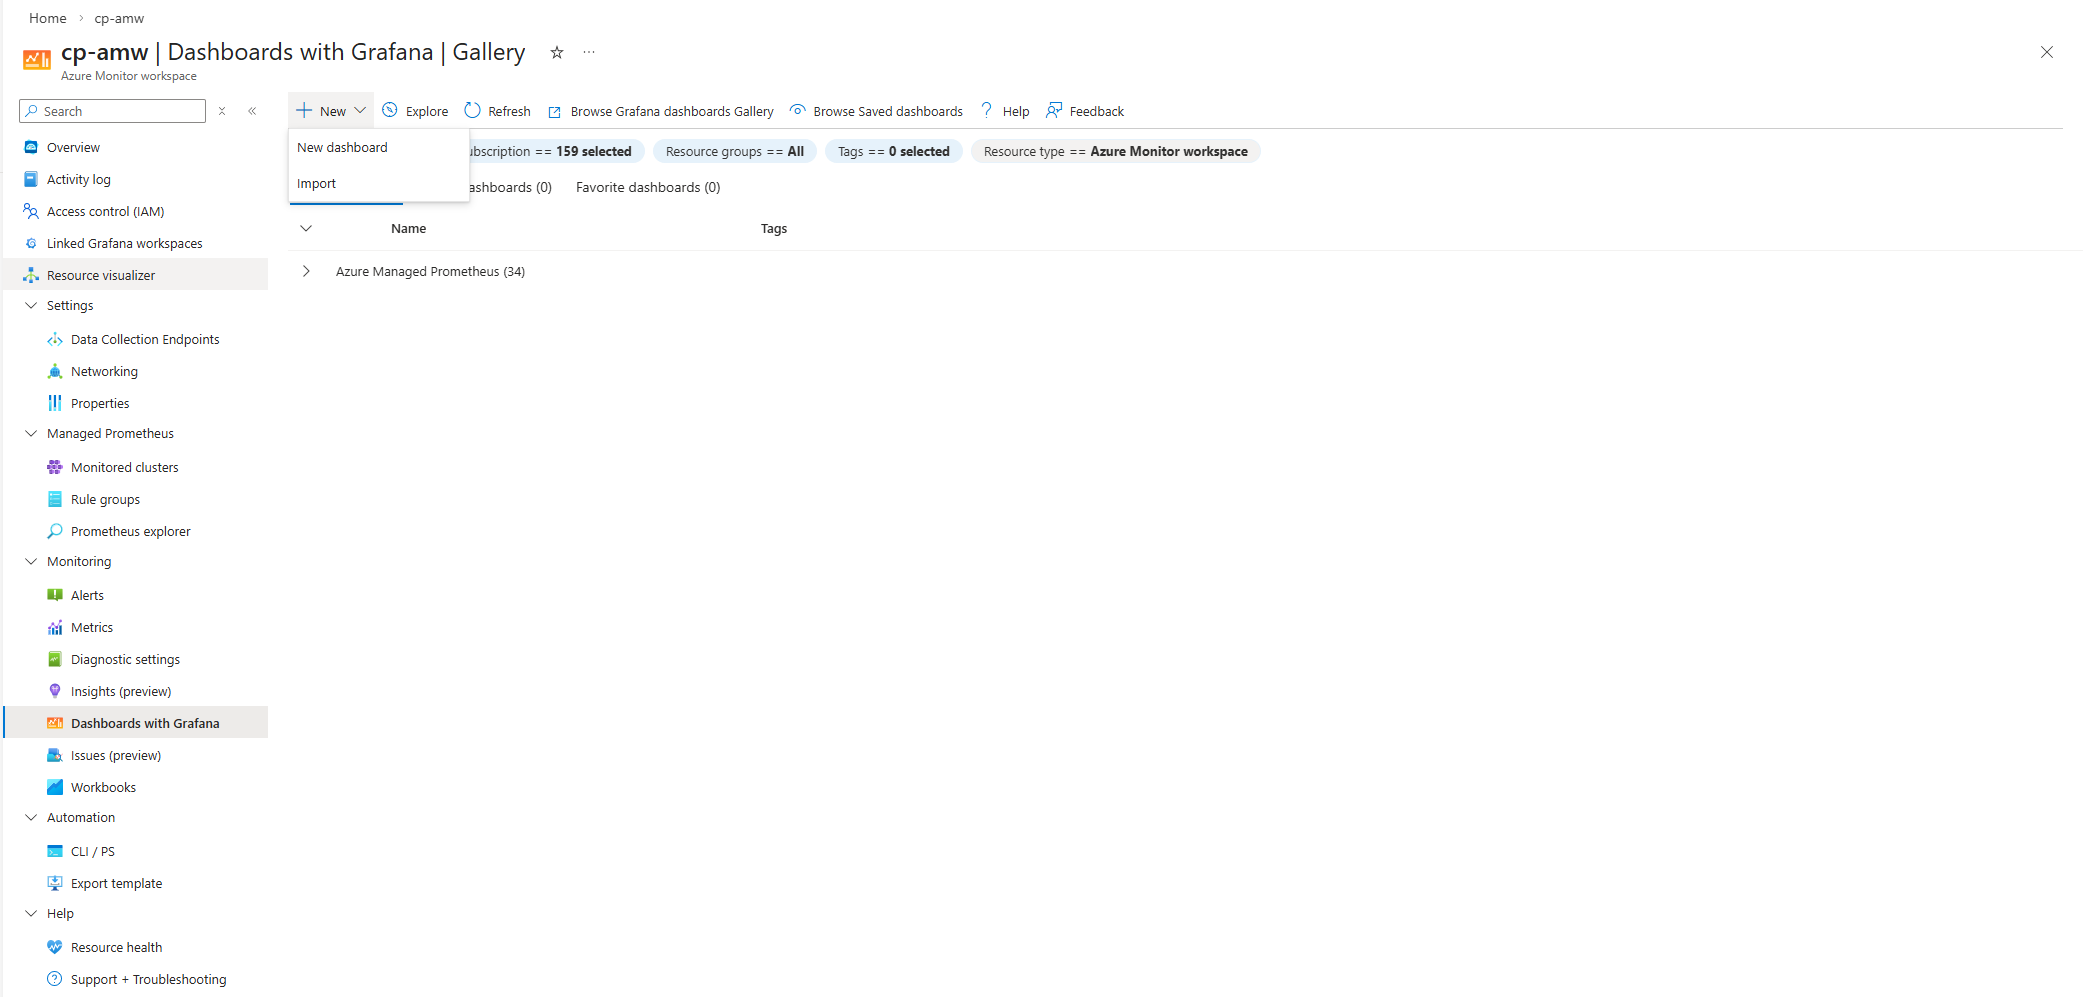
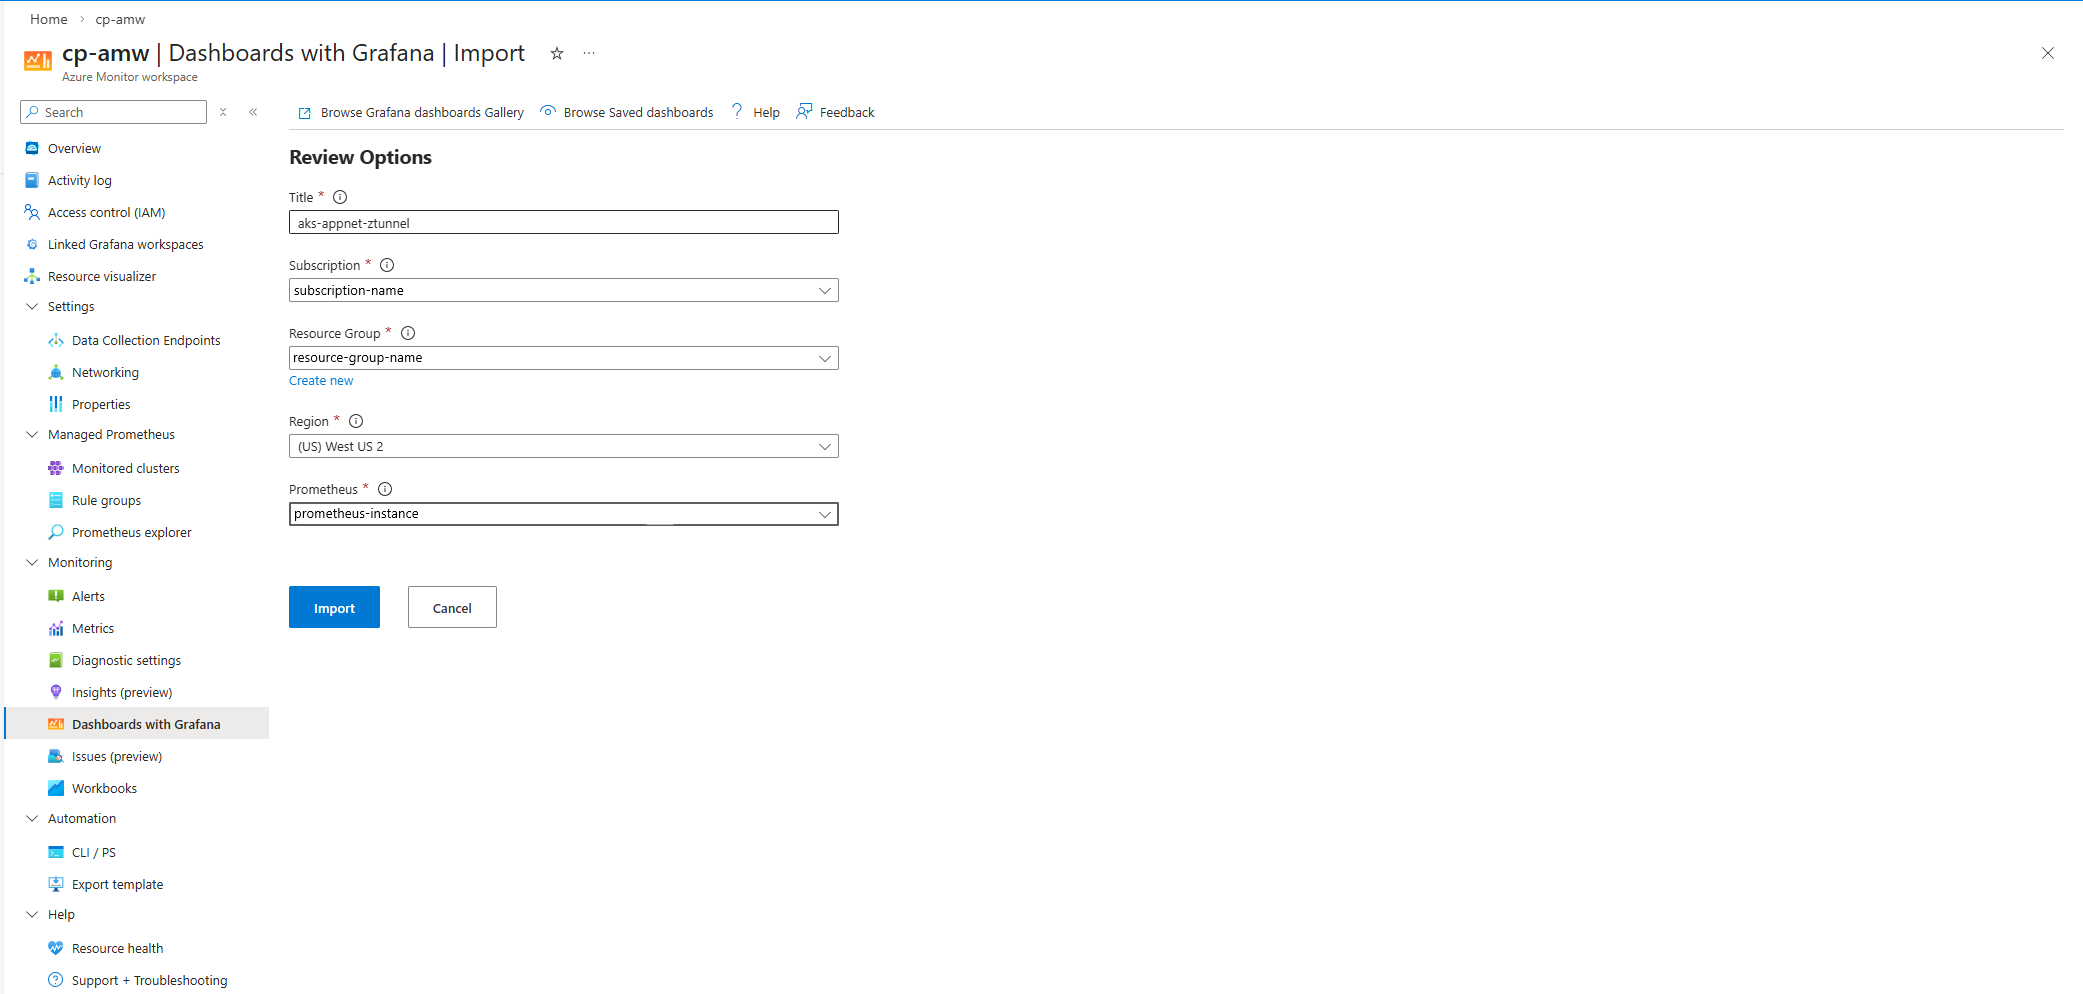
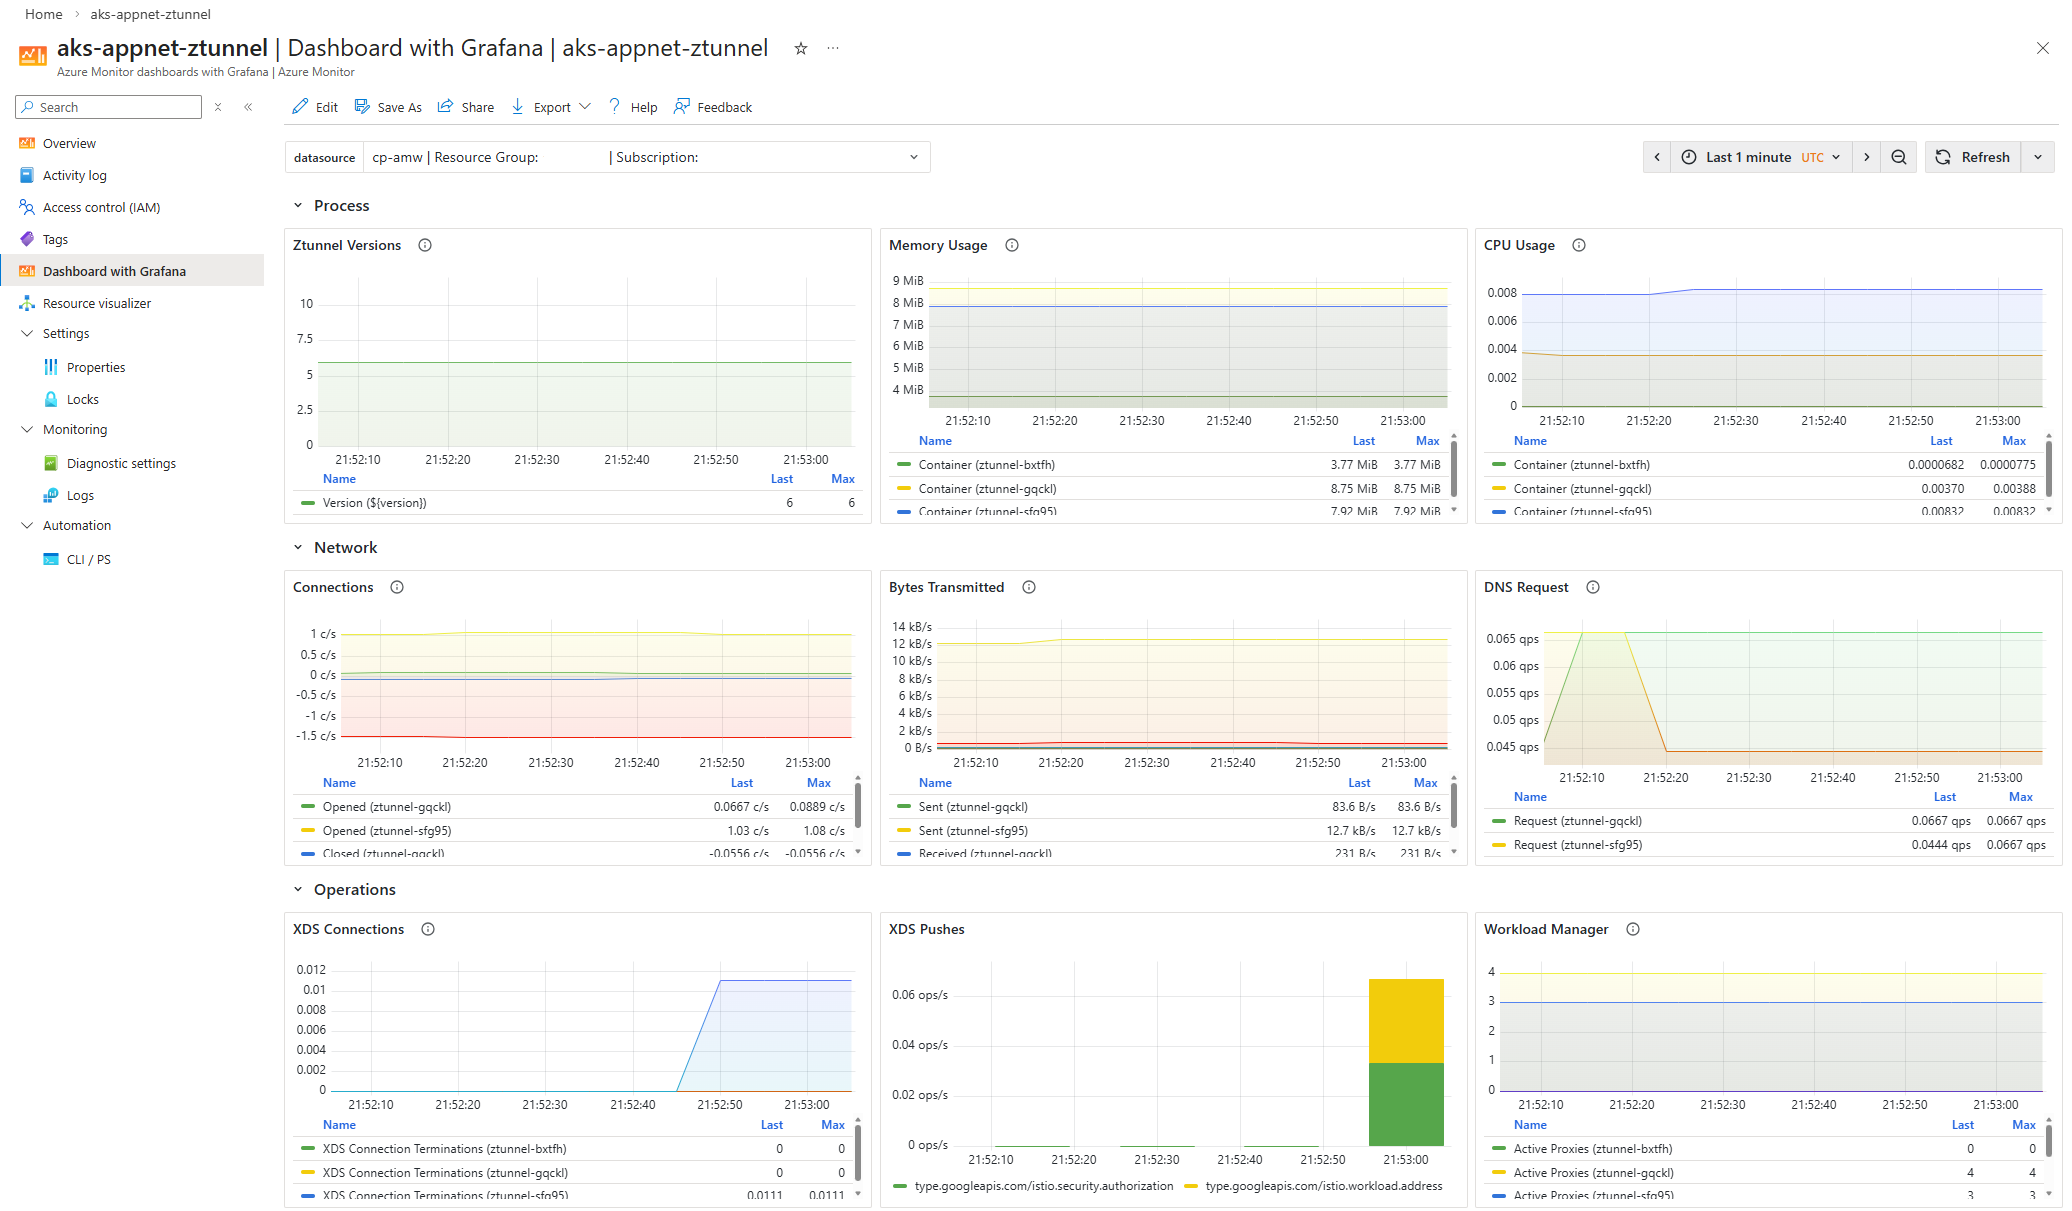
Import the Istio community dashboards.
Generate traffic for your member cluster, and then navigate to your Azure Monitor workspace in the Azure portal.
Select Monitoring > Dashboards with Grafana.
The following screenshots show examples of importing the Istio Ztunnel Dashboard:


If you want to configure Azure Managed Grafana instead of Dashboards with Grafana, see Create an Azure Managed Grafana workspace using the Azure CLI.
Related content
For more information about Azure Kubernetes Application Network observability and monitoring, see the following articles: