Note
Access to this page requires authorization. You can try signing in or changing directories.
Access to this page requires authorization. You can try changing directories.
The baseline mission-critical reference architecture uses a simple online catalog application to illustrate a highly reliable workload. Users can browse through a catalog of items, review item details, and post ratings and comments for items. This article focuses on the reliability and resiliency aspects of a mission-critical application, such as asynchronous request processing and how to achieve high throughput within a solution.
Important
 A production-grade reference implementation that showcases mission-critical application development on Azure supports the guidance in this article. You can use this implementation as a basis for further solution development in your first step toward production.
Application composition
For high-scale mission-critical applications, you must optimize the architecture for end-to-end scalability and resilience. You can separate components into functional units that can operate independently. Apply this separation at all levels on the application stack so that each part of the system can scale independently and meet changes in demand. The implementation demonstrates this approach.
The application uses stateless API endpoints that decouple long-running write requests asynchronously through a messaging broker. The workload's composition enables you to delete and recreate whole Azure Kubernetes Service (AKS) clusters and other dependencies in the stamp at any time. The main components of the application are:
User interface (UI): A single-page web application that users can access. The UI is hosted in an Azure Storage account's static website hosting.
API (
CatalogService): A REST API that's called by the UI application but still available for other potential client applications.Worker (
BackgroundProcessor): A background worker that listens to new events on the message bus and processes the write requests to the database. This component doesn't expose any APIs.Health service API (
HealthService): An API that reports the health of the application by checking if critical components are working, such as the database or messaging bus.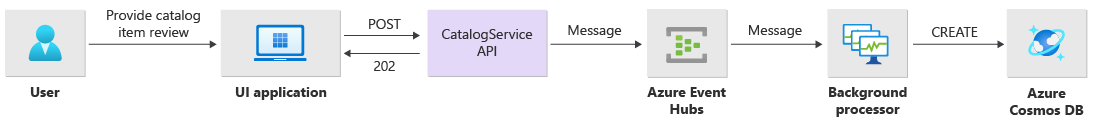

The workload consists of the API, worker, and health check applications. A dedicated AKS namespace called workload hosts the workload as containers. No direct communication occurs between the pods. The pods are stateless and can scale independently.

Other supporting components that run in the cluster include:
An NGINX ingress controller: Routes incoming requests to the workload and load balances between pods. The NGINX ingress controller is exposed through Azure Load Balancer with a public IP address but can only be accessed through Azure Front Door.
Cert manager: Jetstack's
cert-managerautoprovisions Transport Layer Security (TLS) certificates by using Let's Encrypt for the ingress rules.Secrets Store CSI Driver: The Azure Key Vault provider for Secrets Store CSI Driver securely reads secrets, such as connection strings from Key Vault.
Monitoring agent: The default OMSAgentForLinux configuration is adjusted to reduce the amount of monitoring data that's sent to the Azure Monitor Logs workspace.
Database connection
Due to the ephemeral nature of deployment stamps, avoid persisting state within the stamp as much as possible. You should persist state in an externalized data store. To support the reliability service-level objective (SLO), create a resilient data store. We recommend that you use managed, or platform as a service (PaaS), solutions in combination with native SDK libraries that automatically handle timeouts, disconnects, and other failure states.
In the reference implementation, Azure Cosmos DB serves as the main data store for the application. Azure Cosmos DB provides multi-region writes. Each stamp can write to the Azure Cosmos DB replica in the same region, and Azure Cosmos DB internally handles data replication and synchronization between regions. Azure Cosmos DB for NoSQL supports all capabilities of the database engine.
For more information, see Data platform for mission-critical workloads.
Note
Use Azure Cosmos DB for NoSQL for new applications. For legacy applications that use another NoSQL protocol, evaluate the migration path to Azure Cosmos DB.
For mission-critical applications that prioritize availability over performance, we recommend single-region write and multi-region read with a strong consistency level.
This architecture uses Storage to temporarily store state in the stamp for Azure Event Hubs checkpointing.
All workload components use the Azure Cosmos DB .NET Core SDK to communicate with the database. The SDK includes robust logic to maintain database connections and handle failures. Key configuration settings include:
Direct connectivity mode: This setting is a default for .NET SDK v3 because it offers better performance. Direct connectivity mode has fewer network hops compared to Gateway mode, which uses HTTP.
Return content response on write: This approach is disabled so that the Azure Cosmos DB client can't return the document from create, upsert, and patch and replace operations, which reduces network traffic. Further processing on the client doesn't require this setting.
Custom serialization: This process sets the JSON property naming policy to
JsonNamingPolicy.CamelCaseto translate .NET properties to standard JSON properties. It can also translate JSON properties to .NET properties. The default ignore condition ignores properties with null values, such asJsonIgnoreCondition.WhenWritingNull, during serialization.ApplicationRegion: This property is set to the region of the stamp, which enables the SDK to find the closest connection endpoint. The endpoint should preferably be in the same region.
The following code block appears in the reference implementation:
//
// /src/app/AlwaysOn.Shared/Services/CosmosDbService.cs
//
CosmosClientBuilder clientBuilder = new CosmosClientBuilder(sysConfig.CosmosEndpointUri, sysConfig.CosmosApiKey)
    .WithConnectionModeDirect()
    .WithContentResponseOnWrite(false)
    .WithRequestTimeout(TimeSpan.FromSeconds(sysConfig.ComsosRequestTimeoutSeconds))
    .WithThrottlingRetryOptions(TimeSpan.FromSeconds(sysConfig.ComsosRetryWaitSeconds), sysConfig.ComsosMaxRetryCount)
    .WithCustomSerializer(new CosmosNetSerializer(Globals.JsonSerializerOptions));

if (sysConfig.AzureRegion != "unknown")
{
    clientBuilder = clientBuilder.WithApplicationRegion(sysConfig.AzureRegion);
}

_dbClient = clientBuilder.Build();
Asynchronous messaging
When you implement loose coupling, services don't have dependencies on other services. The loose aspect enables a service to operate independently. The coupling aspect enables inter-service communication through well-defined interfaces. For a mission-critical application, loose coupling prevents downstream failures from cascading to front ends or other deployment stamps, which provides high availability.
The key characteristics of asynchronous messaging include:
Services don't have to use the same compute platform, programming language, or operating system.
Services scale independently.
Downstream failures don't affect client transactions.
Transactional integrity is difficult to maintain because data creation and persistence occur in separate services. Transactional integrity is a challenge across messaging and persistence services. For more information, see Idempotent message processing.
End-to-end tracing requires complex orchestration.
We recommend that you use well-known design patterns, such as the Queue-Based Load Leveling pattern and Competing Consumers pattern. These patterns distribute the load from the producer to the consumers and enable asynchronous processing by consumers. For example, the worker lets the API accept the request and quickly return to the caller, and the worker processes a database write operation separately.
Event Hubs brokers messages between the API and worker.
Important
Don't use the message broker as a persistent data store for long periods of time. The Event Hubs service supports the capture feature. The capture feature enables an event hub to automatically write a copy of the messages to a linked Storage account. This process controls usage and serves as a mechanism to back up messages.
Write operations implementation details
Write operations, such as post rating and post comment, are processed asynchronously. The API first sends a message with all relevant information, such as the type of action and the comment data, to the message queue and immediately returns HTTP 202 (Accepted) with the Location header of the object that will be created.
BackgroundProcessor instances process messages in the queue and handle the actual database communication for write operations. BackgroundProcessor scales in and scales out dynamically based on queue message volume. The scale-out limit of processor instances is defined by the maximum number of Event Hubs partitions, which is 32 for Basic tiers and Standard tiers, 100 for the Premium tier, and 1,024 for the Dedicated tier.

The Azure Event Hubs Processor library in BackgroundProcessor uses Azure Blob Storage to manage partition ownership, load balance between different worker instances, and use checkpoints to track progress. The checkpoints don't get written to blob storage after every event because it adds an expensive delay for every message. Instead, the checkpoints are written on a timer loop, and you can configure the duration. The default setting is 10 seconds.
The following code block appears in the reference implementation:
while (!stoppingToken.IsCancellationRequested)
{
    await Task.Delay(TimeSpan.FromSeconds(_sysConfig.BackendCheckpointLoopSeconds), stoppingToken);
    if (!stoppingToken.IsCancellationRequested && !checkpointEvents.IsEmpty)
    {
        string lastPartition = null;
        try
        {
            foreach (var partition in checkpointEvents.Keys)
            {
                lastPartition = partition;
                if (checkpointEvents.TryRemove(partition, out ProcessEventArgs lastProcessEventArgs))
                {
                    if (lastProcessEventArgs.HasEvent)
                    {
                        _logger.LogDebug("Scheduled checkpointing for partition {partition}. Offset={offset}", partition, lastProcessEventArgs.Data.Offset);
                        await lastProcessEventArgs.UpdateCheckpointAsync();
                    }
                }
            }
        }
        catch (Exception e)
        {
            _logger.LogError(e, "Exception during checkpointing loop for partition={lastPartition}", lastPartition);
        }
    }
}
If the processor application encounters an error or is stopped before it can process the message:
Another instance picks up the message for reprocessing because it wasn't properly checkpointed in Storage.
A conflict occurs if the previous worker persisted the document in the database before the worker failed. This error occurs because the same ID and partition key are used. The processor can safely ignore the message because the document is already persisted.
A new instance repeats the steps and finalizes persistence if the previous worker was terminated before it wrote to the database.
Read operations implementation details
The API directly processes read operations and immediately returns data back to the user.

A back-channel method isn't established to communicate to the client if the operation completes successfully. The client application must proactively poll the API for updates about the item specified in the Location HTTP header.
Scalability
Individual workload components should scale out independently because each component has different load patterns. The scaling requirements depend on the functionality of the service. Certain services directly affect users and must scale out aggressively to ensure fast responses and a positive user experience.
The implementation packages the services as container images and uses Helm charts to deploy the services to each stamp. The services are configured to have the expected Kubernetes requests and limits and a preconfigured automatic scaling rule in place. The CatalogService and the BackgroundProcessor workload components can scale in and scale out individually because both services are stateless.
Users interact directly with the CatalogService, so this part of the workload must respond under any load. There are a minimum of three instances for each cluster to spread across three availability zones in an Azure region. The horizontal pod autoscaler (HPA) in AKS automatically adds more pods as needed. The Azure Cosmos DB autoscale feature can dynamically increase and reduce request units (RUs) available for the collection. The CatalogService and Azure Cosmos DB combine to form a scale unit within a stamp.
The HPA is deployed with a Helm chart that has a configurable maximum number and minimum number of replicas. The load test determined that each instance can handle about 250 requests per second with a standard usage pattern.
The BackgroundProcessor service has different requirements and is considered a background worker that has a limited effect on the user experience. So BackgroundProcessor has a different automatic scaling configuration compared to CatalogService, and it can scale between 2 and 32 instances. Determine this limit based on the number of partitions that you use in the event hubs. You don't need more workers than partitions.
| Component | minReplicas |
maxReplicas |
|---|---|---|
| CatalogService | 3 | 20 |
| BackgroundProcessor | 2 | 32 |
Each component of the workload that includes dependencies like ingress-nginx has the pod disruption budgets (PDBs) setting configured to ensure that a minimum number of instances remain available when clusters change.
The following code block appears in the reference implementation:
#
# /src/app/charts/healthservice/templates/pdb.yaml
# Example pod distribution budget configuration.
#
apiVersion: policy/v1
kind: PodDisruptionBudget
metadata:
  name: {{ .Chart.Name }}-pdb
spec:
  minAvailable: 1
  selector:
    matchLabels:
      app: {{ .Chart.Name }}
Note
Determine the actual minimum number and maximum number of pods for each component through load testing. The number of pods can differ for each workload.
Instrumentation
Use instrumentation to evaluate performance bottle necks and health problems that workload components can introduce into the system. To help you quantify decisions, each component should emit sufficient information through metrics and trace logs. Consider the following key considerations when you instrument your application:
- Send logs, metrics, and other telemetry to the stamp's log system.
- Use structured logging instead of plain text so that you can query information.
- Implement event correlation to get an end-to-end transaction view. In the reference implementation, every API response contains an Operation ID as an HTTP header for traceability.
- Don't rely only on stdout logging, or console logging. But you can use these logs to immediately troubleshoot a failing pod.
This architecture implements distributed tracing with Application Insights and an Azure Monitor Logs workspace for application monitoring data. Use Azure Monitor Logs for logs and metrics of workload and infrastructure components. This architecture implements full end-to-end tracing of requests that come from the API, go through Event Hubs, and then to Azure Cosmos DB.
Important
Deploy stamp monitoring resources to a separate monitoring resource group. The resources have a different lifecycle than the stamp itself. For more information, see Monitoring data for stamp resources.

Application monitoring implementation details
The BackgroundProcessor component uses the Microsoft.ApplicationInsights.WorkerService NuGet package to get out-of-the-box instrumentation from the application. Serilog is also used for all logging inside the application. Application Insights is configured as a sink in addition to the console sink. A TelemetryClient instance for Application Insights is used directly only when it's necessary to track other metrics.
The following code block appears in the reference implementation:
//
// /src/app/AlwaysOn.BackgroundProcessor/Program.cs
//
public static IHostBuilder CreateHostBuilder(string[] args) =>
    Host.CreateDefaultBuilder(args)
    .ConfigureServices((hostContext, services) =>
    {
        Log.Logger = new LoggerConfiguration()
                            .ReadFrom.Configuration(hostContext.Configuration)
                            .Enrich.FromLogContext()
                            .WriteTo.Console(outputTemplate: "[{Timestamp:yyyy-MM-dd HH:mm:ss.fff zzz} {Level:u3}] {Message:lj} {Properties:j}{NewLine}{Exception}")
                            .WriteTo.ApplicationInsights(hostContext.Configuration[SysConfiguration.ApplicationInsightsConnStringKeyName], TelemetryConverter.Traces)
                            .CreateLogger();
    }

To demonstrate practical request traceability, every successful and unsuccessful API request returns the Correlation ID header to the caller. The application support team can search Application Insights with this identifier and get a detailed view of the full transaction, which is illustrated in the preceding diagram.
The following code block appears in the reference implementation:
//
// /src/app/AlwaysOn.CatalogService/Startup.cs
//
app.Use(async (context, next) =>
{
    context.Response.OnStarting(o =>
    {
        if (o is HttpContext ctx)
        {
            // ... code omitted for brevity
            context.Response.Headers.Add("Server-Location", sysConfig.AzureRegion);
            context.Response.Headers.Add("Correlation-ID", Activity.Current?.RootId);
            context.Response.Headers.Add("Requested-Api-Version", ctx.GetRequestedApiVersion()?.ToString());
        }
        return Task.CompletedTask;
    }, context);
    await next();
});
Note
Adaptive sampling is enabled by default in the Application Insights SDK. Adaptive sampling means that not every request is sent to the cloud and is searchable by ID. Mission-critical application teams need to reliably trace every request, which is why the reference implementation has adaptive sampling disabled in the production environment.
Kubernetes monitoring implementation details
You can use diagnostic settings to send AKS logs and metrics to Azure Monitor Logs. You can also use the container insights feature with AKS. Enable container insights to deploy the OMSAgentForLinux through a Kubernetes DaemonSet on each of the nodes in AKS clusters. The OMSAgentForLinux can collect more logs and metrics from within the Kubernetes cluster and send them to its corresponding Azure Monitor Logs workspace. This workspace contains granular data about pods, deployments, services, and the overall health of the cluster.
Extensive logging can negatively affect cost and doesn't provide benefits. For this reason, stdout log collection and Prometheus scraping are disabled for the workload pods in the container insights configuration because all traces are already captured through Application Insights, which generates duplicate records.
The following code block appears in the reference implementation:
#
# /src/config/monitoring/container-azm-ms-agentconfig.yaml
# This is just a snippet showing the relevant part.
#
[log_collection_settings]
    [log_collection_settings.stdout]
        enabled = false

        exclude_namespaces = ["kube-system"]
For more information, see the full configuration file.
Application health monitoring
You can use application monitoring and observability to quickly identify system problems and inform the health model about the current application state. You can surface health monitoring through health endpoints. Health probes use health monitoring data to provide information. The main load balancer uses that information to immediately take the unhealthy component out of rotation.
This architecture applies health monitoring at the following levels:
Workload pods that run on AKS. These pods have health and liveness probes, so AKS can manage their lifecycle.
Health Service, which is a dedicated component on the cluster. Azure Front Door is configured to probe Health Service in each stamp and remove unhealthy stamps from automatically load balancing.
Health Service implementation details
HealthService is a workload component that runs alongside other components, like CatalogService and BackgroundProcessor, on the compute cluster. HealthService provides a REST API that Azure Front Door health check calls to determine the availability of a stamp. Unlike basic liveness probes, Health Service is a more complex component that provides the state of dependencies in addition to its own state.

Health Service doesn't respond if the AKS cluster is down, which renders the workload unhealthy. When the service runs, it performs periodic checks against critical components of the solution. All checks are done asynchronously and in parallel. If any of the checks fail, the whole stamp is unavailable.
Warning
Azure Front Door health probes can impose significant load on Health Service because requests come from multiple point of presence (PoP) locations. To prevent overloading the downstream components, implement effective caching.
Health Service is also used for explicitly configured URL ping tests with each stamp's Application Insights resource.
For more information about the HealthService implementation, see Application Health Service.