Note
Access to this page requires authorization. You can try signing in or changing directories.
Access to this page requires authorization. You can try changing directories.
This article shows you how to render point data from a data source as a bubble layer on a map. Bubble layers render points as circles on the map with a fixed pixel radius.
Tip
Bubble layers by default will render the coordinates of all geometries in a data source. To limit the layer such that it only renders point geometry features set the filter property of the layer to ['==', ['geometry-type'], 'Point'] or ['any', ['==', ['geometry-type'], 'Point'], ['==', ['geometry-type'], 'MultiPoint']] if you want to include MultiPoint features as well.
Add a bubble layer
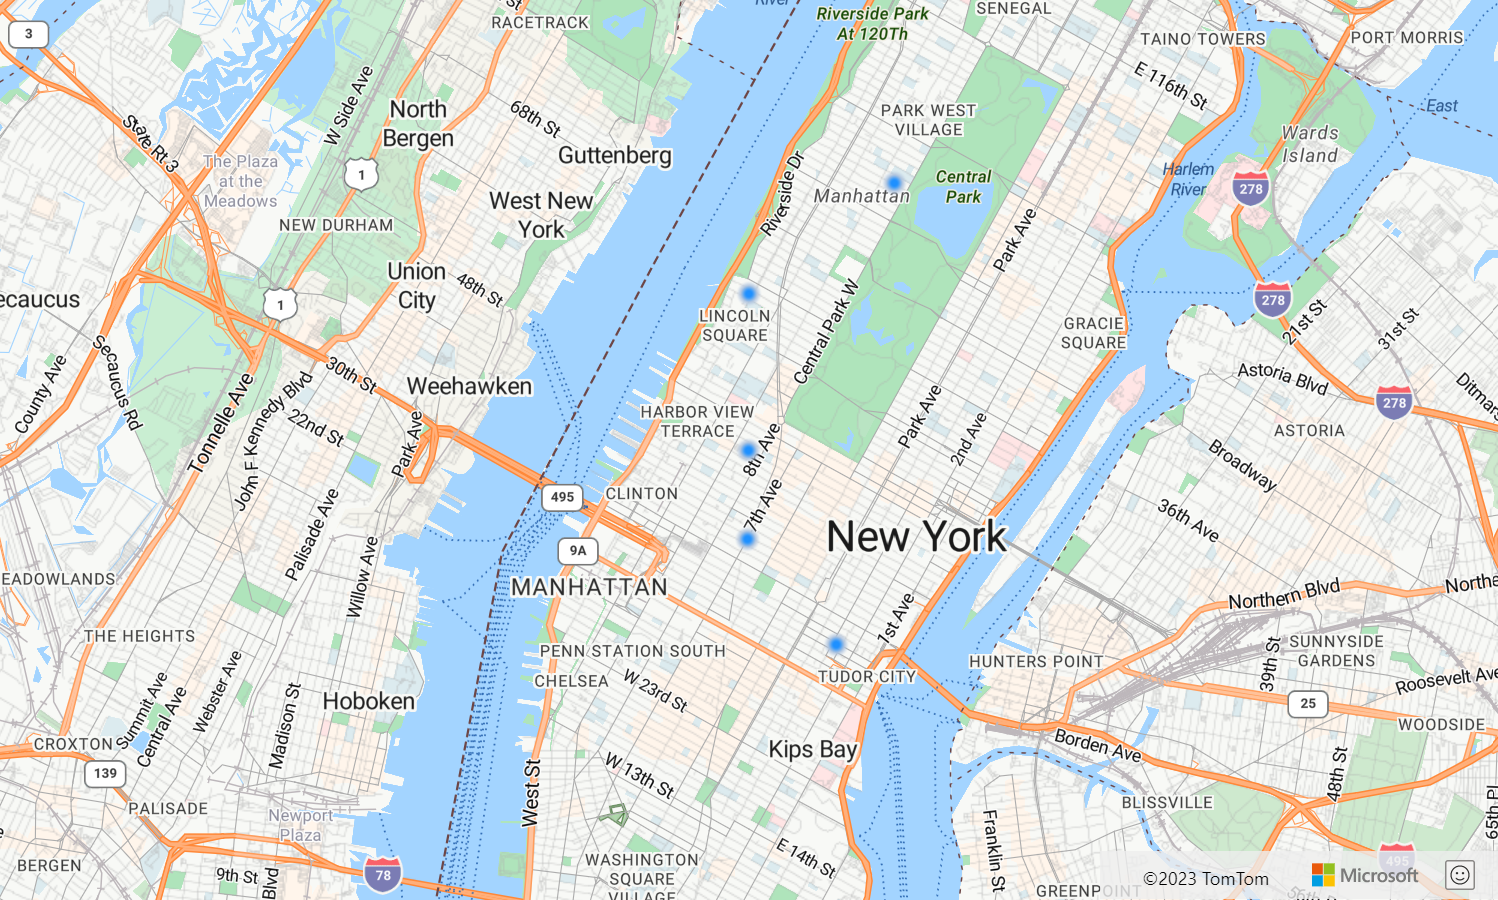
The following code loads an array of points into a data source. Then, it connects the data points are to a bubble layer. The bubble layer renders each bubble with a radius of six pixels and a stroke width of three pixels.
/*Ensure that the map is fully loaded*/
map.events.add("load", function () {

  /*Add point locations*/
  var points = [
    new atlas.data.Point([-73.985708, 40.75773]),
    new atlas.data.Point([-73.985600, 40.76542]),
    new atlas.data.Point([-73.985550, 40.77900]),
    new atlas.data.Point([-73.975550, 40.74859]),
    new atlas.data.Point([-73.968900, 40.78859])]

  /*Create a data source and add it to the map*/
  var dataSource = new atlas.source.DataSource();
  map.sources.add(dataSource);
  /*Add the points to the data source*/
  dataSource.add(points);

  //Create a bubble layer to render the filled in area of the circle, and add it to the map.*/
  map.layers.add(new atlas.layer.BubbleLayer(dataSource, null, {
    radius: 6,
    strokeColor: "LightSteelBlue",
    strokeWidth: 3,
    color: "DodgerBlue",
    blur: 0.5
  }));
});
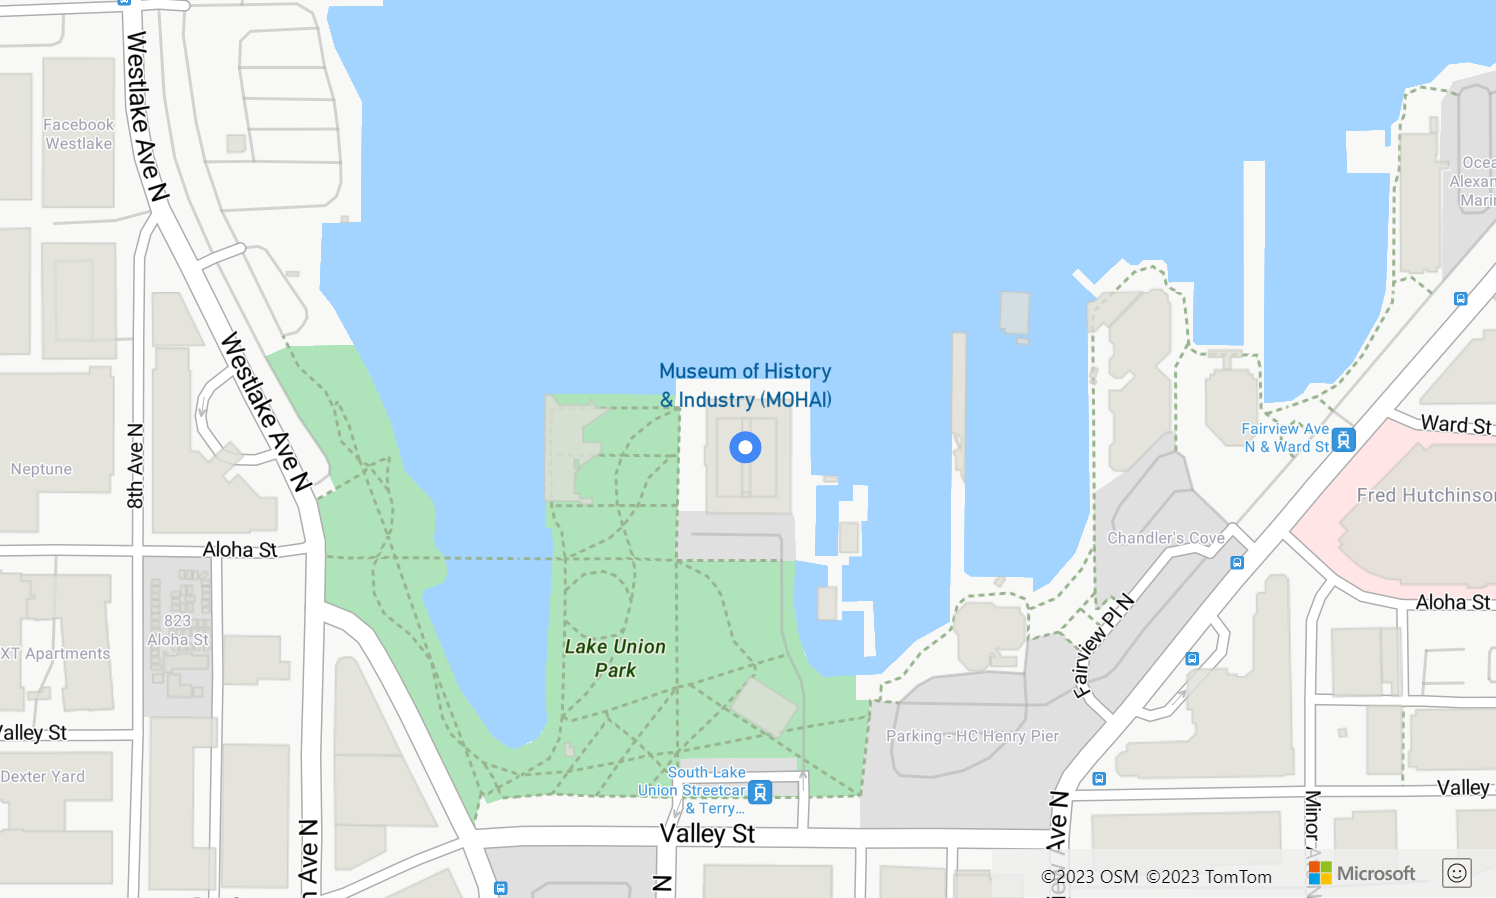
Show labels with a bubble layer
This code shows you how to use a bubble layer to render a point on the map and a symbol layer to render a label. To hide the icon of the symbol layer, set the image property of the icon options to none.
//Create an instance of the map control and set some options.
 function InitMap() {

    var map = new atlas.Map('myMap', {
    center: [-122.336641, 47.627631],
    zoom: 16,
    view: "Auto",
        authOptions: {
            authType: 'subscriptionKey',
            subscriptionKey: '{Your-Azure-Maps-Subscription-key}'
        }
    });

    /*Ensure that the map is fully loaded*/
    map.events.add("load", function () {

        /*Create point object*/
        var point =  new atlas.data.Point([-122.336641,47.627631]);

        /*Create a data source and add it to the map*/
        var dataSource = new atlas.source.DataSource();
        map.sources.add(dataSource);
        dataSource.add(point);

        map.layers.add(new atlas.layer.BubbleLayer(dataSource, null, {
            radius: 5,
            strokeColor: "#4288f7",
            strokeWidth: 6,
            color: "white"
        }));

        //Add a layer for rendering point data.
        map.layers.add(new atlas.layer.SymbolLayer(dataSource, null, {
            iconOptions: {
                //Hide the icon image.
                image: "none"
            },

            textOptions: {
                textField: "Museum of History & Industry (MOHAI)",
                color: "#005995",
                offset: [0, -2.2]
            },
        }));
    });
}
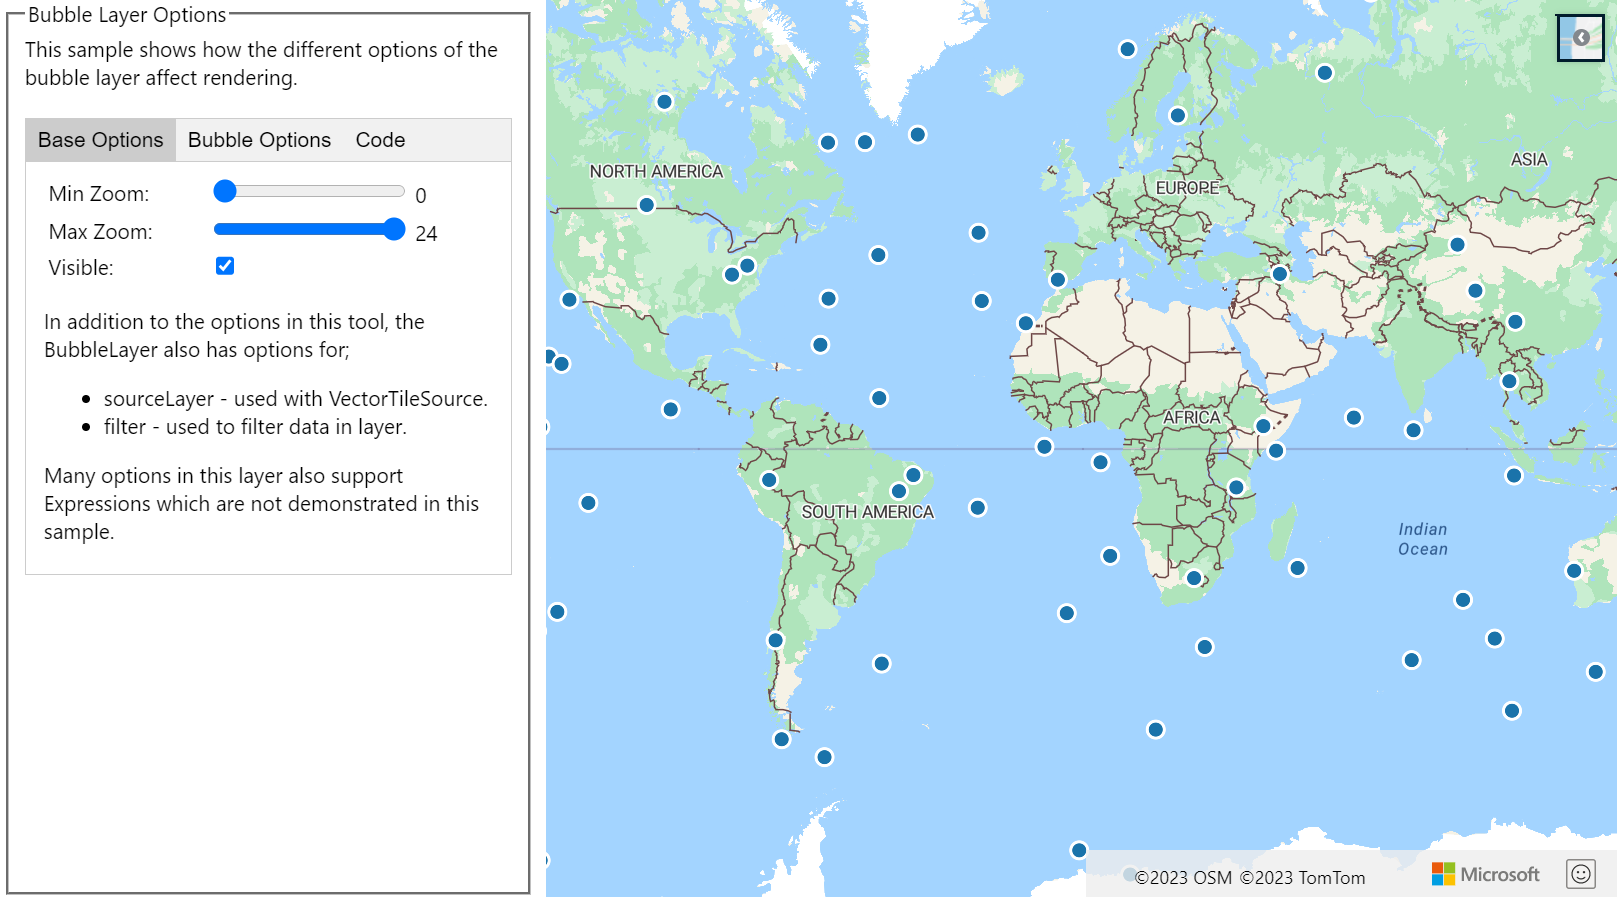
Customize a bubble layer
The Bubble layer only has a few styling options. Use the Bubble Layer Options sample to try them out. For the source code for this sample, see Bubble Layer Options source code.
Next steps
Learn more about the classes and methods used in this article:
See the following articles for more code samples to add to your maps: