Show traffic on the map
There are two types of traffic data available in Azure Maps:
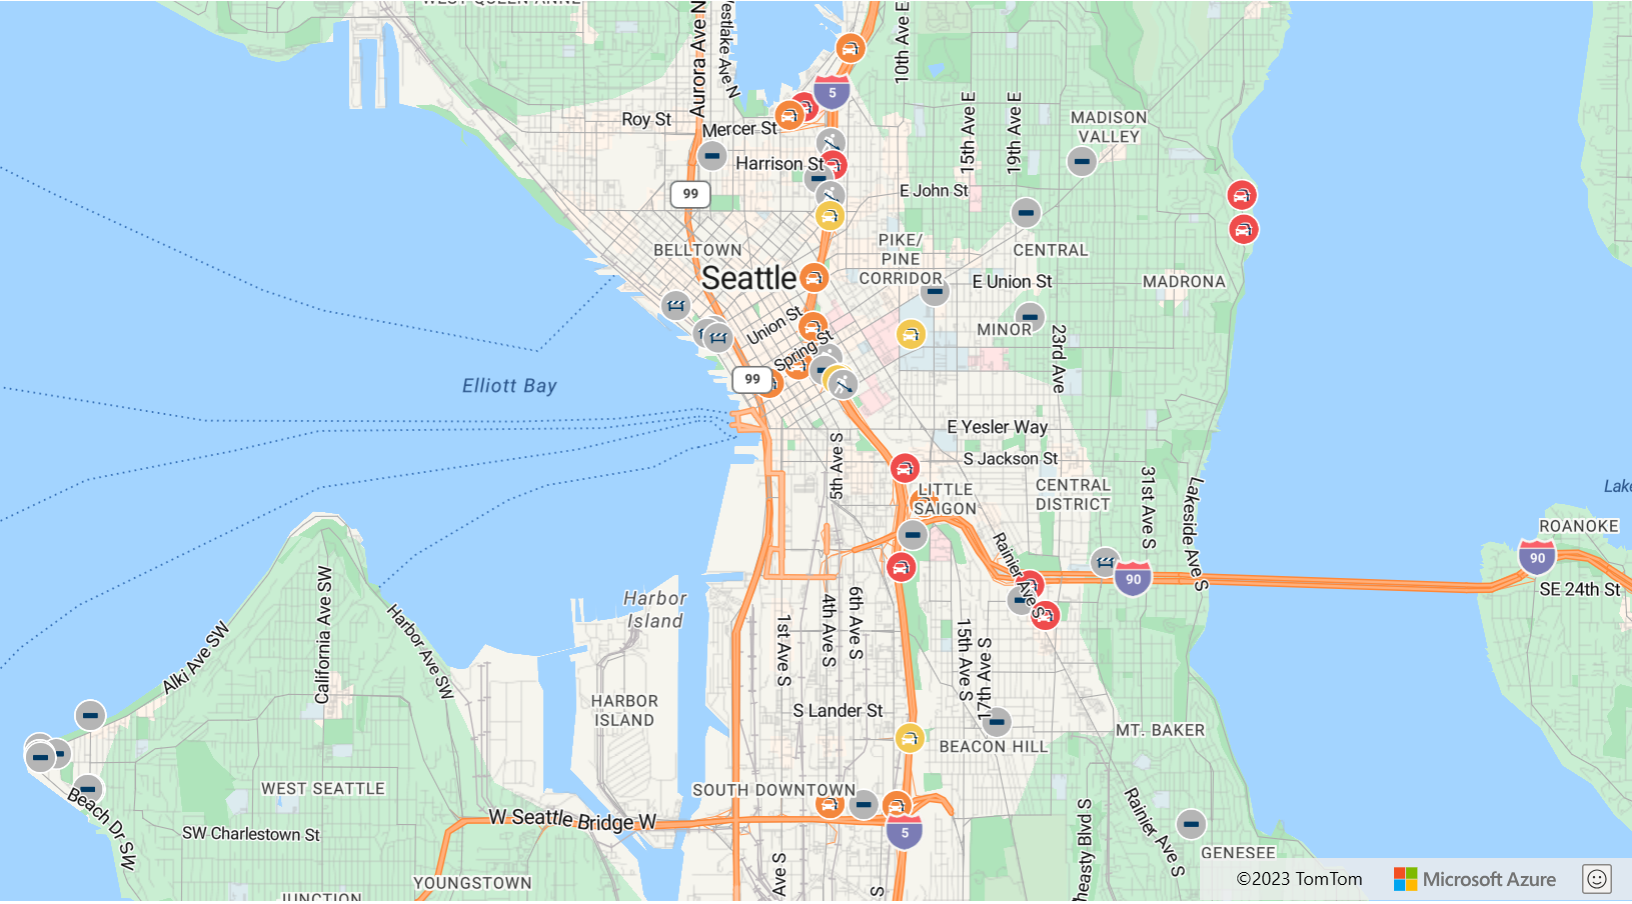
Incident data - consists of point and line-based data for things such as construction, road closures, and accidents.
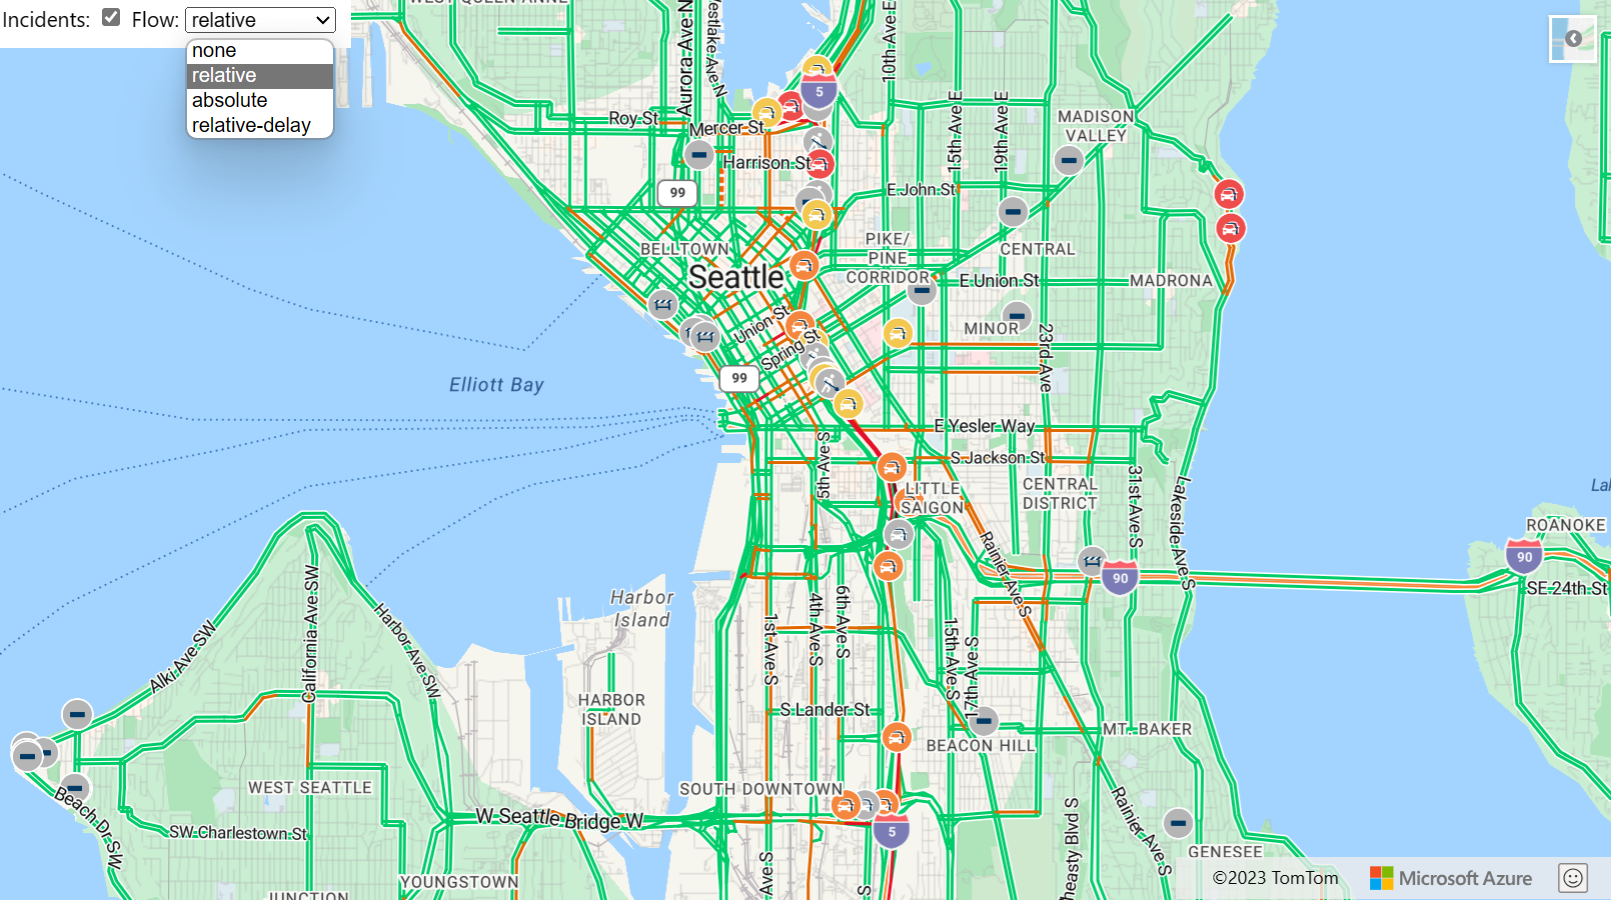
Flow data - provides metrics on the flow of traffic on the roads. Often, traffic flow data is used to color the roads. The colors are based on how much traffic is slowing down the flow, relative to the speed limit, or another metric. There are four values that can be passed into the traffic
flowoption of the map.Flow Value Description noneDoesn't display traffic data on the map relativeShows traffic data that's relative to the free-flow speed of the road relative-delayDisplays areas that are slower than the average expected delay absoluteShows the absolute speed of all vehicles on the road
The following code shows how to display traffic data on the map.
//Show traffic on the map using the traffic options.
map.setTraffic({
    incidents: true,
    flow: 'relative'
});
The Traffic Overlay sample demonstrates how to display the traffic overlay on a map. For the source code for this sample, see Traffic Overlay source code.
Traffic overlay options
The Traffic Overlay Options tool lets you switch between the different traffic overlay settings to see how the rendering changes. For the source code for this sample, see Traffic Overlay Options source code.
Add traffic controls
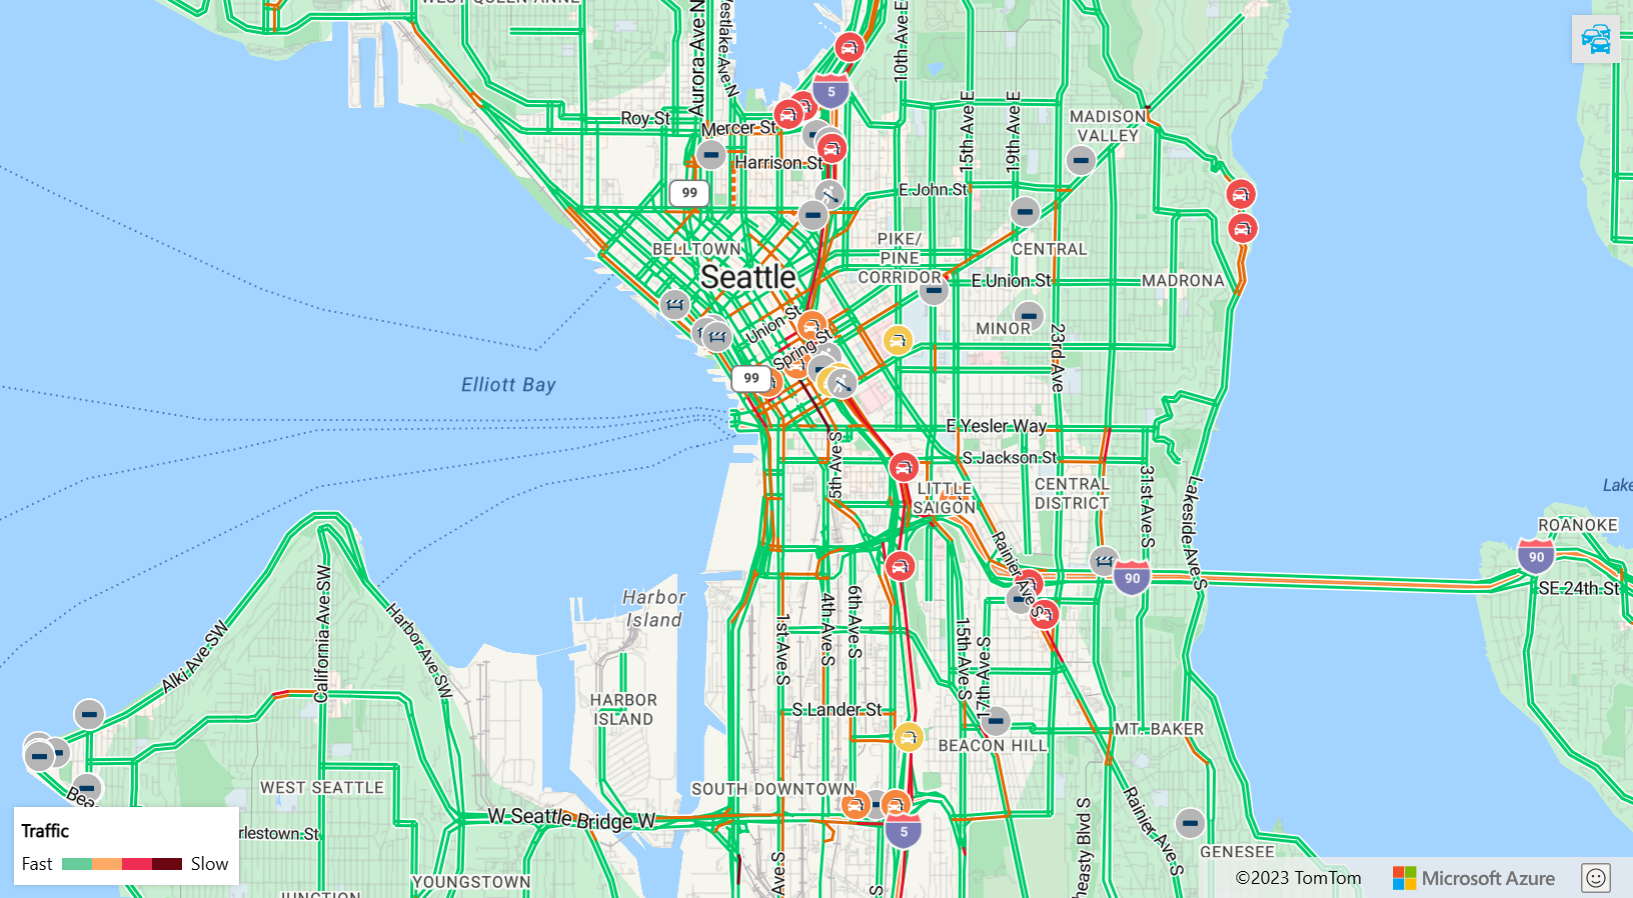
There are two different traffic controls that can be added to the map. The first control, TrafficControl, adds a toggle button that can be used to turn traffic on and off. Options for this control allow you to specify when traffic settings to use when show traffic. By default this control displays relative traffic flow and incident data, however, you could change this behavior and show absolute traffic flow and no incidents if desired. The second control, TrafficLegendControl, adds a traffic flow legend to the map that helps user understand what the color code road highlights mean. This control only appears on the map when traffic flow data is displayed on the map and is hidden at all other times.
The following code shows how to add the traffic controls to the map.
//Att the traffic control toogle button to the top right corner of the map.
map.controls.add(new atlas.control.TrafficControl(), { position: 'top-right' });

//Att the traffic legend control to the bottom left corner of the map.
map.controls.add(new atlas.control.TrafficLegendControl(), { position: 'bottom-left' });
The Traffic controls sample is a fully functional map that shows how to display traffic data on a map. For the source code for this sample, see Traffic controls source code.
Next steps
Learn more about the classes and methods used in this article:
Enhance your user experiences:


