Use resource logs to monitor SignalR Service
This article describes how you can use Azure Monitor features to analyze and troubleshoot the resource log monitoring data generated by Azure SignalR.
The Overview page in the Azure portal for each Azure SignalR Service includes a brief view of the resource usage, such as concurrent connections and message count. This helpful information is only a small amount of the monitoring data available in the portal. Some of this data is collected automatically and is available for analysis as soon as you create the resource.
You can enable other types of data collection after some configuration. This article walks through configuring log data collection and analyzing and troubleshooting this data by using Azure Monitor tools.
- For more information about monitoring Azure SignalR Service, see Monitor Azure SignalR Service.
- For a detailed listing of the metrics and logs collected for Azure SignalR Service, see Azure SignalR Service monitoring data reference.
Prerequisites
To enable resource logs, you need to set up a place to store your log data, such as Azure Storage or Log Analytics.
- Azure storage retains resource logs for policy audit, static analysis, or back up.
- Log Analytics is a flexible log search and analytics tool that allows for analysis of raw logs generated by an Azure resource.
Enable resource logs
Azure SignalR Service supports connectivity logs, messaging logs, and Http request logs. For more details about these types of logs, see Resource log categories. Logs are stored in the Storage account configured in the Diagnostics logs pane. For more details about the storage format and fields, see Data storage.
Create diagnostic settings
Resource logs are disabled by default. To enable resource logs by using diagnostic settings, see Create diagnostic settings in Azure Monitor.
Query resource logs
To query resource logs, follow these steps:
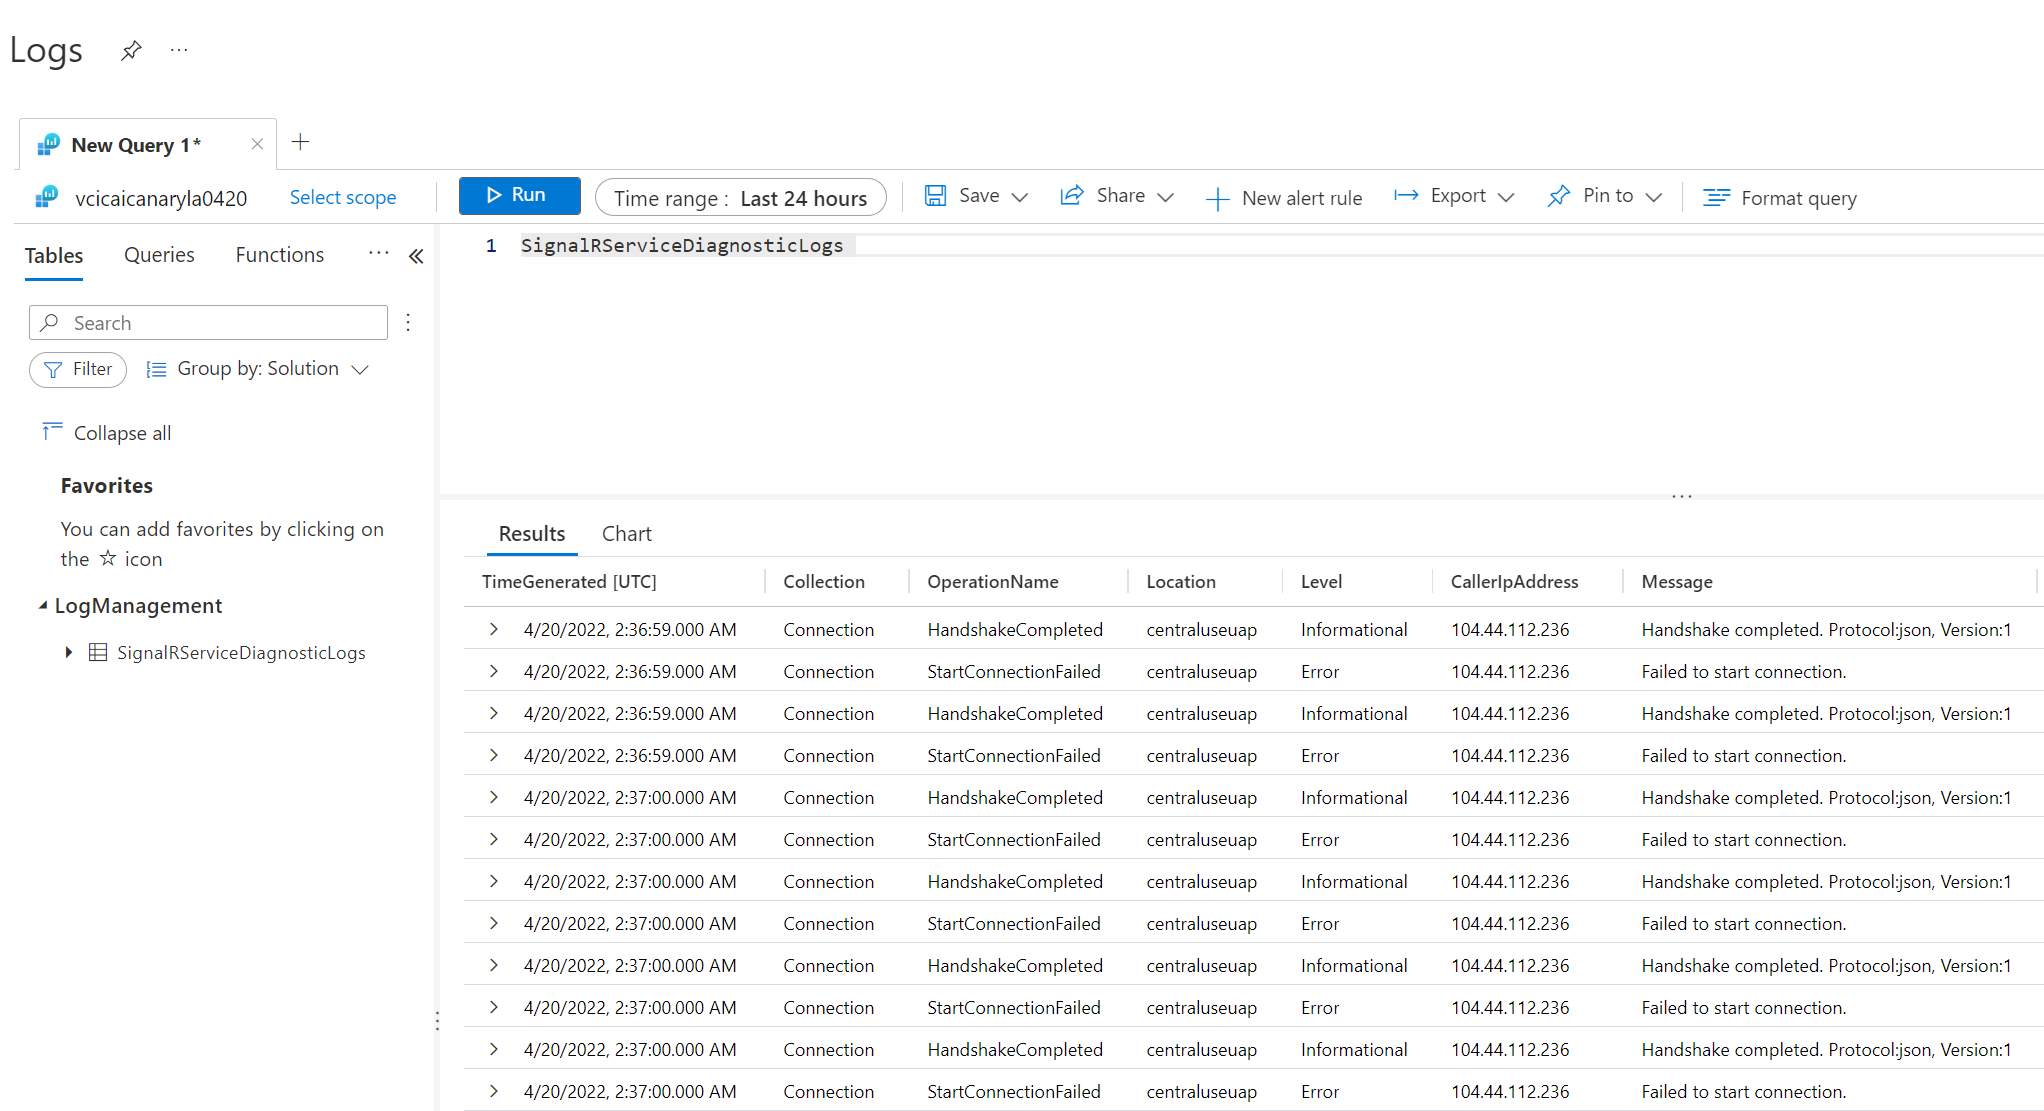
Select Logs in your target Log Analytics.
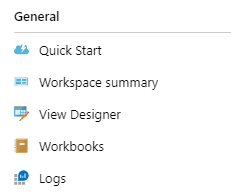
Enter SignalRServiceDiagnosticLogs and select time range. For advanced query, see Get started with Log Analytics in Azure Monitor

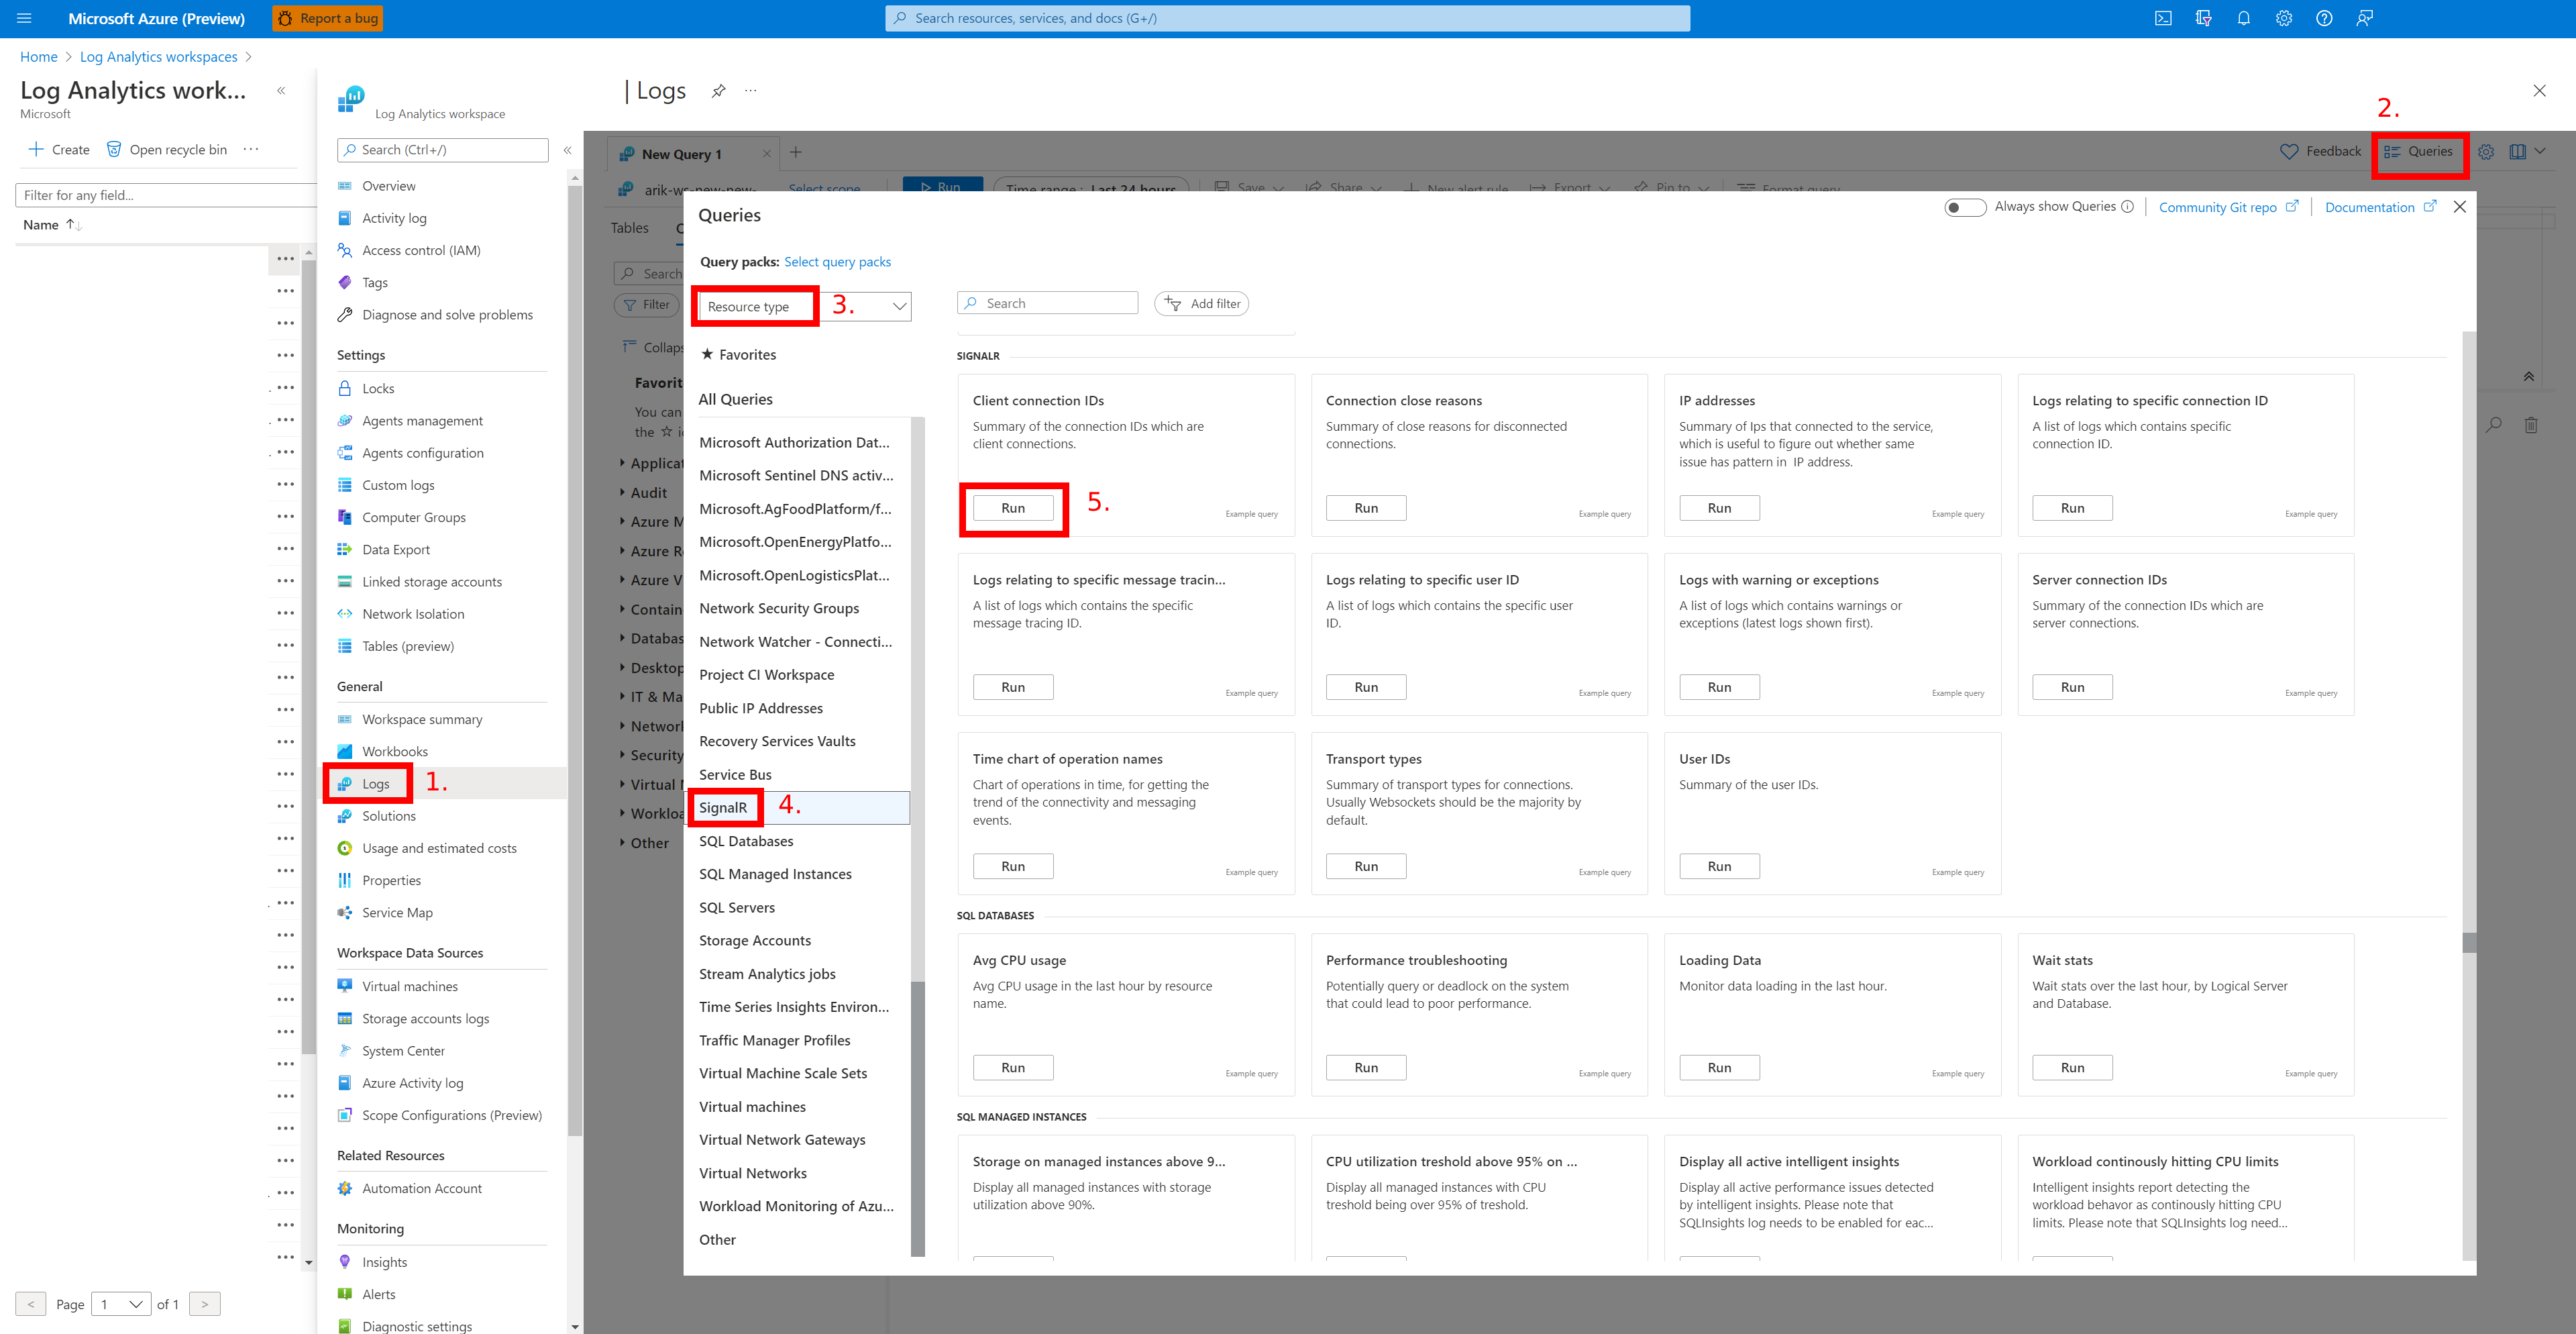
To use sample queries for Azure SignalR Service, follow these steps:
Select Logs in your target Log Analytics.
Select the Queries tab to open query explorer.
Select Resource type to group sample queries in resource type.
Select Run to run the script.

For example queries for Azure SignalR Service, see Queries for the SignalRServiceDiagnosticLogs table.
Note
Query field names for Storage destinations differ slightly from field names for Log Analytics. For details about the field name mappings between Storage and Log Analytics tables, see Resource Log table mapping.
Troubleshooting with resource logs
To troubleshoot Azure SignalR Service, you can enable server/client side logs to capture failures. When Azure SignalR Service exposes resource logs, you can take advantage of resource logs to troubleshoot logs for the service.
Connection related issues
When you encounter connections unexpectedly growing or dropping, you can take advantage of connectivity logs to troubleshoot. Typical issues often involve unexpected connection quantity changes, connections reach connection limits, and authorization failure. The following sections describe how to troubleshoot.
Unexpected connection dropping
If you encounter unexpected connections drop, first enable logs in service, server, and client sides.
If a connection disconnects, the resource logs record this disconnecting event, and you see ConnectionAborted or ConnectionEnded in operationName.
The difference between ConnectionAborted and ConnectionEnded is that ConnectionEnded is an expected disconnecting, which is triggered by client or server side. The ConnectionAborted is usually an unexpected connection dropping event, and the aborting reason is provided in message.
The following table lists the abort reasons.
| Reason | Description |
|---|---|
| Connection count reaches limit | Connection count reaches limit of your current price tier. Consider scale up service unit |
| Application server closed the connection | App server triggers the abortion. It can be considered as an expected abortion |
| Connection ping timeout | Usually it's caused by network issue. Consider checking your app server's availability from the internet |
| Service reloading, try reconnecting | Azure SignalR Service is reloading. Azure SignalR support auto-reconnecting, you can wait until reconnected or manually reconnect to Azure SignalR Service |
| Internal server transient error | Transient error occurs in Azure SignalR Service, should be auto-recovered |
| Server connection dropped | Server connection drops with unknown error, consider self-troubleshooting with service/server/client side log first. Try to exclude basic issues (e.g Network issue, app server side issue, etc.). If the issue isn't resolved, contact us for further help. For more information, see Get help section. |
Unexpected connection growing
To troubleshoot about unexpected connection growing, the first thing you need to do is filter out the extra connections. You can add a unique test user ID to your test client connection. Check the resource logs. If you see more than one client connections have the same test user ID or IP, it's likely the client side is creating more connections than expected. Check your client side.
Authorization failure
If you get 401 Unauthorized returned for client requests, check your resource logs. If you encounter Failed to validate audience. Expected Audiences: <valid audience>. Actual Audiences: <actual audience>, it means all audiences in your access token are invalid. Try to use the valid audiences suggested in the log.
Throttling
If you find that you can't establish SignalR client connections to Azure SignalR Service, check your resource logs. If you encounter Connection count reaches limit in resource log, you establish too many connections to SignalR Service, which reach the connection count limit. Consider scaling up your SignalR Service. If you encounter Message count reaches limit in resource log, it means you use free tier, and you used up the quota of messages. If you want to send more messages, consider changing your SignalR Service to standard tier. For more information, see Azure SignalR Service pricing.
Message-related issues
When encountering message related problems, you can take advantage of messaging logs to troubleshoot. First, enable resource logs in service and logs for server and client.
Note
For ASP.NET Core, see here to enable logging in server and client.
For ASP.NET, see here to enable logging in server and client.
If you don't mind potential performance effects and no client-to-server direction message, check the Messaging in Log Source Settings/Types to enable collect-all log collecting behavior. For more information about this behavior, see collect all .
Otherwise, uncheck the Messaging to enable collect-partially log collecting behavior. This behavior requires configuration in client and server to enable it. For more information, see collect partially.
Message loss
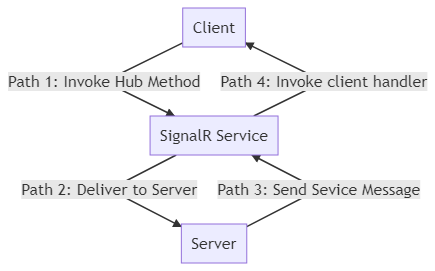
If you encounter message loss problems, the key is to locate the place where you lose the message. Basically, you have three components when using Azure SignalR Service: SignalR service, server, and client. Both server and client are connected to SignalR service but don't connect to each other directly once negotiation is completed. Therefore, you need to consider two directions for messages, and for each direction you need to consider two paths:
- From client to server via SignalR service
- Path 1: Client to SignalR service
- Path 2: SignalR service to server
- From server to client via SignalR service
- Path 3: Server to SignalR service
- Path 4: SignalR service to client
For collect all collecting behavior:
Azure SignalR Service only traces messages in the direction from server to client via SignalR service. The tracing ID is generated in server. The message carries the tracing ID to the SignalR service.
Note
If you want to trace message and send messages from outside a hub in your app server, you need to enable collect all collecting behavior to collect message logs for the messages which are not originated from diagnostic clients. Diagnostic clients work for both collect all and collect partially collecting behaviors, but has higher priority to collect logs. For more information, see diagnostic client section.
By checking the sign-in server and service side, you can easily find out whether the message is sent from server, arrives at SignalR service, and leaves from SignalR service. Basically, by checking if the received and sent message are matched or not based on message tracing ID, you can tell whether the message loss issue is in server or SignalR service in this direction. For more information, see the details below.
For collect partially collecting behavior:
Once you mark the client as diagnostic client, Azure SignalR Service traces messages in both directions.
By checking the sign-in server and service side, you can easily find out whether the message is pass the server or SignalR service successfully. Basically, by checking if the received and sent message are matched or not based on message tracing ID, you can tell whether the message loss issue is in server or SignalR service. For more information, see the following details.
Details of the message flow
For the direction from client to server via SignalR service, SignalR service only considers the invocation that is originated from diagnostic client, that is, the message generated directly in diagnostic client, or service message generated due to the invocation of diagnostic client indirectly.
The tracing ID is generated in SignalR service once the message arrives at SignalR service in Path 1. SignalR service generates a log Received a message <MessageTracingId> from client connection <ConnectionId>. for each message in diagnostic client. Once the message leaves from the SignalR to server, SignalR service generates a log message Sent a message <MessageTracingId> to server connection <ConnectionId> successfully.. If you see these two logs, you can be sure that the message passes through SignalR service successfully.
Note
Due to the limitation of ASP.NET Core SignalR, the message comes from client doesn't contains any message level ID, but ASP.NET SignalR generates invocation ID for each message. You can use it to map with the tracing ID.
Then the message carries the tracing ID Server in Path 2. Server generates a log Received message <messagetracingId> from client connection <connectionId> once the message arrives.
Once the message invokes the hub method in server, a new service message is generated with a new tracing ID. Once the service message is generated, server generates a sign-in template Start to broadcast/send message <MessageTracingId> .... The actual log is based on your scenario. Then the message is delivered to SignalR service in Path 3. Once the service message leaves from server, a log called Succeeded to send message <MessageTracingId> is generated.
Note
The tracing ID of the message from client can't map to the tracing ID of the service message to be sent to SignalR service.
Once the service message arrives at SignalR service, a log called Received a <MessageType> message <MessageTracingId> from server connection <ConnectionId>. is generated. Then SignalR service processes the service message and deliver to the target client(s). Once the message is sent to client(s) in Path 4, log Sent a message <MessageTracingId> to client connection <ConnectionId> successfully. is generated.
In summary, the message log is generated when message goes in and out of the SignalR service and server. You can use these logs to validate whether the message is lost in these components or not.
The following example is a typical message loss issue.
A client fails to receive messages in a group
The typical story in this issue is that the client joins a group after sending a group message.
Class Chat : Hub
{
    public void JoinAndSendGroup(string name, string groupName)
    {
        Groups.AddToGroupAsync(Context.ConnectionId, groupName); // join group
        Clients.Group(groupName).SendAsync("ReveiceGroupMessage", name, "I'm in group"); // send group message
    }
}
For example, someone may make invocations of join group and send group message in the same hub method. The problem here is the AddToGroupAsync is an async method. Because there's no await for the AddToGroupAsync to wait until it finishes, the group message sends before AddToGroupAsync completes. Due to network delay, and the delay of the process of joining client to some group, the join group action may complete later than group message delivery. If so, the first group message doesn't have any client as receiver, since no client has joined the group, so it becomes a message lost issue.
Without resource logs, you're unable to find out when the client joins the group and when the group message is sent. Once you enable messaging logs, you're able to compare the message arriving time in SignalR service. Do the following steps to troubleshoot:
- Find the message logs in server to find when the client joined the group and when the group message is sent.
- Get the message tracing ID A of joining the group and the message tracing ID B of group message from the message logs.
- Filter these message tracing ID among messaging logs in your log archive target, then compare their arriving timestamps. You find which message arrived first in SignalR service.
- If message tracing ID A arriving time is later than B arriving time, you must be sending group message before the client joining the group. You need to make sure the client is in the group before sending group messages.
If a message gets lost in SignalR or server, try to get the warning logs based on the message tracing ID to get the reason. If you need further help, see the get help section.
Resource logs collecting behaviors
There are two typical scenarios for using resource logs, especially for messaging logs.
Someone may care about the quality of each message. For example, they're sensitive on whether the message got sent/received successfully, or they want to record every message that is delivered via SignalR service.
In the meantime, others may care about the performance. They're sensitive on the latency of the message, and sometimes they need to track the message in a few connections instead of all the connections for some reason.
Therefore, SignalR service provides two kinds of collecting behaviors
- collect all: collect logs in all connections
- collect partially: collect logs in some specific connections
Note
To distinguish the connections between those collect logs and those don't collect logs, SignalR service treats some client as diagnostic client based on the diagnostic client configurations of server and client, in which the resource logs always get collected, while the others don't. For more information, see collect partially section.
Collect all
Resource logs are collected by all the connections. Take messaging logs for example. When this behavior is enabled, SignalR service sends a notification to server to start generating tracing ID for each message. The tracing ID is carried in the message to the service. The service also logs the message with tracing ID.
Note
Note that to ensure the performance of SignalR service, SignalR service doesn't await and parse the whole message sent from client. Therefore, the client messages doesn't get logged. If the client is marked as a diagnostic client, the client message is logged in SignalR service.
Configuration guide
To enable this behavior, check the checkbox in the Types section in the Log Source Settings.
This behavior doesn't require you to update server side configurations. This configuration change is always sent to server automatically.
Collect partially
Resource logs are only collected by diagnostic clients. All messages get logged including client messages and connectivity events in the diagnostic clients.
Note
The limit of the diagnostic clients' number is 100. If the number of diagnostic clients exceeds 100, the outnumbered diagnostic clients get throttled by SignalR service. The new but outnumbered clients fail to connect to SignalR service, and throw System.Net.Http.HttpRequestException, which has the message Response status code does not indicate success: 429 (Too Many Requests). The already connected clients work without getting impacted by the throttling policy.
Diagnostic client
Diagnostic client is a logical concept. Any client can be a diagnostic client. The server controls which client can be a diagnostic client. Once a client is marked as a diagnostic client, all resource logs are enabled in this client. To set a client be a diagnostic client, see the configuration guide.
Configuration guide
To enable this behavior, you need to configure service, server, and client side.
Service side
To enable this behavior, uncheck the checkbox for a specific log type in the Types section in the Log Source Settings.
Server side
Also set up ServiceOptions.DiagnosticClientFilter to define a filter of diagnostic clients based on the http context comes from clients. For example, make client with hub URL <HUB_URL>?diag=yes, then set up ServiceOptions.DiagnosticClientFilter to filter the diagnostic client. If it returns true, the client is marked as diagnostic client. Otherwise, it stays as normal client. The ServiceOptions.DiagnosticClientFilter can be set in your startup class like this:
// sample: mark a client as diagnostic client when it has query string "?diag=yes" in hub URL
public IServiceProvider ConfigureServices(IServiceCollection services)
{
    services.AddMvc();
    services
        .AddSignalR()
        .AddAzureSignalR(o =>
        {
            o.ConnectionString = "<YOUR_ASRS_CONNECTION_STRING>";
            o.DiagnosticClientFilter = context => context.Request.Query["diag"] == "yes";
        });

    return services.BuildServiceProvider();
}
Client side
Mark the client as diagnostic client by configuring the http context. For example, the client is marked as diagnostic client by adding the query string diag=yes.
var connection = new HubConnectionBuilder()
    .WithUrl("<HUB_URL>?diag=yes")
    .Build();
Get help
We recommend you troubleshoot by yourself first. Most issues are caused by app server or network issues. Follow troubleshooting guide with resource log and basic troubleshooting guide to find the root cause. If the issue still can't be resolved, then consider opening an issue in GitHub or create ticket in Azure portal. Provide:
- Time range about 30 minutes when the issue occurs
- Azure SignalR Service's resource ID
- Issue details, as specific as possible: For example, appserver doesn't send messages, client connection drops, and so on
- Logs collected from server/client side, and other material that might be useful
- [Optional] Repro code
Note
If you open an issue in GitHub, keep your sensitive information (for example, resource ID, server/client logs) private. Only send to members in Microsoft organization privately.