Note
Access to this page requires authorization. You can try signing in or changing directories.
Access to this page requires authorization. You can try changing directories.
When you have critical applications and business processes that rely on Azure resources, you want to monitor those resources for availability, performance, and operation. This article describes the monitoring data generated by Azure Web PubSub and how you can use the features of Azure Monitor to analyze and alert on this data.
Monitor overview
The Overview page in the Azure portal for each Azure Web PubSub includes a brief view of the resource usage, such as concurrent connections and outbound traffic. This information is helpful. It's only a small amount of the monitoring data is available from this pane. Some of this data is collected automatically. It's available for analysis as soon as you create the resource. You can enable other types of data collection after some configuration.
What is Azure Monitor?
Azure Web PubSub creates monitoring data using Azure Monitor. Monitor is a full stack monitoring service in Azure that provides a complete set of features to monitor your Azure resources in addition to resources in other clouds and on-premises.
If you're not already familiar with monitoring Azure services, start with Monitoring Azure resources with Azure Monitor, which describes the following concepts:
- What is Azure Monitor?
- Costs associated with monitoring
- Monitoring data collected in Azure
- Configuring data collection
- Standard tools in Azure for analyzing and alerting on monitoring data
The following sections build on this article. They describe the specific data gathered from Azure Web PubSub and provide examples for configuring data collection and analyzing this data with Azure tools.
Monitoring data
Azure Web PubSub collects the same kinds of monitoring data as other Azure resources that are described in Azure Monitor data collection.
See Monitor Azure Web PubSub data reference for detailed information on the metrics and logs metrics created by Azure Web PubSub.
Collection and routing
Platform metrics and the Activity log are collected and stored automatically, but can be routed to other locations by using a diagnostic setting.
Resource Logs aren't collected and stored until you create a diagnostic setting and route them to one or more locations.
See Create diagnostic setting to collect platform logs and metrics in Azure for the detailed process for creating a diagnostic setting using the Azure portal, CLI, or PowerShell. When you create a diagnostic setting, you specify which categories of logs to collect.
The metrics and logs you can collect are discussed in the following sections.
Analyzing metrics
You can analyze metrics for Azure Web PubSub with metrics from other Azure services using metrics explorer by opening Metrics from the Azure Monitor menu. See Analyze metrics with Azure Monitor metrics explorer for details on using this tool.
For a list of the platform metrics collected for Azure Web PubSub, see Metrics.
For reference, you can see a list of all resource metrics supported in Azure Monitor.
Analyzing logs
Data in Azure Monitor Logs is stored in tables where each table has its own set of unique properties.
All resource logs in Azure Monitor have the same fields followed by service-specific fields. The common schema is outlined in Azure Monitor resource log schema.
Azure Web PubSub collects three types of resource logs: Connectivity, Messaging, and HTTP requests.
- Connectivity logs provide detailed information for Azure Web PubSub hub connections. For example, basic information (user ID, connection ID, and so on) and event information (connect, disconnect, and so on).
- Messaging logs provide tracing information for the Azure Web PubSub hub messages received and sent via Azure Web PubSub service. For example, tracing ID and message type of the message.
- HTTP requests logs provide tracing information for HTTP requests to the Azure Web PubSub service. For example, HTTP method and status code. Typically the HTTP request is recorded when it arrives at or leave from service.
How to enable resource logs
Currently Azure Web PubSub supports integration with Azure Storage.
Go to Azure portal.
On Diagnostic settings page of your Azure Web PubSub service instance, select + Add diagnostic setting.
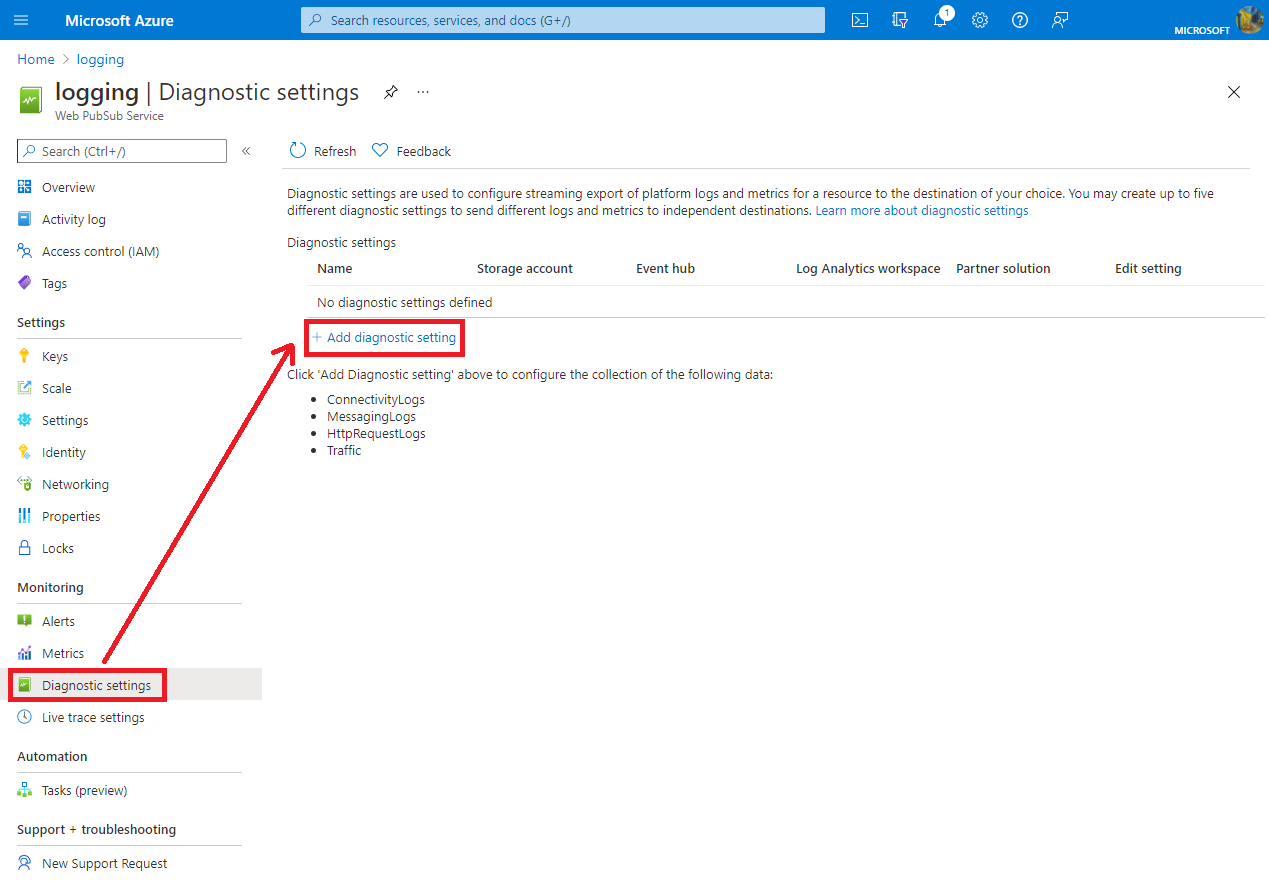
In Diagnostic setting name, input the setting name.
In Category details, select any log category you need.
In Destination details, check Archive to a storage account.
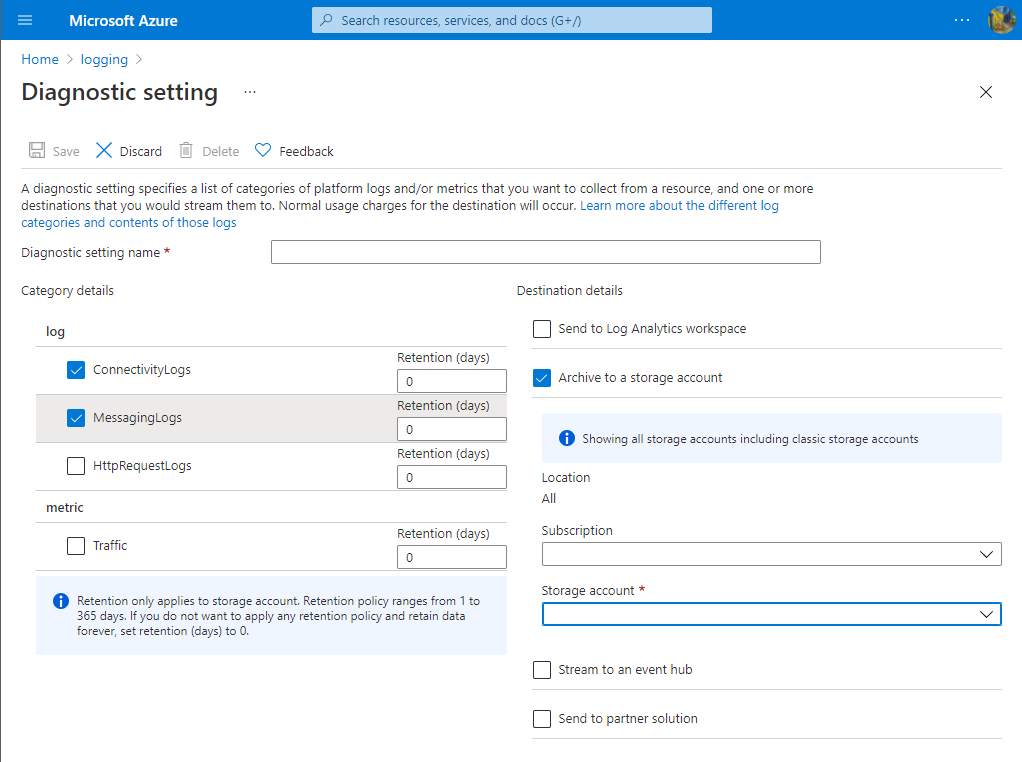
Select Save to save the diagnostic setting.
Note
The storage account should be in the same region as Azure Web PubSub service.
Archive to an Azure Storage Account
Logs are stored in the storage account that's configured in the Diagnostics setting pane. A container named insights-logs-<CATEGORY_NAME> is created automatically to store resource logs. Inside the container, logs are stored in the file resourceId=/SUBSCRIPTIONS/XXXXXXXX-XXXX-XXXX-XXXX-XXXXXXXXXXXX/RESOURCEGROUPS/XXXX/PROVIDERS/MICROSOFT.SIGNALRSERVICE/SIGNALR/XXX/y=YYYY/m=MM/d=DD/h=HH/m=00/PT1H.json. The path is combined by resource ID and Date Time. The log files are split by hour. The minute value is always m=00.
Archive to Azure Log Analytics
To send logs to a Log Analytics workspace:
- On the Diagnostic setting page, under Destination details, select **Send to Log Analytics workspace.
- Select the Subscription you want to use.
- Select the Log Analytics workspace to use as the destination for the logs.
To view the resource logs, follow these steps:
Select
Logsin your target Log Analytics.
Enter
WebPubSubConnectivity,WebPubSubMessagingorWebPubSubHttpRequest, and then select the time range to query the log. For advanced queries, see Get started with Log Analytics in Azure Monitor.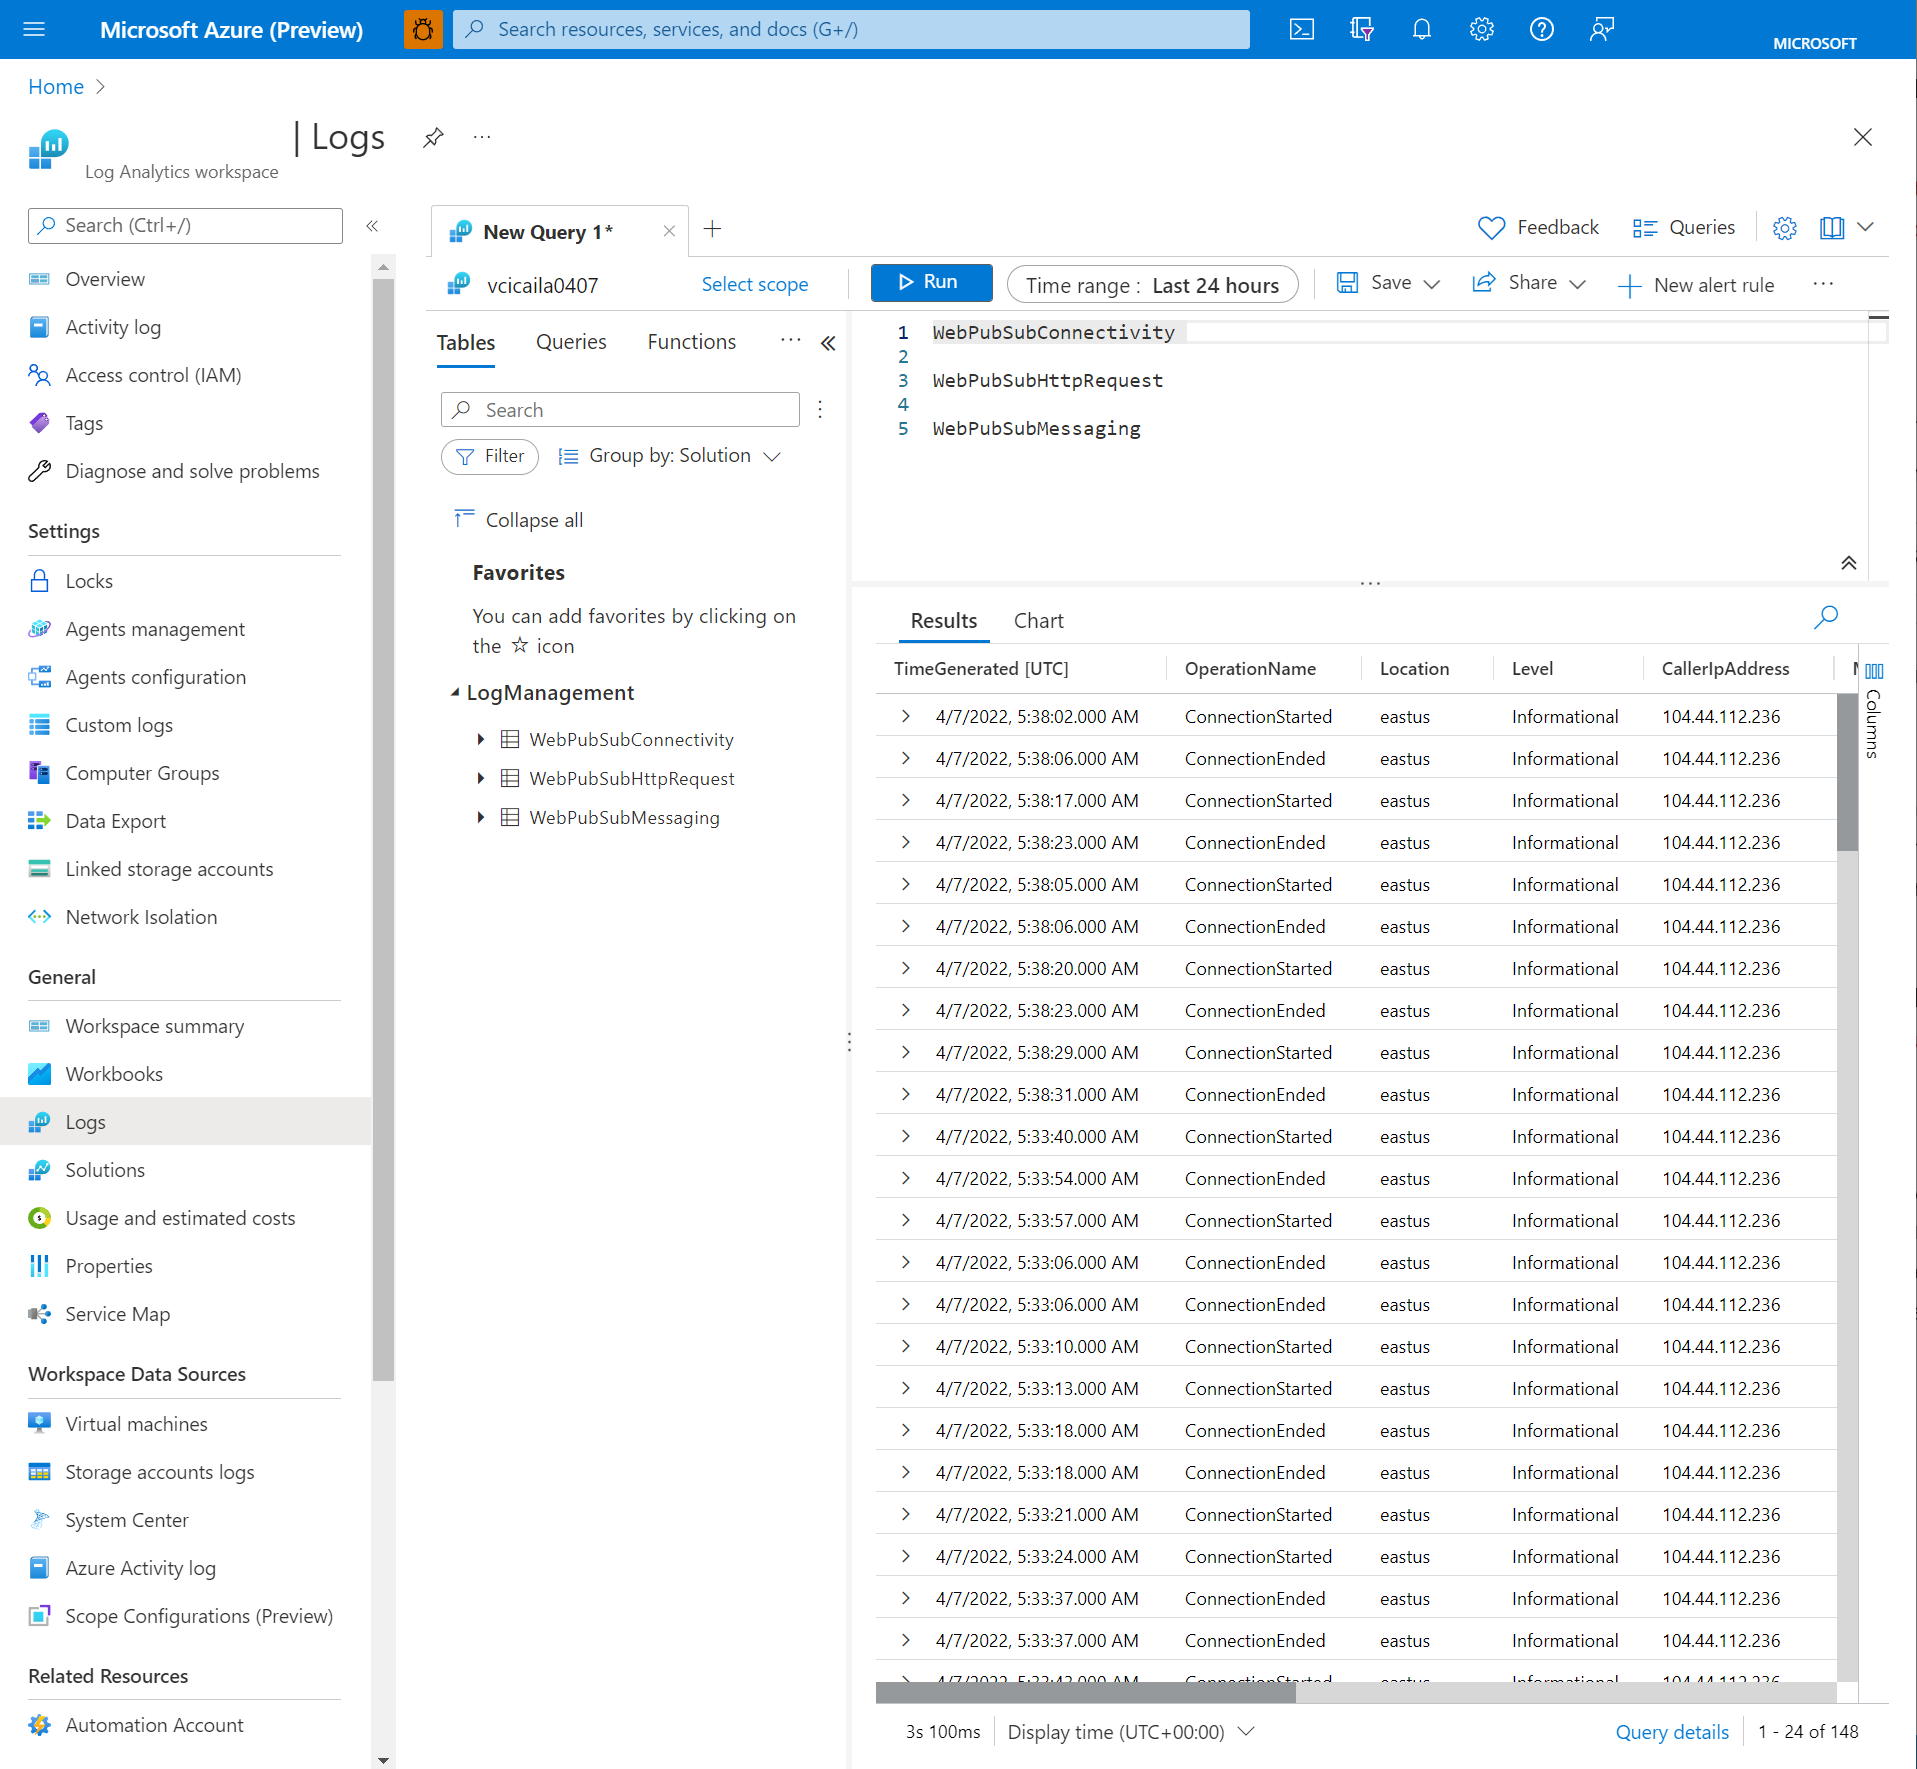


To use a sample query for SignalR service, follow the steps below.
- Select
Logsin your target Log Analytics. - Select
Queriesto open query explorer. - Select
Resource typeto group sample queries in resource type. - Select
Runto run the script.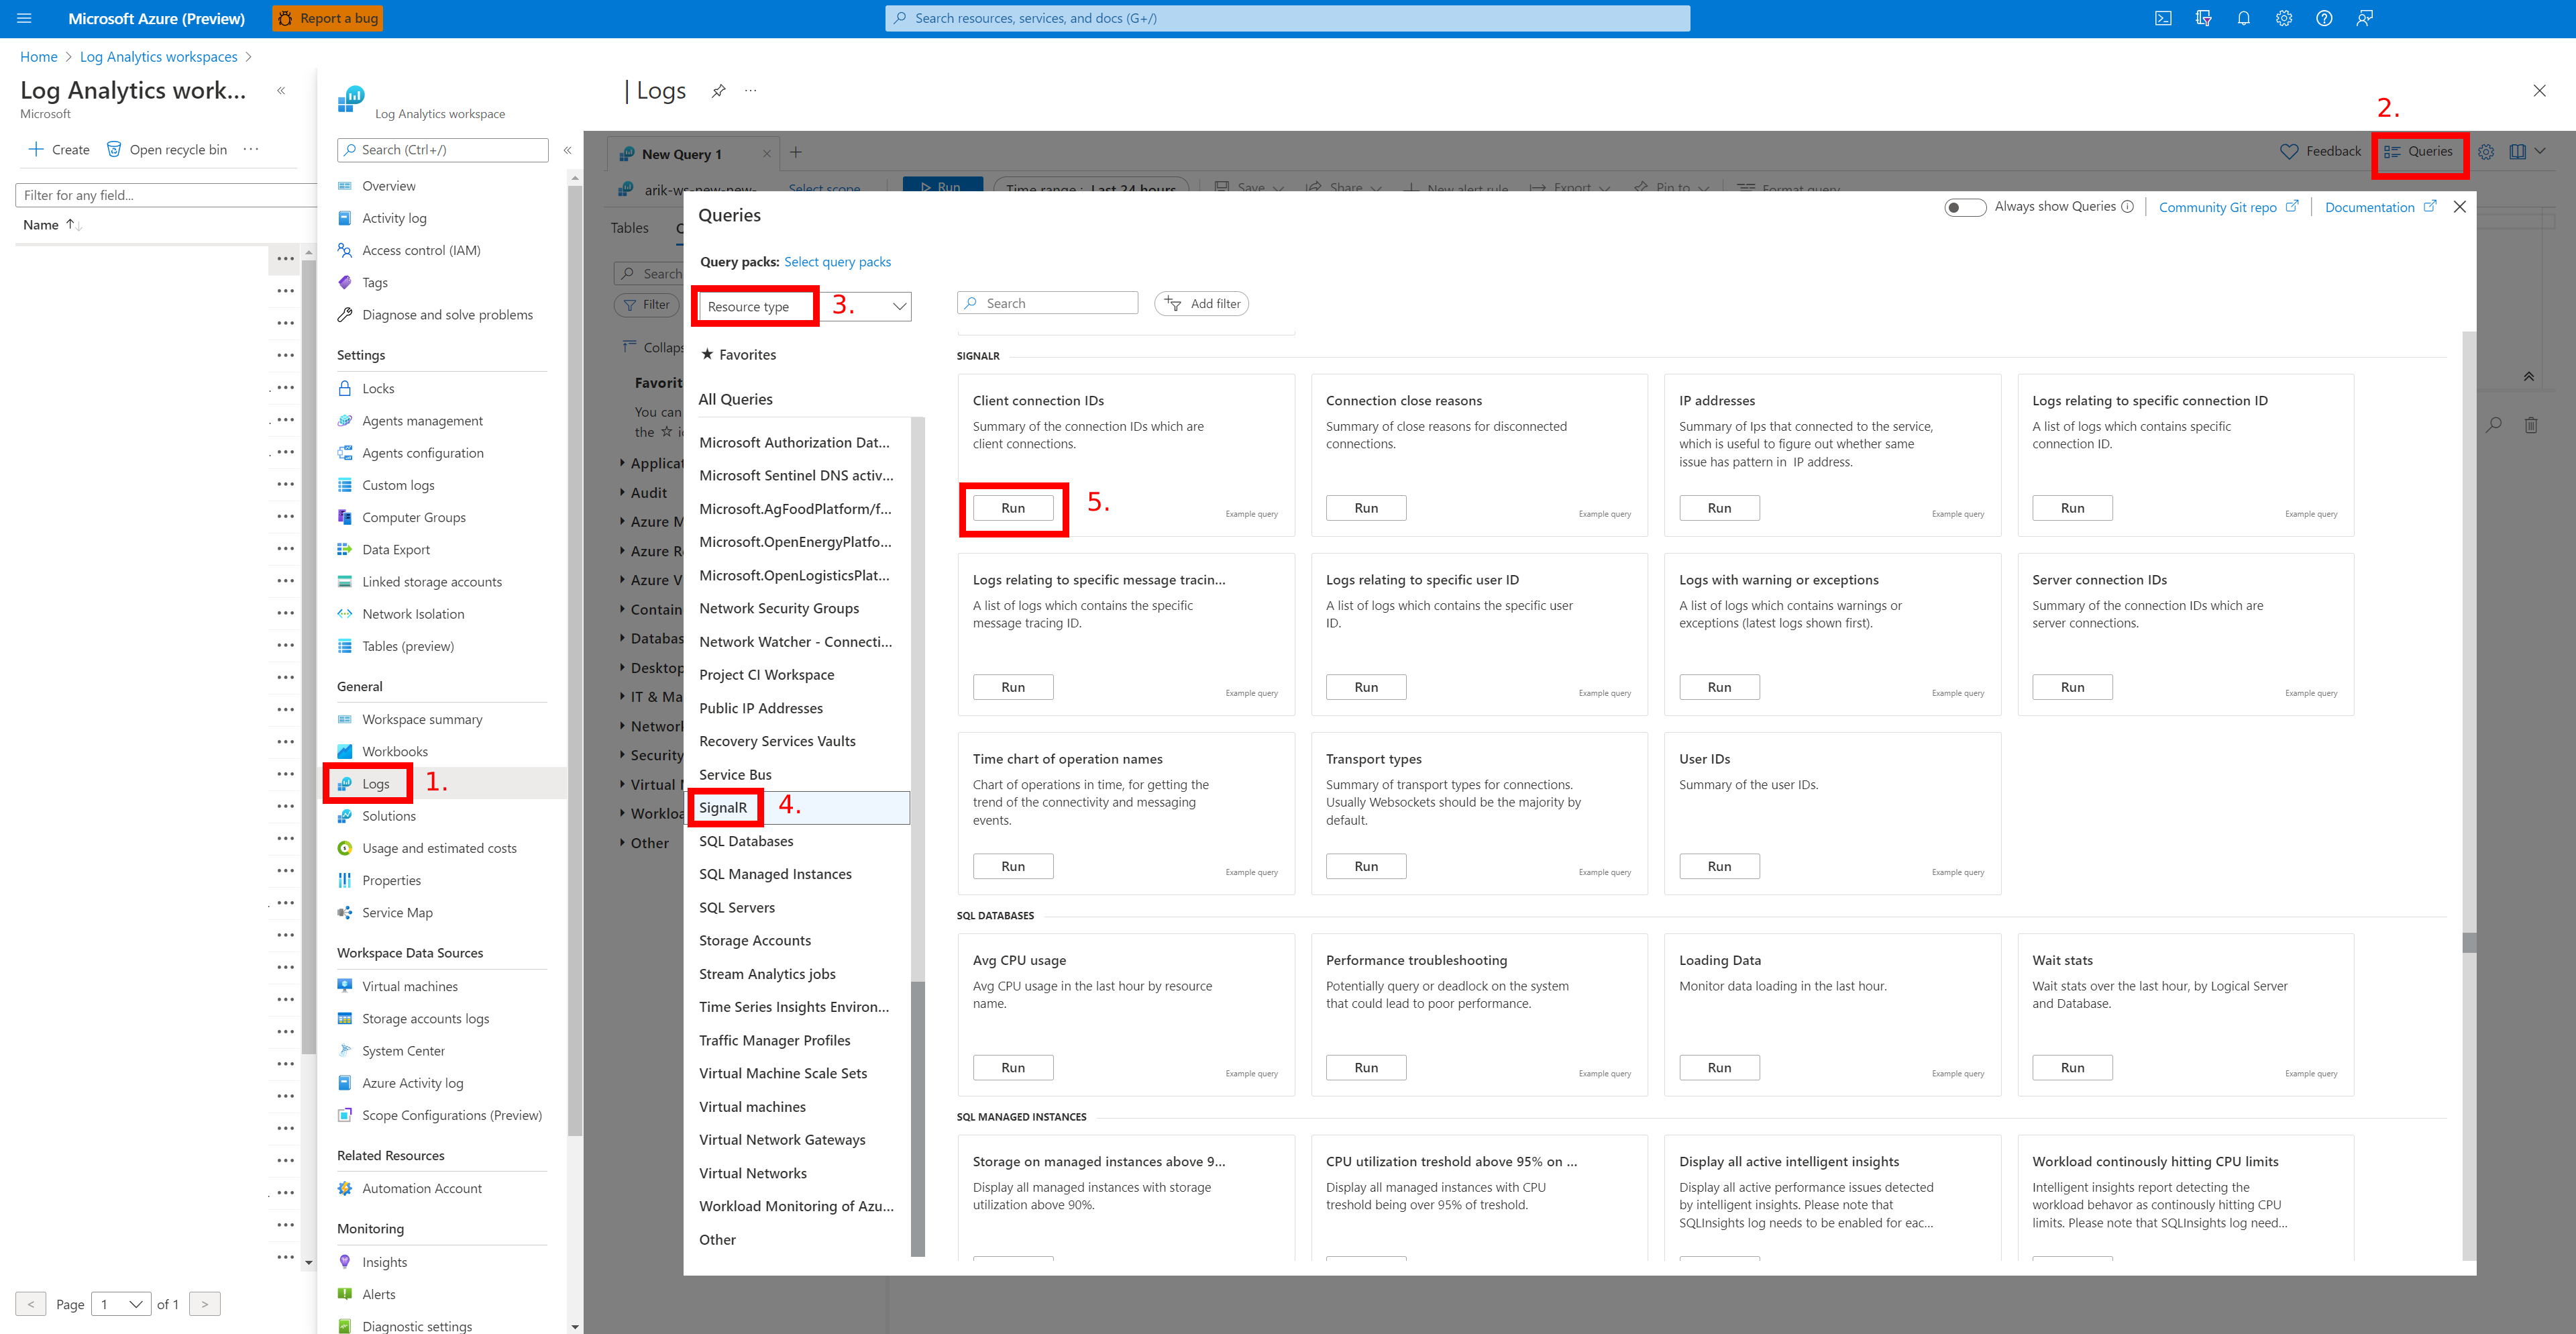

Alerts
Azure Monitor alerts proactively notify you when important conditions are found in your monitoring data. They allow you to identify and address issues in your system before your customers notice them. You can set alerts on metrics, logs, and the activity log. Different types of alerts have benefits and drawbacks.
The following table lists common and recommended alert rules for Azure Web PubSub.
| Alert type | Condition | Examples |
|---|---|---|
| Metric | Connection | When number of connections exceed a set value |
| Metric | Outbound traffic | When number of messages exceed a set value |
| Activity Log | Create or update service | When service is created or updated |
| Activity Log | Delete service | When service is deleted |
| Activity Log | Restart service | When service is restarted |
Next steps
For more information about monitoring Azure Functions, see the following articles:
- Monitor Azure Web PubSub data reference - reference of the metrics, logs, and other important values created by your function app.
- Monitoring Azure resources with Azure Monitor - details monitoring Azure resources.