Note
Access to this page requires authorization. You can try signing in or changing directories.
Access to this page requires authorization. You can try changing directories.
Important
For the most up-to-date information on this topic, please visit: Add and modify OpenTelemetry in Azure Monitor
The Azure OpenTelemetry Exporter is an SDK within Azure Monitor. It enables you to export tracing data using OpenTelemetry and send the data to Application Insights. OpenTelemetry provides a standard way for applications and frameworks to collect telemetry information.
Azure Application Insights is a feature of Azure Monitor which monitors live applications. It displays telemetry data about your application in a Microsoft Azure resource. The telemetry model is standardized to support platform and language-independent monitoring.
Prerequisites
- An Azure account with an active subscription. Create an account for free.
- The latest version .NET Core SDK for your operating system.
- An active Communication Services resource and connection string. Create a Communication Services resource.
- Create an Application Insights Resources in Azure portal.
Setting Up
Create a new C# application
In a console window (such as cmd, PowerShell, or Bash), use the dotnet new command to create a new console app with the name TelemetryAppInsightsQuickstart. This command creates a simple "Hello World" C# project with a single source file: Program.cs.
dotnet new console -o TelemetryAppInsightsQuickstart
Change your directory to the newly created app folder and use the dotnet build command to compile your application.
cd TelemetryAppInsightsQuickstart
dotnet build
Install the package
While still in the application directory, install the Azure Communication Services Identity library for .NET package by using the dotnet add package command.
dotnet add package Azure.Communication.Identity --version 1.0.0
You will also need to install the Azure Monitor Exporter for OpenTelemetry library.
dotnet add package Azure.Monitor.OpenTelemetry.Exporter -v 1.0.0-beta.3
Set up the app framework
From the project directory:
- Open Program.cs file in a text editor
- Add a
usingdirective to include theAzure.Communication.Identitynamespace - Add a
usingdirective to include theAzure.Monitor.OpenTelemetry.Exporternamespace; - Add a
usingdirective to include theOpenTelemetry.Tracenamespace; - Update the
Mainmethod declaration to support async code
Use the following code to begin:
using System;
using System.Diagnostics;
using Azure.Communication;
using Azure.Communication.Identity;
using Azure.Monitor.OpenTelemetry.Exporter;
using OpenTelemetry;
using OpenTelemetry.Resources;
using OpenTelemetry.Trace;

namespace TelemetryAppInsightsQuickstart
{
    class Program
    {
        static async Task Main(string[] args)
        {
            Console.WriteLine("Azure Communication Services - Export Telemetry to Application Insights");

            // Quickstart code goes here
        }
    }
}
Setting up the telemetry tracer with communication identity SDK calls
Initialize a CommunicationIdentityClient with your connection string. Learn how to manage your resource's connection string.
After the client is created, we must define an Activity Source which will track all the activities. Then, you can use the Activity Source to start an Activity which will be used to track the CreateUserAsync SDK call. Note that you can also define custom properties to be tracked within each Activity by using the SetTag method.
A similar tracing pattern is done for the GetTokenAsync function.
Create a new function called TracedSample and add the following code:
public static async Task TracedSample()
{
    // This code demonstrates how to fetch your connection string
    // from an environment variable.
    string connectionString = Environment.GetEnvironmentVariable("COMMUNICATION_SERVICES_CONNECTION_STRING");
    var client = new CommunicationIdentityClient(connectionString);

    using var source = new ActivitySource("Quickstart.IdentityTelemetry");
    CommunicationUserIdentifier identity = null;

    using (var activity = source.StartActivity("Create User Activity"))
    {
        var identityResponse = await client.CreateUserAsync();

        identity = identityResponse.Value;
        Console.WriteLine($"\nCreated an identity with ID: {identity.Id}");
        activity?.SetTag("Identity id", identity.Id);
    }

    using (var activity = source.StartActivity("Get Token Activity"))
    {
        var tokenResponse = await client.GetTokenAsync(identity, scopes: new[] { CommunicationTokenScope.Chat });

        activity?.SetTag("Token value", tokenResponse.Value.Token);
        activity?.SetTag("Expires on", tokenResponse.Value.ExpiresOn);

        Console.WriteLine($"\nIssued an access token with 'chat' scope that expires at {tokenResponse.Value.ExpiresOn}:");
    }
}
Funneling telemetry data to Application Insights
After the SDK calls have been wrapped with Activities, you can add the OpenTelemetry trace exporter and funnel the data into the Application Insights resource.
You have the option of defining a dictionary with some resource attributes that will show up in Application Insights.
Then, call AddSource and use the same Activity Source name that was defined in TracedSample.
You will also need to grab the connection string from your Application Insights resource and pass it to AddAzureMonitorTraceExporter(). This will funnel the telemetry data to your Application Insights resource.
Lastly, call and await the TracedSample() function where we have our SDK calls.
Add the following code to the Main method:
var resourceAttributes = new Dictionary<string, object> { { "service.name", "<service-name>" }, { "service.instance.id", "<service-instance-id>" } };
var resourceBuilder = ResourceBuilder.CreateDefault().AddAttributes(resourceAttributes);

using var tracerProvider = Sdk.CreateTracerProviderBuilder()
    .SetResourceBuilder(resourceBuilder)
    .AddSource("Quickstart.IdentityTelemetry")
    .AddAzureMonitorTraceExporter(o =>
    {
        o.ConnectionString = Environment.GetEnvironmentVariable("APPLICATION_INSIGHTS_CONNECTION_STRING");
    })
    .Build();

await TracedSample();
Run the code
Run the application from your application directory with the dotnet run command.
dotnet run
Prerequisites
- An Azure account with an active subscription. Create an account for free.
- Node.js Active LTS and Maintenance LTS versions.
- An active Communication Services resource and connection string. Create a Communication Services resource.
- Create an Application Insights Resources in Azure portal.
Setting Up
Create a new Node.js app
If you already have an app using an Azure Communication Services library, and you are comfortable with JavaScript, feel free to skip to Setup tracer.
To get started, you will need a JS app that uses any one of our client libraries. We will use the @azure/communication-identity library to create our app. Follow the steps below to set up your sample app:
Open your terminal or command window, create a new directory, and navigate to it.
mkdir export-js-telemetry && cd export-js-telemetry
Run npm init -y to create a package.json with default settings.
npm init -y
Install dependencies
Use the npm install command to install the dependencies our app will use.
npm install @azure/communication-identity @azure/monitor-opentelemetry-exporter @opentelemetry/node@^0.14.0 @opentelemetry/plugins-node-core --save
The --save option adds the libraries as dependencies in the package.json file created in the previous step.
It is important you not forget the specific version of @opentelemetry/node@^0.14.0. At the time of writing this guide, this is the latest version of the package that was fully compatible with @azure/monitor-opentelemetry-exporter.
Add main app file
Create a file called token.js in the root of the directory. Add the following code to it:
// token.js

const { CommunicationIdentityClient } = require("@azure/communication-identity");

async function main() {
  const ACS_CONNECTION_STRING = "<your-acs-connection-string>"
  const client = new CommunicationIdentityClient(ACS_CONNECTION_STRING);

  console.log("Creating user...")
  const user = await client.createUser();
  console.log(`User ${user.communicationUserId} was created successfully.\n`);

  console.log(`Issuing token for ${user.communicationUserId}...`);
  const { token } = await client.getToken(user, ["chat"]);
  console.log("Token issued successfully.\n")
  console.log(`${token}\n`);

  console.log(`Revoking token for ${user.communicationUserId}...`);
  await client.revokeTokens(user);
  console.log("Token revoked successfully.\n");

  console.log(`Deleting user ${user.communicationUserId}...`);
  await client.deleteUser(user);
  console.log("User deleted successfully.\n");
}

main().catch((error) => {
  console.log("Encountered an error:", error);
  process.exit(1);
});
Setup tracer
Create a file called tracing.js in the root of the directory. Add the following code to it:
// tracing.js

const azureSdkTracing = require("@azure/core-tracing");
const { AzureMonitorTraceExporter } = require("@azure/monitor-opentelemetry-exporter");
const { NodeTracerProvider } = require("@opentelemetry/node");
const { BatchSpanProcessor } = require("@opentelemetry/tracing");

const AI_CONNECTION_STRING = "<your-application-insights-connection-string>";
const provider = new NodeTracerProvider();
const azExporter = new AzureMonitorTraceExporter({
  connectionString: AI_CONNECTION_STRING
});

provider.addSpanProcessor(
  new BatchSpanProcessor(azExporter, {
    bufferSize: 1000, // 1000 spans
    bufferTimeout: 5000 // 5 seconds
  })
);

provider.register();

const tracer = provider.getTracer("sample tracer");
azureSdkTracing.setTracer(tracer);

exports.default = tracer;
Add tracer to main app
Make the following updates to token.js:
Require tracing.js:
const { CommunicationIdentityClient } = require("@azure/communication-identity");
const tracer = require("./tracing.js");

async function main() {
Create root span and export data
  console.log("User deleted successfully.\n");
}

const rootSpan = tracer.startSpan("Root Identity Span");
tracer.withSpan(rootSpan, async function() {
  try {
    await main();
  } catch (error) {
    console.error("Error running sample:", error);
  } finally {
    // End the optional root span on completion
    rootSpan.end();
  }
}).then(function() {
  console.log("Awaiting batched span processor to export batched spans...");

  setTimeout(function() {
    console.log("Spans exported.");
  }, 6000);
});
Run the code
Ensure you replace the placeholder texts with valid connection string values.
Use the node command to run the code you added to the token.js file.
node token.js
Prerequisites
- An Azure account with an active subscription. Create an account for free.
- Java Development Kit (JDK) version 8 or above.
- Apache Maven.
- An active Communication Services resource and connection string. Create a Communication Services resource.
- Create an Application Insights Resources in Azure portal.
Setting Up
Create a new Java application
Open your terminal or command window. Navigate to the directory where you'd like to create your Java application. Run the command below to generate the Java project from the maven-archetype-quickstart template.
mvn archetype:generate -DgroupId=com.communication.quickstart -DartifactId=communication-quickstart -DarchetypeArtifactId=maven-archetype-quickstart -DarchetypeVersion=1.4 -DinteractiveMode=false
You'll notice that the 'generate' task created a directory with the same name as the artifactId. Under this directory, the src/main/java directory contains the project source code, the src/test/java directory contains the test source, and the pom.xml file is the project's Project Object Model, or POM.
Install the package
Open the pom.xml file in your text editor. Add the following dependency elements to the group of dependencies.
    <dependency>
      <groupId>com.azure</groupId>
      <artifactId>azure-communication-identity</artifactId>
      <version>1.0.0</version>
    </dependency>
    <dependency>
      <groupId>com.azure</groupId>
      <artifactId>azure-monitor-opentelemetry-exporter</artifactId>
      <version>1.0.0-beta.4</version>
    </dependency>
Set up the app framework
From the project directory:
- Navigate to the /src/main/java/com/communication/quickstart directory
- Open the App.java file in your editor
- Replace the
System.out.println("Hello world!");statement - Add
importdirectives
Use the following code to begin:
package com.communication.quickstart;

import io.opentelemetry.api.trace.Span;
import io.opentelemetry.api.trace.Tracer;
import io.opentelemetry.context.Scope;
import io.opentelemetry.sdk.OpenTelemetrySdk;
import io.opentelemetry.sdk.trace.SdkTracerProvider;
import io.opentelemetry.sdk.trace.export.SimpleSpanProcessor;
import com.azure.monitor.opentelemetry.exporter.*;
import com.azure.communication.identity.*;

public class App
{
    public static void main( String[] args ) throws Exception
    {
        System.out.println("Azure Communication Services - Export Telemetry to Application Insights");
        // Quickstart code goes here
    }
}
Setting up the telemetry tracer with communication identity SDK calls
Initialize a CommunicationIdentityClient with your connection string. Learn how to manage your resource's connection string.
    CommunicationIdentityClient client = new CommunicationIdentityClientBuilder()
        .connectionString("<COMMUNICATION-RESOURCE-CONNECTION-STRING>")
        .buildClient();
First, in order to create the span that will allow you to trace the requests in the Azure Monitor, you will have to create an instance of an AzureMonitorTraceExporter object. You will need to provide the connection string from your Application Insights Resource.
    AzureMonitorTraceExporter exporter = new AzureMonitorExporterBuilder()
        .connectionString("<APPLICATION-INSIGHTS-CONNECTION-STRING>")
        .buildTraceExporter();
This exporter will then allow you to create the following instances to make the request tracing possible. Add the following code after creating the AzureMonitorTraceExporter:
    SdkTracerProvider tracerProvider = SdkTracerProvider.builder()
        .addSpanProcessor(SimpleSpanProcessor.create(exporter))
        .build();

    OpenTelemetrySdk openTelemetrySdk = OpenTelemetrySdk.builder()
        .setTracerProvider(tracerProvider)
        .buildAndRegisterGlobal();

    Tracer tracer = openTelemetrySdk.getTracer("Sample");
Once the tracer has been initialized, you can create the span that will be in charge of tracing your requests.
    Span span = tracer.spanBuilder("sample-span").startSpan();
    final Scope scope = span.makeCurrent();
    try {
        // Thread bound (sync) calls will automatically pick up the parent span and you don't need to pass it explicitly.
        client.createUser();
    } finally {
        span.end();
        scope.close();
    }
    Thread.sleep(10000);
Run the code
Navigate to the directory containing the pom.xml file and compile the project by using the following mvn command.
mvn compile
Then, build the package.
mvn package
Run the following mvn command to execute the app.
mvn exec:java -Dexec.mainClass="com.communication.quickstart.App" -Dexec.cleanupDaemonThreads=false
Prerequisites
- An Azure account with an active subscription. Create an account for free.
- Python 3.7+.
- An active Communication Services resource and connection string. Create a Communication Services resource.
- Create an Application Insights Resources in Azure portal.
Setting Up
Create a new Python application
Open your terminal or command window create a new directory for your app, and navigate to it.
mkdir application-insights-quickstart && cd application-insights-quickstartUse a text editor to create a file called application-insights-quickstart.py in the project root directory and add the structure for the program, including basic exception handling. You'll add all the source code for this quickstart to this file in the following sections.
 import os
 from opentelemetry import trace
 from opentelemetry.sdk.trace import TracerProvider
 from opentelemetry.sdk.trace.export import BatchSpanProcessor
 from azure.communication.identity import CommunicationIdentityClient, CommunicationUserIdentifier

 from azure.monitor.opentelemetry.exporter import AzureMonitorTraceExporter

try:
   print("Azure Communication Services - Access Tokens Quickstart")
   # Quickstart code goes here
except Exception as ex:
   print("Exception:")
   print(ex)
Install the package
While still in the application directory, install the Azure Communication Services Identity SDK for Python package and the Microsoft Opentelemetry Exporter for the Azure Monitor.
pip install azure-communication-identity
pip install azure-monitor-opentelemetry-exporter --pre
Setting up the telemetry tracer with communication identity SDK calls
Instantiate a CommunicationIdentityClient with your connection string. The code below retrieves the connection string for the resource from an environment variable named COMMUNICATION_SERVICES_CONNECTION_STRING. Learn how to manage your resource's connection string.
Add this code inside the try block:
connection_string = os.environ["COMMUNICATION_SERVICES_CONNECTION_STRING"]
identity_client = CommunicationIdentityClient.from_connection_string(connection_string)
First, in order to create the span that will allow you to trace the requests in the Azure Monitor, you will have to create an instance of an AzureMonitorTraceExporter object. You will need to provide the connection string from your Application Insights Resource.
exporter = AzureMonitorTraceExporter.from_connection_string(
    "<APPLICATION-INSIGHTS-RESOURCE-CONNECTION-STRING>"
)
This exporter will then allow you to create the following instances to make the request tracing possible. Add the following code after creating the AzureMonitorTraceExporter:
    trace.set_tracer_provider(TracerProvider())
    tracer = trace.get_tracer(__name__)
    span_processor = BatchSpanProcessor(exporter)
    trace.get_tracer_provider().add_span_processor(span_processor)
Once the tracer has been initialized, you can create the span that will be in charge of tracing your requests.
with tracer.start_as_current_span(name="MyIdentityApplication"):
    user = identity_client.create_user()
Run the code
From a console prompt, navigate to the directory containing the application-insights-quickstart.py file, then execute the following python command to run the app.
python application-insights-quickstart.py
The output of the app describes each action that is completed:
Created an identity with ID: <identity-id>
Issued an access token with 'chat' scope that expires at <expiry-data>
View the telemetry data in Application Insights
To analyze the telemetry data from the SDK, go to the Performance tab and then go to Dependencies. You can see the Create User Activity and Get Token Activity that we track.
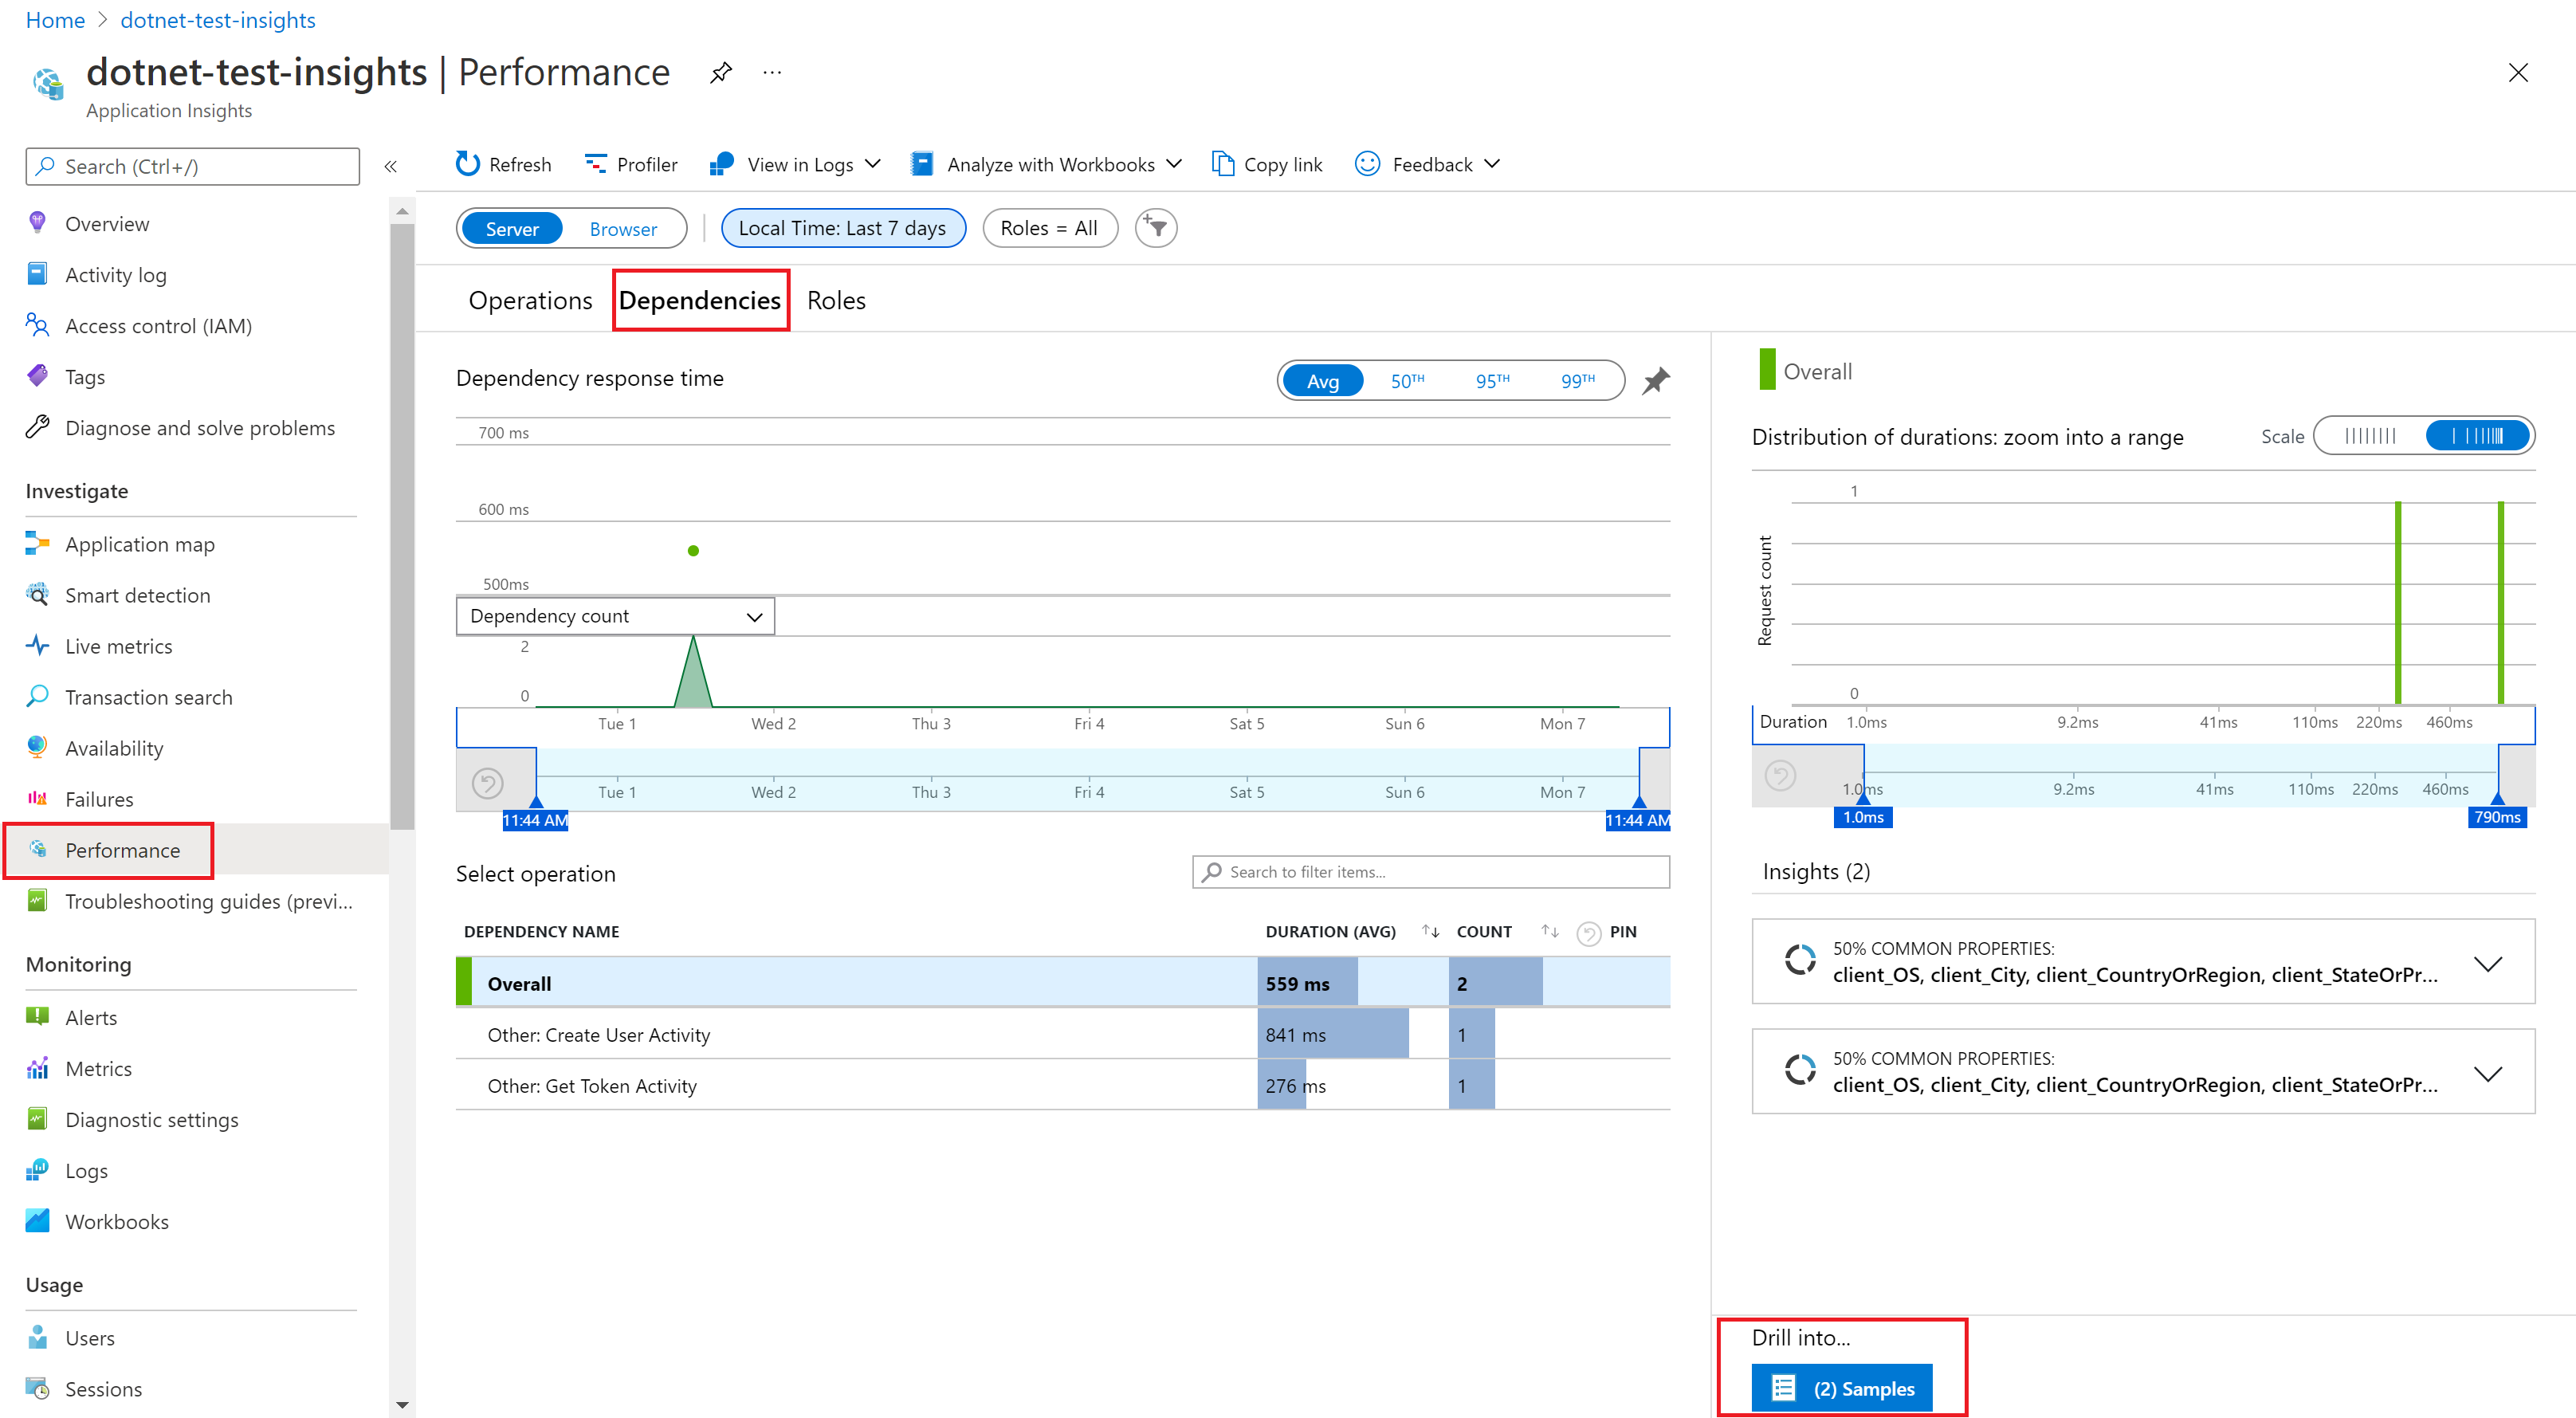
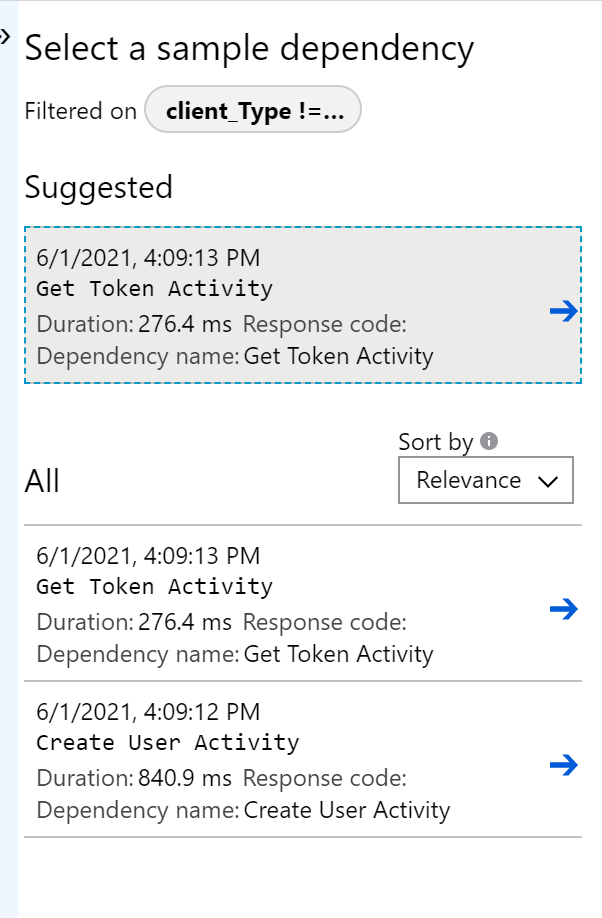
To view more detail, you can drill into the samples:
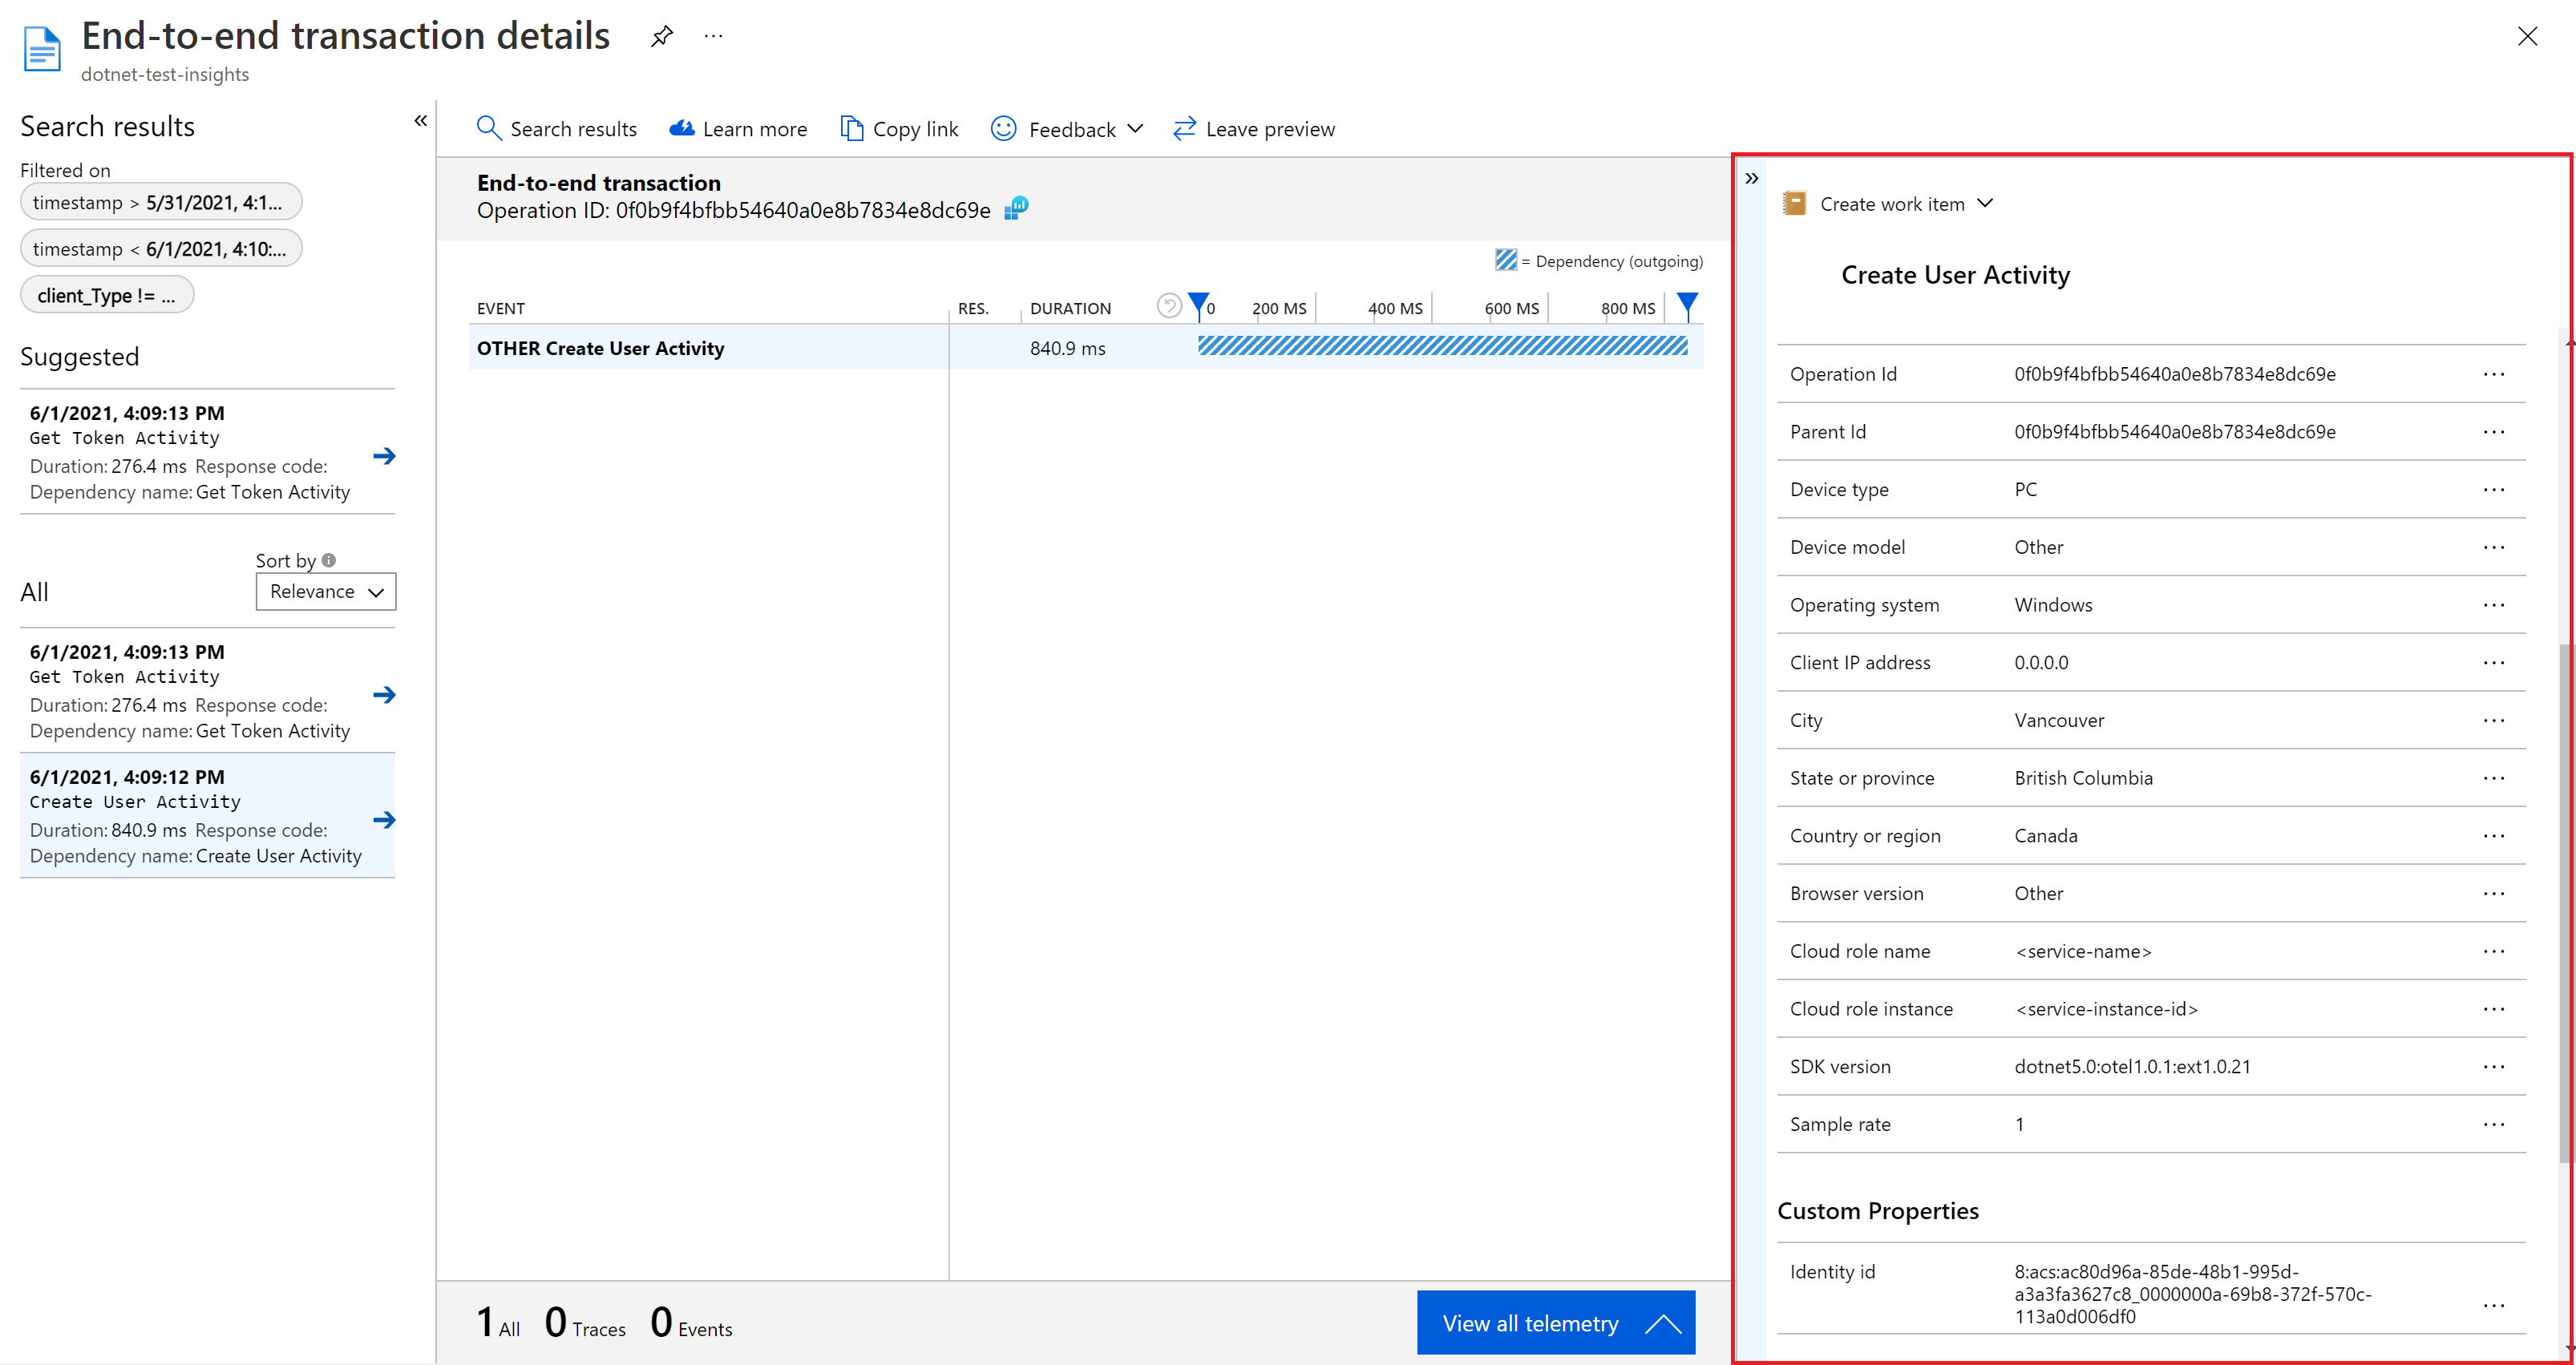
In the drill-down view, there's more information about the Activity such as where it was called from, its timestamp, name, performance, type, and so on. You can also see the Cloud role name and instance ID that we defined in the preceding sample code snippet. Notice that the custom properties also show up here:
Next steps
This article described how to:
- Set up Telemetry Exporter
- Funnel Telemetry data to Application Insights
- View exported data in Application Insights