APPLIES TO:
 NoSQL
MongoDB
Cassandra
Gremlin
Table
NoSQL
MongoDB
Cassandra
Gremlin
Table
You can collect resource logs in Azure by using diagnostic settings. Resources emit Azure resource logs and provide rich, frequent data about the operation of that resource. These logs are captured per request and they're also referred to as data plane logs. Some examples of the data plane operations include delete, insert, and readFeed. The content of these logs varies by resource type.
To learn more about diagnostic settings, see Diagnostic settings in Azure Monitor.
Note
We recommend creating the diagnostic setting in resource-specific mode (for all APIs except API for Table) following the instructions in the REST API tab. This option provides additional cost-optimizations with an improved view for handling data.
Prerequisites
- An existing Azure Cosmos DB account.
- An existing Azure Monitor Log Analytics workspace.
Warning
If you need to delete, rename, or move a resource, or migrate it across resource groups or subscriptions, first delete its diagnostic settings. Otherwise, if you recreate this resource, the diagnostic settings for the deleted resource could be included with the new resource, depending on the resource configuration for each resource. If the diagnostics settings are included with the new resource, this resumes the collection of resource logs as defined in the diagnostic setting and sends the applicable metric and log data to the previously configured destination.
Also, it's a good practice to delete the diagnostic settings for a resource you're going to delete and don't plan on using again to keep your environment clean.
Create diagnostic settings
Here, we walk through the process of creating diagnostic settings for your account.
Note
The metric to logs export as a category isn't currently supported.
Sign in to the Azure portal.
Navigate to your existing Azure Cosmos DB account.
In the Monitoring section of the resource menu, select Diagnostic settings. Then, select the Add diagnostic setting option.
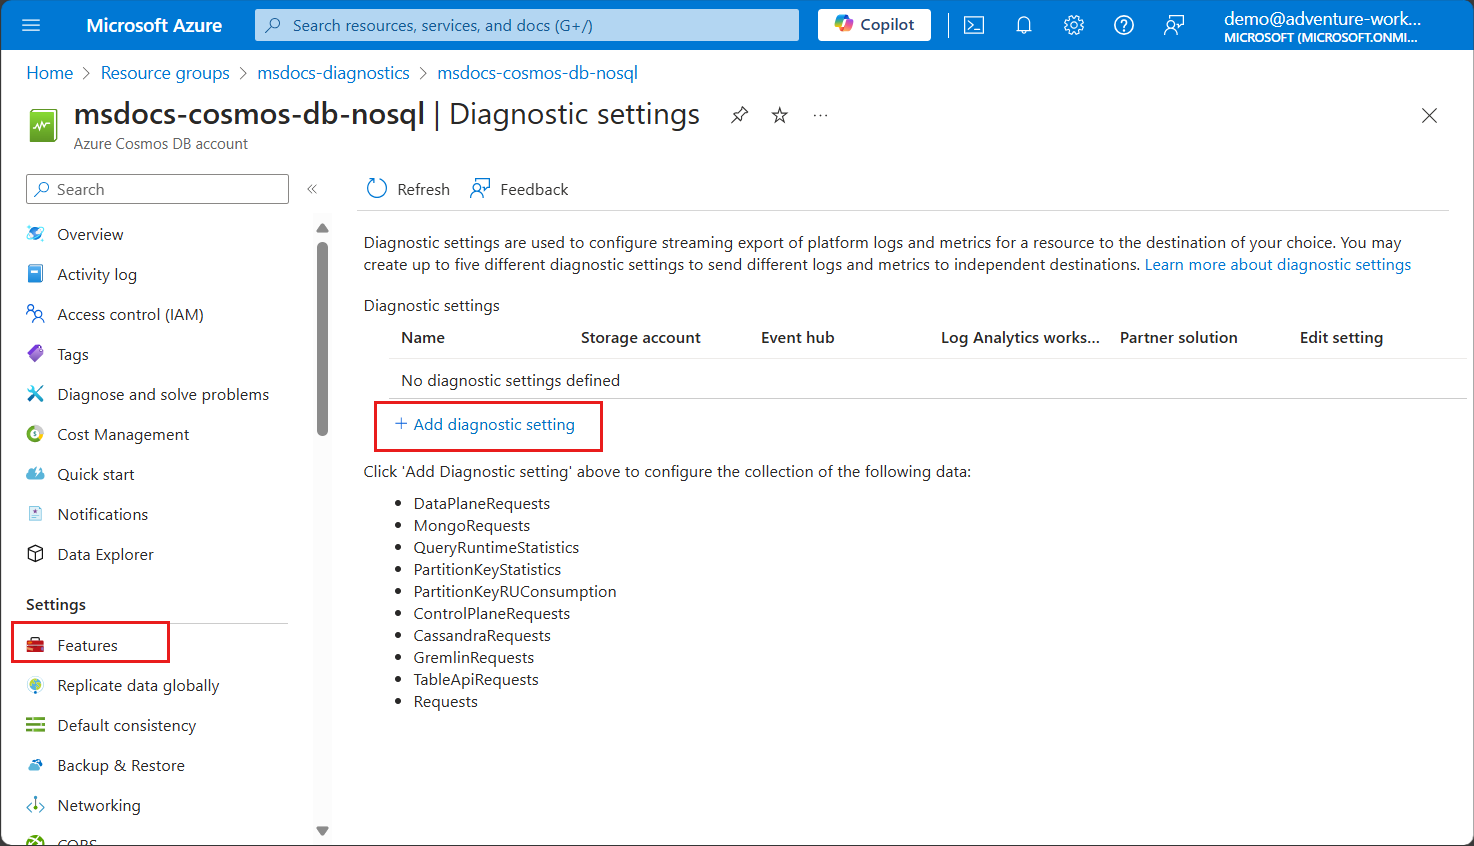
Important
You might see a prompt to "enable full-text query [...] for more detailed logging" if the full-text query feature isn't enabled in your account. You can safely ignore this warning if you don't wish to enable this feature. For more information, see enable full-text query.
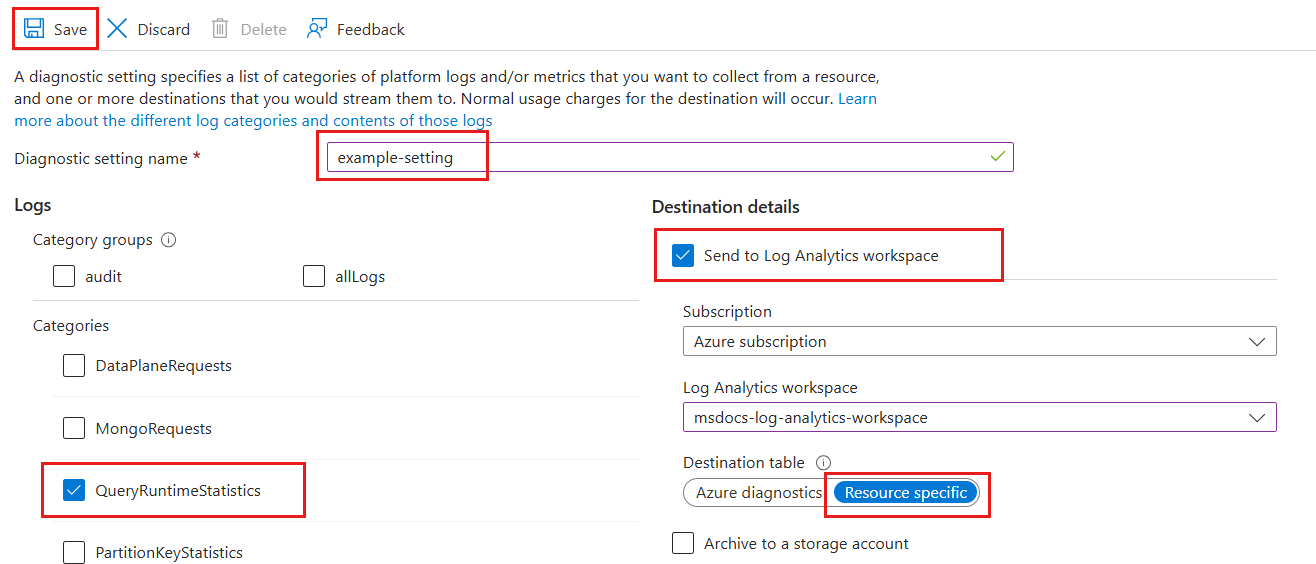
In the Diagnostic settings pane, name the setting example-setting and then select the QueryRuntimeStatistics category. Enable Send to Log Analytics Workspace checkbox, selecting your existing workspace. Finally, select Resource specific as the destination option.
Use the az monitor diagnostic-settings create command to create a diagnostic setting with the Azure CLI. To learn about the command's parameters, see the documentation.
Ensure you logged in to the Azure CLI. For more information, see Sign in with Azure CLI.
Use az monitor diagnostic-settings create to create the setting.
az monitor diagnostic-settings create \
  --resource $(az cosmosdb show \
    --resource-group "<resource-group-name>" \
    --name "<account-name>" \
    --query "id" \
    --output "tsv" \
  ) \
  --workspace $(az monitor log-analytics workspace show \
    --resource-group "<resource-group-name>" \
    --name "<account-name>" \
    --query "id" \
    --output "tsv" \
  ) \
  --name "example-setting" \
  --export-to-resource-specific true \
  --logs '[
    {
      "category": "QueryRuntimeStatistics",
      "enabled": true
    }
  ]'
Important
This sample uses the --export-to-resource-specific argument to enable resource-specific tables.
Review the results of creating your new setting using az monitor diagnostics-settings show.
az monitor diagnostic-settings show \
  --name "example-setting" \
  --resource $(az cosmosdb show \
    --resource-group "<resource-group-name>" \
    --name "<account-name>" \
    --query "id" \
    --output "tsv" \
  )
Use the Azure Monitor REST API to create a diagnostic setting via the interactive console.
Ensure you logged in to the Azure CLI. For more information, see Sign in with Azure CLI.
Create the diagnostic setting for your Azure Cosmos DB resource using an HTTP PUT request and az rest.
diagnosticSettingName="example-setting"

resourceId=$(az cosmosdb show \
  --resource-group "<resource-group-name>" \
  --name "<account-name>" \
  --query "id" \
  --output "tsv" \
)

workspaceId=$(az monitor log-analytics workspace show \
  --resource-group "<resource-group-name>" \
  --name "<account-name>" \
  --query "id" \
  --output "tsv" \
)

az rest \
  --method "PUT" \
  --url "$resourceId/providers/Microsoft.Insights/diagnosticSettings/$diagnosticSettingName" \
  --url-parameters "api-version=2021-05-01-preview" \
  --body '{
    "properties": {
      "workspaceId": "'"$workspaceId"'",
      "logs": [
        {
          "category": "QueryRuntimeStatistics",
          "enabled": true
        }
      ],
      "logAnalyticsDestinationType": "Dedicated"
    }
  }'
Important
This sample sets the logAnalyticsDestinationType property to Dedicated to enable resource-specific tables.
Use az rest again with an HTTP GET verb to get the properties of the diagnostic setting.
diagnosticSettingName="example-setting"

resourceId=$(az cosmosdb show \
  --resource-group "<resource-group-name>" \
  --name "<account-name>" \
  --query "id" \
  --output "tsv" \
)

az rest \
  --method "GET" \
  --url "$resourceId/providers/Microsoft.Insights/diagnosticSettings/$diagnosticSettingName" \
  --url-parameters "api-version=2021-05-01-preview"
Use a Bicep template to create the diagnostic setting.
Ensure you logged in to the Azure CLI. For more information, see Sign in with Azure CLI.
Create a new file named diagnosticSetting.bicep.
Enter the following Bicep template content that deploys the diagnostic setting for your Azure Cosmos DB resource.
@description('The name of the diagnostic setting to create.')
param diagnosticSettingName string = 'example-setting'

@description('The name of the Azure Cosmos DB account to monitor.')
param azureCosmosDbAccountName string

@description('The name of the Azure Monitor Log Analytics workspace to use.')
param logAnalyticsWorkspaceName string

resource azureCosmosDbAccount 'Microsoft.DocumentDB/databaseAccounts@2021-06-15' existing = {
  name: azureCosmosDbAccountName
}

resource logAnalyticsWorkspace 'Microsoft.OperationalInsights/workspaces@2023-09-01' existing = {
  name: logAnalyticsWorkspaceName
}

resource diagnosticSetting 'Microsoft.Insights/diagnosticSettings@2021-05-01-preview' = {
  name: diagnosticSettingName
  scope: azureCosmosDbAccount
  properties: {
    workspaceId: logAnalyticsWorkspace.id
    logAnalyticsDestinationType: 'Dedicated'
    logs: [
      {
        category: 'QueryRuntimeStatistics'
        enabled: true
      }
    ]
  }
}
Important
This sample sets the logAnalyticsDestinationType property to Dedicated to enable resource-specific tables.
Deploy the template using az deployment group create.
az deployment group create \
    --resource-group "<resource-group-name>" \
    --template-file diagnosticSetting.bicep \
    --parameters \
      azureCosmosDbAccountName="<azure-cosmos-db-account-name>" \
      logAnalyticsWorkspaceName="<log-analytics-workspace-name>"
Tip
Use the az bicep build command to convert the Bicep template to an Azure Resource Manager template.
Use an Azure Resource Manager template to create the diagnostic setting.
Ensure you logged in to the Azure CLI. For more information, see Sign in with Azure CLI.
Create a new file named diagnosticSetting.bicep.
Enter the following Azure Resource Manager template content that deploys the diagnostic setting for your Azure Cosmos DB resource.
{
  "$schema": "<https://schema.management.azure.com/schemas/2019-04-01/deploymentTemplate.json#>",
  "contentVersion": "1.0.0.0",
  "parameters": {
    "diagnosticSettingName": {
      "type": "string",
      "defaultValue": "example-setting",
      "metadata": {
        "description": "The name of the diagnostic setting to create."
      }
    },
    "azureCosmosDbAccountName": {
      "type": "string",
      "metadata": {
        "description": "The name of the Azure Cosmos DB account to monitor."
      }
    },
    "logAnalyticsWorkspaceName": {
      "type": "string",
      "metadata": {
        "description": "The name of the Azure Monitor Log Analytics workspace to use."
      }
    }
  },
  "resources": [
    {
      "type": "Microsoft.Insights/diagnosticSettings",
      "apiVersion": "2021-05-01-preview",
      "scope": "[format('Microsoft.DocumentDB/databaseAccounts/{0}', parameters('azureCosmosDbAccountName'))]",
      "name": "[parameters('diagnosticSettingName')]",
      "properties": {
        "workspaceId": "[resourceId('Microsoft.OperationalInsights/workspaces', parameters('logAnalyticsWorkspaceName'))]",
        "logAnalyticsDestinationType": "Dedicated",
        "logs": [
          {
            "category": "QueryRuntimeStatistics",
            "enabled": true
          }
        ]
      }
    }
  ]
}
Important
This sample sets the logAnalyticsDestinationType property to Dedicated to enable resource-specific tables.
Deploy the template using az deployment group create.
az deployment group create \
    --resource-group "<resource-group-name>" \
    --template-file azuredeploy.json \
    --parameters \
      azureCosmosDbAccountName="<azure-cosmos-db-account-name>" \
      logAnalyticsWorkspaceName="<log-analytics-workspace-name>"
Tip
Use the az bicep decompile command to convert the Azure Resource Manager template to a Bicep template.
Enable full-text query for logging query text
Azure Cosmos DB provides advanced logging for detailed troubleshooting. By enabling full-text query, you're able to view the deobfuscated query for all requests within your Azure Cosmos DB account. You also give permission for Azure Cosmos DB to access and surface this data in your logs.
Warning
Enabling this feature might result in additional logging costs. For pricing details, see Azure Monitor pricing. It's recommended to disable this feature after troubleshooting.
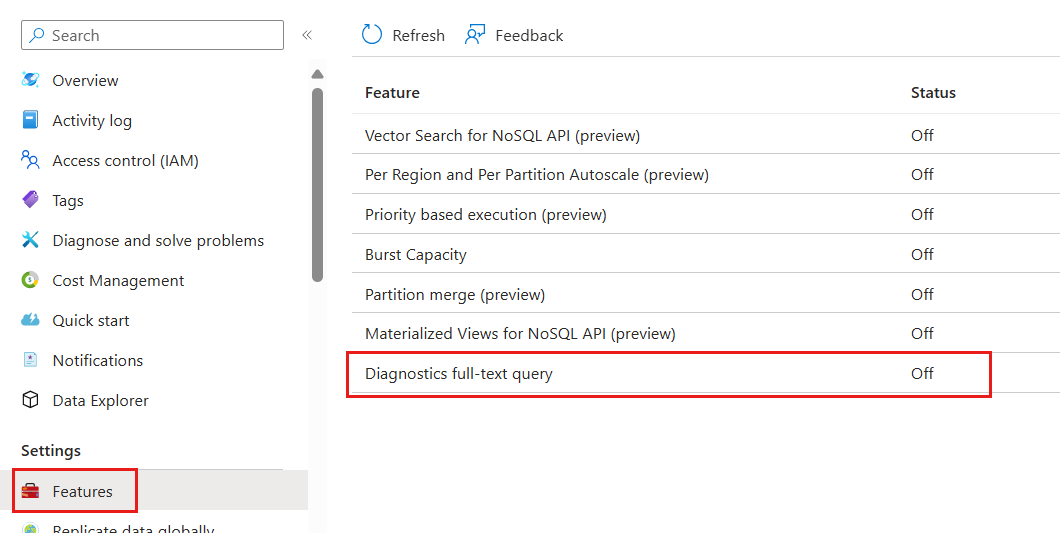
On the existing Azure Cosmos DB account page, select the Features option within the Settings section of the resource menu. Then, select the Diagnostics full-text query feature.
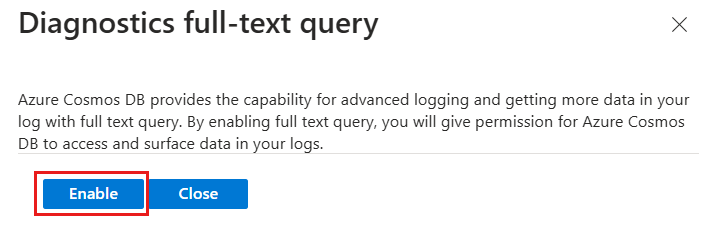
In the dialog, select Enable. This setting is applied within a few minutes. All newly ingested logs now have the full-text or PIICommand text for each request.
Use the Azure CLI to enable full-text query for your Azure Cosmos DB account.
Enable full-text query using az rest again with an HTTP PATCH verb and a JSON payload.
az rest \
  --method "PATCH" \
  --url $(az cosmosdb show \
    --resource-group "<resource-group-name>" \
    --name "<account-name>" \
    --query "id" \
    --output "tsv" \
  ) \
  --url-parameters "api-version=2021-05-01-preview" \
  --body '{
    "properties": {
      "diagnosticLogSettings": {
        "enableFullTextQuery": "True"
      }
    }
  }'
Wait a few minutes for the operation to complete. Check the status of full-text query by using az rest again with HTTP GET.
az rest \
  --method "GET" \
  --url $(az cosmosdb show \
    --resource-group "<resource-group-name>" \
    --name "<account-name>" \
    --query "id" \
    --output "tsv" \
  ) \
  --url-parameters "api-version=2021-05-01-preview" \
  --query "{accountName:name,fullTextQueryEnabled:properties.diagnosticLogSettings.enableFullTextQuery}"
The output should be similar to this example.
{
  "accountName": "<account-name>",
  "fullTextQueryEnabled": "True"
}
Related content

