series_fit_poly_fl()
The function series_fit_poly_fl() is a user-defined function (UDF) that applies a polynomial regression on a series. This function takes a table containing multiple series (dynamic numerical arrays) and generates the best fit high-order polynomial for each series using polynomial regression. This function returns both the polynomial coefficients and the interpolated polynomial over the range of the series.
Note
- Use the native function series_fit_poly() instead of the function described in this document. The native function provides the same functionality and is better for performance and scalability. This document is provided for reference purposes only.
- For linear regression of an evenly spaced series, as created by make-series operator, use the native function series_fit_line().
Prerequisites
- The Python plugin must be enabled on the cluster. This is required for the inline Python used in the function.
- The Python plugin must be enabled on the database. This is required for the inline Python used in the function.
Syntax
T | invoke series_fit_poly_fl(y_series, y_fit_series, fit_coeff, degree, [ x_series ], [ x_istime ])
Learn more about syntax conventions.
Parameters
| Name | Type | Required | Description |
|---|---|---|---|
| y_series | string |
✔️ | The name of the input table column containing the dependent variable. That is, the series to fit. |
| y_fit_series | string |
✔️ | The name of the column to store the best fit series. |
| fit_coeff | string |
✔️ | The name of the column to store the best fit polynomial coefficients. |
| degree | int |
✔️ | The required order of the polynomial to fit. For example, 1 for linear regression, 2 for quadratic regression, and so on. |
| x_series | string |
The name of the column containing the independent variable, that is, the x or time axis. This parameter is optional, and is needed only for unevenly spaced series. The default value is an empty string, as x is redundant for the regression of an evenly spaced series. | |
| x_istime | bool |
This parameter is needed only if x_series is specified and it's a vector of datetime. |
Function definition
You can define the function by either embedding its code as a query-defined function, or creating it as a stored function in your database, as follows:
Define the function using the following let statement. No permissions are required.
Important
A let statement can't run on its own. It must be followed by a tabular expression statement. To run a working example of series_fit_poly_fl(), see Examples.
let series_fit_poly_fl=(tbl:(*), y_series:string, y_fit_series:string, fit_coeff:string, degree:int, x_series:string='', x_istime:bool=False)
{
    let kwargs = bag_pack('y_series', y_series, 'y_fit_series', y_fit_series, 'fit_coeff', fit_coeff, 'degree', degree, 'x_series', x_series, 'x_istime', x_istime);
    let code = ```if 1:
        y_series = kargs["y_series"]
        y_fit_series = kargs["y_fit_series"]
        fit_coeff = kargs["fit_coeff"]
        degree = kargs["degree"]
        x_series = kargs["x_series"]
        x_istime = kargs["x_istime"]

        def fit(ts_row, x_col, y_col, deg):
            y = ts_row[y_col]
            if x_col == "": # If there is no x column creates sequential range [1, len(y)]
               x = np.arange(len(y)) + 1
            else: # if x column exists check whether its a time column. If so, normalize it to the [1, len(y)] range, else take it as is.
               if x_istime:
                   x = pd.to_numeric(pd.to_datetime(ts_row[x_col]))
                   x = x - x.min()
                   x = x / x.max()
                   x = x * (len(x) - 1) + 1
               else:
                   x = ts_row[x_col]
            coeff = np.polyfit(x, y, deg)
            p = np.poly1d(coeff)
            z = p(x)
            return z, coeff

        result = df
        if len(df):
           result[[y_fit_series, fit_coeff]] = df.apply(fit, axis=1, args=(x_series, y_series, degree,), result_type="expand")
    ```;
    tbl
     | evaluate python(typeof(*), code, kwargs)
};
// Write your query to use the function here.
Examples
The following examples use the invoke operator to run the function.
Fit fifth order polynomial to a regular time series
To use a query-defined function, invoke it after the embedded function definition.
let series_fit_poly_fl=(tbl:(*), y_series:string, y_fit_series:string, fit_coeff:string, degree:int, x_series:string='', x_istime:bool=False)
{
let kwargs = bag_pack('y_series', y_series, 'y_fit_series', y_fit_series, 'fit_coeff', fit_coeff, 'degree', degree, 'x_series', x_series, 'x_istime', x_istime);
let code = ```if 1:
y_series = kargs["y_series"]
y_fit_series = kargs["y_fit_series"]
fit_coeff = kargs["fit_coeff"]
degree = kargs["degree"]
x_series = kargs["x_series"]
x_istime = kargs["x_istime"]
def fit(ts_row, x_col, y_col, deg):
y = ts_row[y_col]
if x_col == "": # If there is no x column creates sequential range [1, len(y)]
x = np.arange(len(y)) + 1
else: # if x column exists check whether its a time column. If so, normalize it to the [1, len(y)] range, else take it as is.
if x_istime:
x = pd.to_numeric(pd.to_datetime(ts_row[x_col]))
x = x - x.min()
x = x / x.max()
x = x * (len(x) - 1) + 1
else:
x = ts_row[x_col]
coeff = np.polyfit(x, y, deg)
p = np.poly1d(coeff)
z = p(x)
return z, coeff
result = df
if len(df):
result[[y_fit_series, fit_coeff]] = df.apply(fit, axis=1, args=(x_series, y_series, degree,), result_type="expand")
```;
tbl
| evaluate python(typeof(*), code, kwargs)
};
//
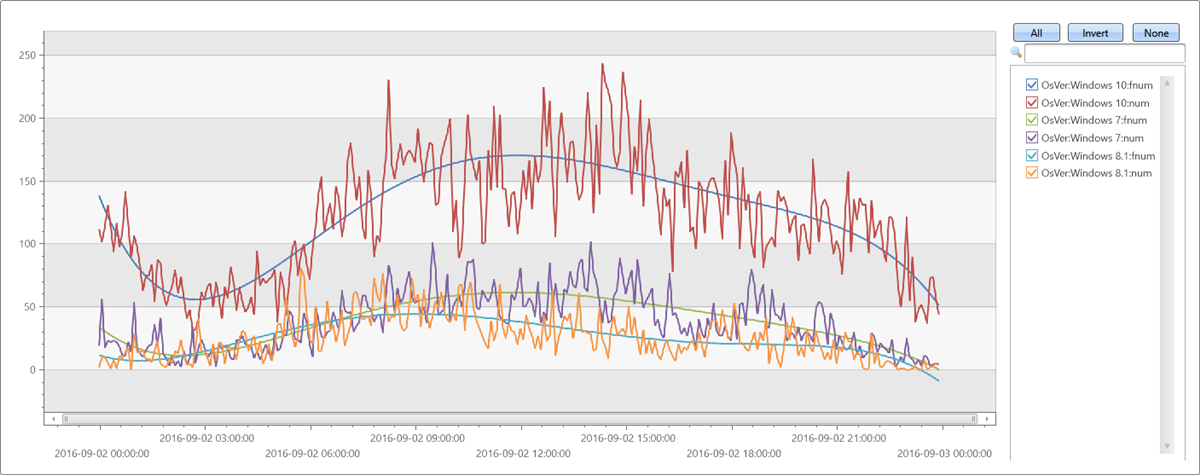
// Fit fifth order polynomial to a regular (evenly spaced) time series, created with make-series
//
let max_t = datetime(2016-09-03);
demo_make_series1
| make-series num=count() on TimeStamp from max_t-1d to max_t step 5m by OsVer
| extend fnum = dynamic(null), coeff=dynamic(null), fnum1 = dynamic(null), coeff1=dynamic(null)
| invoke series_fit_poly_fl('num', 'fnum', 'coeff', 5)
| render timechart with(ycolumns=num, fnum)
Output
Test irregular time series
To use a query-defined function, invoke it after the embedded function definition.
let series_fit_poly_fl=(tbl:(*), y_series:string, y_fit_series:string, fit_coeff:string, degree:int, x_series:string='', x_istime:bool=False)
{
let kwargs = bag_pack('y_series', y_series, 'y_fit_series', y_fit_series, 'fit_coeff', fit_coeff, 'degree', degree, 'x_series', x_series, 'x_istime', x_istime);
let code = ```if 1:
y_series = kargs["y_series"]
y_fit_series = kargs["y_fit_series"]
fit_coeff = kargs["fit_coeff"]
degree = kargs["degree"]
x_series = kargs["x_series"]
x_istime = kargs["x_istime"]
def fit(ts_row, x_col, y_col, deg):
y = ts_row[y_col]
if x_col == "": # If there is no x column creates sequential range [1, len(y)]
x = np.arange(len(y)) + 1
else: # if x column exists check whether its a time column. If so, normalize it to the [1, len(y)] range, else take it as is.
if x_istime:
x = pd.to_numeric(pd.to_datetime(ts_row[x_col]))
x = x - x.min()
x = x / x.max()
x = x * (len(x) - 1) + 1
else:
x = ts_row[x_col]
coeff = np.polyfit(x, y, deg)
p = np.poly1d(coeff)
z = p(x)
return z, coeff
result = df
if len(df):
result[[y_fit_series, fit_coeff]] = df.apply(fit, axis=1, args=(x_series, y_series, degree,), result_type="expand")
```;
tbl
| evaluate python(typeof(*), code, kwargs)
};
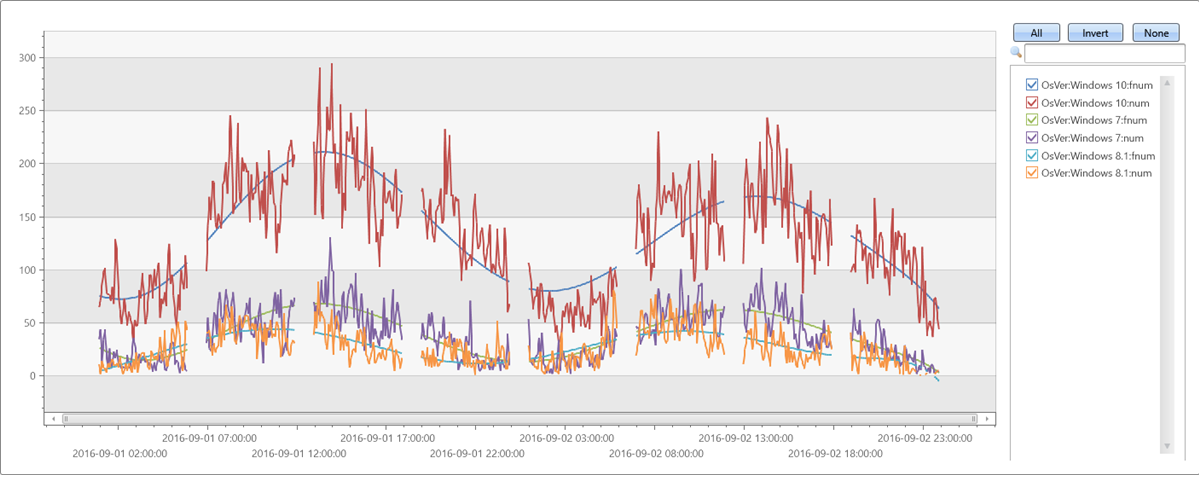
let max_t = datetime(2016-09-03);
demo_make_series1
| where TimeStamp between ((max_t-2d)..max_t)
| summarize num=count() by bin(TimeStamp, 5m), OsVer
| order by TimeStamp asc
| where hourofday(TimeStamp) % 6 != 0 // delete every 6th hour to create unevenly spaced time series
| summarize TimeStamp=make_list(TimeStamp), num=make_list(num) by OsVer
| extend fnum = dynamic(null), coeff=dynamic(null)
| invoke series_fit_poly_fl('num', 'fnum', 'coeff', 8, 'TimeStamp', True)
| render timechart with(ycolumns=num, fnum)
Output
Fifth order polynomial with noise on x & y axes
To use a query-defined function, invoke it after the embedded function definition.
let series_fit_poly_fl=(tbl:(*), y_series:string, y_fit_series:string, fit_coeff:string, degree:int, x_series:string='', x_istime:bool=False)
{
let kwargs = bag_pack('y_series', y_series, 'y_fit_series', y_fit_series, 'fit_coeff', fit_coeff, 'degree', degree, 'x_series', x_series, 'x_istime', x_istime);
let code = ```if 1:
y_series = kargs["y_series"]
y_fit_series = kargs["y_fit_series"]
fit_coeff = kargs["fit_coeff"]
degree = kargs["degree"]
x_series = kargs["x_series"]
x_istime = kargs["x_istime"]
def fit(ts_row, x_col, y_col, deg):
y = ts_row[y_col]
if x_col == "": # If there is no x column creates sequential range [1, len(y)]
x = np.arange(len(y)) + 1
else: # if x column exists check whether its a time column. If so, normalize it to the [1, len(y)] range, else take it as is.
if x_istime:
x = pd.to_numeric(pd.to_datetime(ts_row[x_col]))
x = x - x.min()
x = x / x.max()
x = x * (len(x) - 1) + 1
else:
x = ts_row[x_col]
coeff = np.polyfit(x, y, deg)
p = np.poly1d(coeff)
z = p(x)
return z, coeff
result = df
if len(df):
result[[y_fit_series, fit_coeff]] = df.apply(fit, axis=1, args=(x_series, y_series, degree,), result_type="expand")
```;
tbl
| evaluate python(typeof(*), code, kwargs)
};
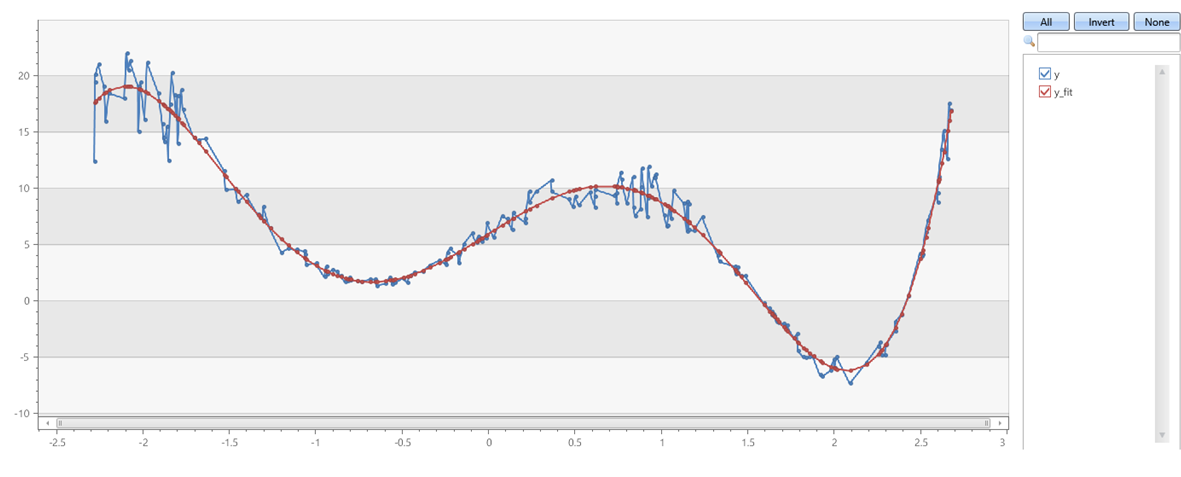
range x from 1 to 200 step 1
| project x = rand()*5 - 2.3
| extend y = pow(x, 5)-8*pow(x, 3)+10*x+6
| extend y = y + (rand() - 0.5)*0.5*y
| summarize x=make_list(x), y=make_list(y)
| extend y_fit = dynamic(null), coeff=dynamic(null)
| invoke series_fit_poly_fl('y', 'y_fit', 'coeff', 5, 'x')
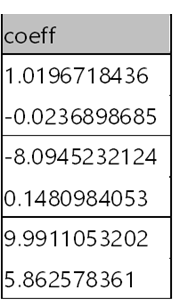
|fork (project-away coeff) (project coeff | mv-expand coeff)
| render linechart
Output
This feature isn't supported.
Feedback
Coming soon: Throughout 2024 we will be phasing out GitHub Issues as the feedback mechanism for content and replacing it with a new feedback system. For more information see: https://aka.ms/ContentUserFeedback.
Submit and view feedback for