series_rate_fl()
The function series_rate_fl() is a user-defined function (UDF) that calculates the average rate of metric increase per second. Its logic follows PromQL rate() function. It should be used for time series of counter metrics ingested to your cluster by Prometheus monitoring system, and retrieved by series_metric_fl().
Syntax
T | invoke series_rate_fl([ n_bins [, fix_reset ]])
T is a table returned from series_metric_fl(). Its schema includes (timestamp:dynamic, name:string, labels:string, value:dynamic).
Learn more about syntax conventions.
Parameters
| Name | Type | Required | Description |
|---|---|---|---|
| n_bins | int |
The number of bins to specify the gap between the extracted metric values for calculation of the rate. The function calculates the difference between the current sample and the one n_bins before, and divide it by the difference of their respective timestamps in seconds. The default is one bin. The default settings calculate irate(), the PromQL instantaneous rate function. | |
| fix_reset | bool |
Controls whether to check for counter resets and correct it like PromQL rate() function. The default is true. Set it to false to save redundant analysis in case no need to check for resets. |
Function definition
You can define the function by either embedding its code as a query-defined function, or creating it as a stored function in your database, as follows:
Define the function using the following let statement. No permissions are required.
Important
A let statement can't run on its own. It must be followed by a tabular expression statement. To run a working example of series_rate_fl(), see Examples.
let series_rate_fl=(tbl:(timestamp:dynamic, value:dynamic), n_bins:int=1, fix_reset:bool=true)
{
    tbl
    | where fix_reset                                                   //  Prometheus counters can only go up
    | mv-apply value to typeof(double) on
    ( extend correction = iff(value < prev(value), prev(value), 0.0)    // if the value decreases we assume it was reset to 0, so add last value
    | extend cum_correction = row_cumsum(correction)
    | extend corrected_value = value + cum_correction
    | summarize value = make_list(corrected_value))
    | union (tbl | where not(fix_reset))
    | extend timestampS = array_shift_right(timestamp, n_bins), valueS = array_shift_right(value, n_bins)
    | extend dt = series_subtract(timestamp, timestampS)
    | extend dt = series_divide(dt, 1e7)                              //  converts from ticks to seconds
    | extend dv = series_subtract(value, valueS)
    | extend rate = series_divide(dv, dt)
    | project-away dt, dv, timestampS, value, valueS
};
// Write your query to use the function here.
Examples
The following examples use the invoke operator to run the function.
Calculate average rate of metric increase
To use a query-defined function, invoke it after the embedded function definition.
let series_rate_fl=(tbl:(timestamp:dynamic, value:dynamic), n_bins:int=1, fix_reset:bool=true)
{
    tbl
    | where fix_reset                                                   //  Prometheus counters can only go up
    | mv-apply value to typeof(double) on
    ( extend correction = iff(value < prev(value), prev(value), 0.0)    // if the value decreases we assume it was reset to 0, so add last value
    | extend cum_correction = row_cumsum(correction)
    | extend corrected_value = value + cum_correction
    | summarize value = make_list(corrected_value))
    | union (tbl | where not(fix_reset))
    | extend timestampS = array_shift_right(timestamp, n_bins), valueS = array_shift_right(value, n_bins)
    | extend dt = series_subtract(timestamp, timestampS)
    | extend dt = series_divide(dt, 1e7)                              //  converts from ticks to seconds
    | extend dv = series_subtract(value, valueS)
    | extend rate = series_divide(dv, dt)
    | project-away dt, dv, timestampS, value, valueS
};
//
demo_prometheus
| invoke series_metric_fl('TimeStamp', 'Name', 'Labels', 'Val', 'writes', offset=now()-datetime(2020-12-08 00:00))
| invoke series_rate_fl(2)
| render timechart with(series=labels)
Output
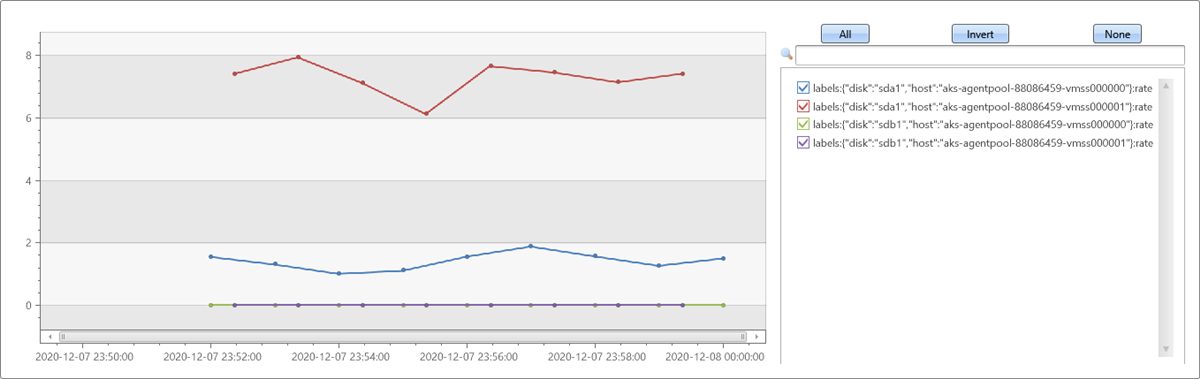
Selects the main disk of two hosts
The following example selects the main disk of two hosts, and assumes that the function is already installed. This example uses alternative direct calling syntax, specifying the input table as the first parameter:
To use a query-defined function, invoke it after the embedded function definition.
let series_rate_fl=(tbl:(timestamp:dynamic, value:dynamic), n_bins:int=1, fix_reset:bool=true)
{
tbl
| where fix_reset // Prometheus counters can only go up
| mv-apply value to typeof(double) on
( extend correction = iff(value < prev(value), prev(value), 0.0) // if the value decreases we assume it was reset to 0, so add last value
| extend cum_correction = row_cumsum(correction)
| extend corrected_value = value + cum_correction
| summarize value = make_list(corrected_value))
| union (tbl | where not(fix_reset))
| extend timestampS = array_shift_right(timestamp, n_bins), valueS = array_shift_right(value, n_bins)
| extend dt = series_subtract(timestamp, timestampS)
| extend dt = series_divide(dt, 1e7) // converts from ticks to seconds
| extend dv = series_subtract(value, valueS)
| extend rate = series_divide(dv, dt)
| project-away dt, dv, timestampS, value, valueS
};
//
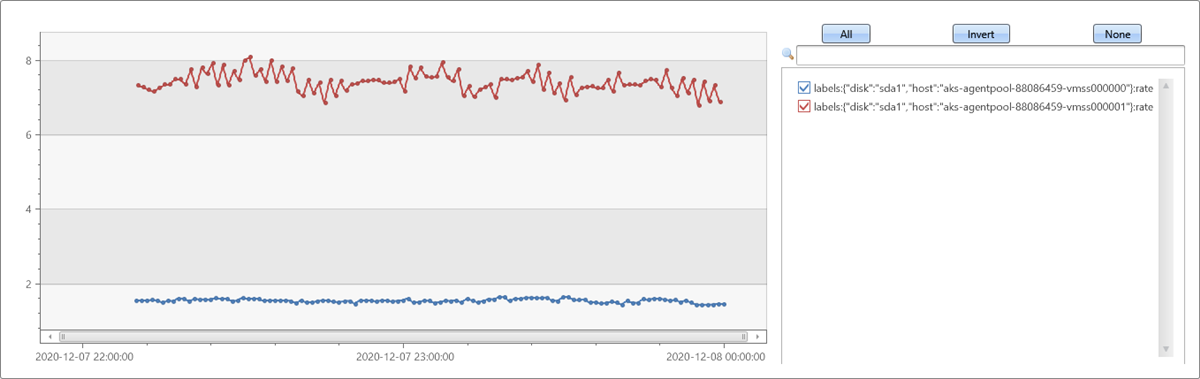
series_rate_fl(series_metric_fl(demo_prometheus, 'TimeStamp', 'Name', 'Labels', 'Val', 'writes', '"disk":"sda1"', lookback=2h, offset=now()-datetime(2020-12-08 00:00)), n_bins=10)
| render timechart with(series=labels)
Output
Feedback
Coming soon: Throughout 2024 we will be phasing out GitHub Issues as the feedback mechanism for content and replacing it with a new feedback system. For more information see: https://aka.ms/ContentUserFeedback.
Submit and view feedback for