series_rolling_fl()
The function series_rolling_fl() is a user-defined function (UDF) that applies rolling aggregation on a series. It takes a table containing multiple series (dynamic numerical array) and applies, for each series, a rolling aggregation function.
Prerequisites
- The Python plugin must be enabled on the cluster. This is required for the inline Python used in the function.
- The Python plugin must be enabled on the database. This is required for the inline Python used in the function.
Syntax
T | invoke series_rolling_fl(y_series, y_rolling_series, n, aggr, aggr_params, center)
Learn more about syntax conventions.
Parameters
| Name | Type | Required | Description |
|---|---|---|---|
| y_series | string |
✔️ | The name of the column that contains the series to fit. |
| y_rolling_series | string |
✔️ | The name of the column to store the rolling aggregation series. |
| n | int |
✔️ | The width of the rolling window. |
| aggr | string |
✔️ | The name of the aggregation function to use. See aggregation functions. |
| aggr_params | string |
Optional parameters for the aggregation function. | |
| center | bool |
Indicates whether the rolling window is applied symmetrically before and after the current point or applied from the current point backwards. By default, center is false, for calculation on streaming data. |
Aggregation functions
This function supports any aggregation function from numpy or scipy.stats that calculates a scalar out of a series. The following list isn't exhaustive:
summeanminmaxptp (max-min)percentilemedianstdvargmean(geometric mean)hmean(harmonic mean)mode(most common value)moment(nth moment)tmean(trimmed mean)tmintmaxtstdiqr(inter quantile range)
Function definition
You can define the function by either embedding its code as a query-defined function, or creating it as a stored function in your database, as follows:
Define the function using the following let statement. No permissions are required.
Important
A let statement can't run on its own. It must be followed by a tabular expression statement. To run a working example of series_rolling_fl(), see Examples.
let series_rolling_fl = (tbl:(*), y_series:string, y_rolling_series:string, n:int, aggr:string, aggr_params:dynamic=dynamic([null]), center:bool=true)
{
    let kwargs = bag_pack('y_series', y_series, 'y_rolling_series', y_rolling_series, 'n', n, 'aggr', aggr, 'aggr_params', aggr_params, 'center', center);
    let code = ```if 1:
        y_series = kargs["y_series"]
        y_rolling_series = kargs["y_rolling_series"]
        n = kargs["n"]
        aggr = kargs["aggr"]
        aggr_params = kargs["aggr_params"]
        center = kargs["center"]
        result = df
        in_s = df[y_series]
        func = getattr(np, aggr, None)
        if not func:
            import scipy.stats
            func = getattr(scipy.stats, aggr)
        if func:
            result[y_rolling_series] = list(pd.Series(in_s[i]).rolling(n, center=center, min_periods=1).apply(func, args=aggr_params).values for i in range(len(in_s)))
    ```;
    tbl
    | evaluate python(typeof(*), code, kwargs)
};
// Write your query to use the function here.
Examples
The following examples use the invoke operator to run the function.
Calculate rolling median of 9 elements
To use a query-defined function, invoke it after the embedded function definition.
let series_rolling_fl = (tbl:(*), y_series:string, y_rolling_series:string, n:int, aggr:string, aggr_params:dynamic=dynamic([null]), center:bool=true)
{
let kwargs = bag_pack('y_series', y_series, 'y_rolling_series', y_rolling_series, 'n', n, 'aggr', aggr, 'aggr_params', aggr_params, 'center', center);
let code = ```if 1:
y_series = kargs["y_series"]
y_rolling_series = kargs["y_rolling_series"]
n = kargs["n"]
aggr = kargs["aggr"]
aggr_params = kargs["aggr_params"]
center = kargs["center"]
result = df
in_s = df[y_series]
func = getattr(np, aggr, None)
if not func:
import scipy.stats
func = getattr(scipy.stats, aggr)
if func:
result[y_rolling_series] = list(pd.Series(in_s[i]).rolling(n, center=center, min_periods=1).apply(func, args=aggr_params).values for i in range(len(in_s)))
```;
tbl
| evaluate python(typeof(*), code, kwargs)
};
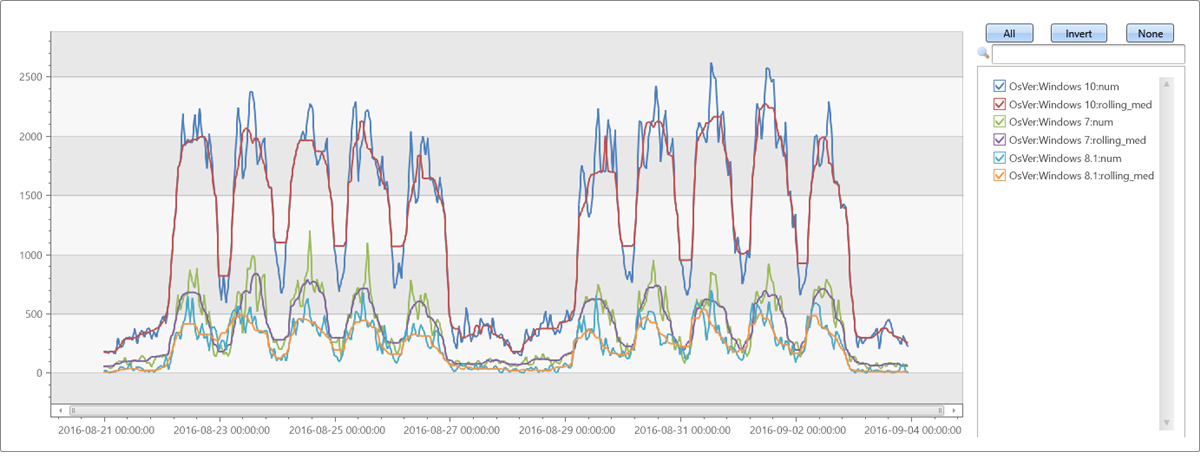
//
// Calculate rolling median of 9 elements
//
demo_make_series1
| make-series num=count() on TimeStamp step 1h by OsVer
| extend rolling_med = dynamic(null)
| invoke series_rolling_fl('num', 'rolling_med', 9, 'median')
| render timechart
Output
Calculate rolling min, max & 75th percentile of 15 elements
To use a query-defined function, invoke it after the embedded function definition.
let series_rolling_fl = (tbl:(*), y_series:string, y_rolling_series:string, n:int, aggr:string, aggr_params:dynamic=dynamic([null]), center:bool=true)
{
let kwargs = bag_pack('y_series', y_series, 'y_rolling_series', y_rolling_series, 'n', n, 'aggr', aggr, 'aggr_params', aggr_params, 'center', center);
let code = ```if 1:
y_series = kargs["y_series"]
y_rolling_series = kargs["y_rolling_series"]
n = kargs["n"]
aggr = kargs["aggr"]
aggr_params = kargs["aggr_params"]
center = kargs["center"]
result = df
in_s = df[y_series]
func = getattr(np, aggr, None)
if not func:
import scipy.stats
func = getattr(scipy.stats, aggr)
if func:
result[y_rolling_series] = list(pd.Series(in_s[i]).rolling(n, center=center, min_periods=1).apply(func, args=aggr_params).values for i in range(len(in_s)))
```;
tbl
| evaluate python(typeof(*), code, kwargs)
};
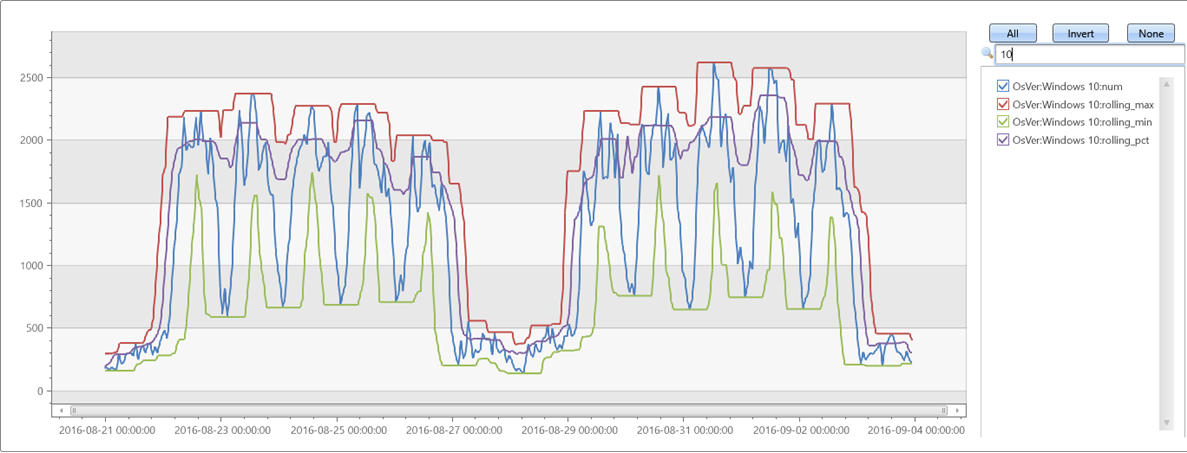
//
// Calculate rolling min, max & 75th percentile of 15 elements
//
demo_make_series1
| make-series num=count() on TimeStamp step 1h by OsVer
| extend rolling_min = dynamic(null), rolling_max = dynamic(null), rolling_pct = dynamic(null)
| invoke series_rolling_fl('num', 'rolling_min', 15, 'min', dynamic([null]))
| invoke series_rolling_fl('num', 'rolling_max', 15, 'max', dynamic([null]))
| invoke series_rolling_fl('num', 'rolling_pct', 15, 'percentile', dynamic([75]))
| render timechart
Output
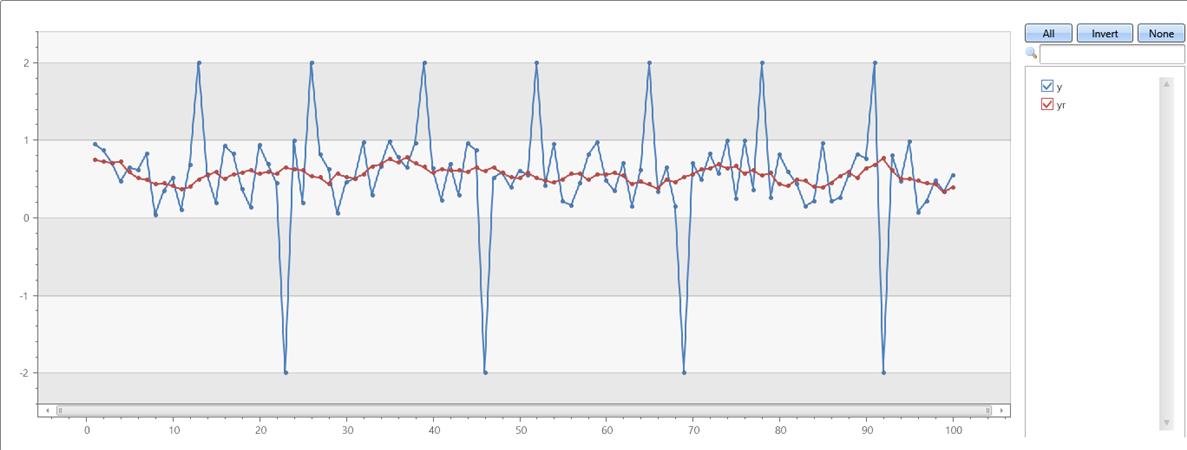
Calculate the rolling trimmed mean
To use a query-defined function, invoke it after the embedded function definition.
let series_rolling_fl = (tbl:(*), y_series:string, y_rolling_series:string, n:int, aggr:string, aggr_params:dynamic=dynamic([null]), center:bool=true)
{
    let kwargs = bag_pack('y_series', y_series, 'y_rolling_series', y_rolling_series, 'n', n, 'aggr', aggr, 'aggr_params', aggr_params, 'center', center);
    let code = ```if 1:
        y_series = kargs["y_series"]
        y_rolling_series = kargs["y_rolling_series"]
        n = kargs["n"]
        aggr = kargs["aggr"]
        aggr_params = kargs["aggr_params"]
        center = kargs["center"]
        result = df
        in_s = df[y_series]
        func = getattr(np, aggr, None)
        if not func:
            import scipy.stats
            func = getattr(scipy.stats, aggr)
        if func:
            result[y_rolling_series] = list(pd.Series(in_s[i]).rolling(n, center=center, min_periods=1).apply(func, args=aggr_params).values for i in range(len(in_s)))
    ```;
    tbl
    | evaluate python(typeof(*), code, kwargs)
};
range x from 1 to 100 step 1
| extend y=iff(x % 13 == 0, 2.0, iff(x % 23 == 0, -2.0, rand()))
| summarize x=make_list(x), y=make_list(y)
| extend yr = dynamic(null)
| invoke series_rolling_fl('y', 'yr', 7, 'tmean', pack_array(pack_array(-2, 2), pack_array(false, false))) //  trimmed mean: ignoring values outside [-2,2] inclusive
| render linechart
Output
This feature isn't supported.
Feedback
Coming soon: Throughout 2024 we will be phasing out GitHub Issues as the feedback mechanism for content and replacing it with a new feedback system. For more information see: https://aka.ms/ContentUserFeedback.
Submit and view feedback for