series_uv_anomalies_fl()
The function series_uv_anomalies_fl() is a user-defined function (UDF) that detects anomalies in time series by calling the Univariate Anomaly Detection API, part of Azure Cognitive Services. The function accepts a limited set of time series as numerical dynamic arrays and the required anomaly detection sensitivity level. Each time series is converted into the required JSON format and posts it to the Anomaly Detector service endpoint. The service response contains dynamic arrays of high/low/all anomalies, the modeled baseline time series, its normal high/low boundaries (a value above or below the high/low boundary is an anomaly) and the detected seasonality.
Note
Consider using the native function series_decompose_anomalies() which is more scalable and runs faster.
Prerequisites
- An Azure subscription. Create a free Azure account.
- A cluster and database. Create a cluster and database.
- The Python plugin must be enabled on the cluster. This is required for the inline Python used in the function.
- Create an Anomaly Detector resource and obtain its key to access the service.
- Enable the http_request plugin / http_request_post plugin on the cluster to access the anomaly detection service endpoint.
- Modify the callout policy for type
webapito access the anomaly detection service endpoint.
In the following function example, replace YOUR-AD-RESOURCE-NAME in the uri and YOUR-KEY in the Ocp-Apim-Subscription-Key of the header with your Anomaly Detector resource name and key.
Syntax
T | invoke series_uv_anomalies_fl(y_series [, sensitivity [, tsid]])
Learn more about syntax conventions.
Parameters
| Name | Type | Required | Description |
|---|---|---|---|
| y_series | string |
✔️ | The name of the input table column containing the values of the series to be anomaly detected. |
| sensitivity | integer | An integer in the range [0-100] specifying the anomaly detection sensitivity. 0 is the least sensitive detection, while 100 is the most sensitive indicating even a small deviation from the expected baseline would be tagged as anomaly. Default value: 85 | |
| tsid | string |
The name of the input table column containing the time series ID. Can be omitted when analyzing a single time series. |
Function definition
You can define the function by either embedding its code as a query-defined function, or creating it as a stored function in your database, as follows:
Define the function using the following let statement. No permissions are required.
Important
A let statement can't run on its own. It must be followed by a tabular expression statement. To run a working example of series_uv_anomalies_fl(), see Examples.
let series_uv_anomalies_fl=(tbl:(*), y_series:string, sensitivity:int=85, tsid:string='_tsid')
{
    let uri = 'https://YOUR-AD-RESOURCE-NAME.cognitiveservices.azure.com/anomalydetector/v1.0/timeseries/entire/detect';
    let headers=dynamic({'Ocp-Apim-Subscription-Key': h'YOUR-KEY'});
    let kwargs = bag_pack('y_series', y_series, 'sensitivity', sensitivity);
    let code = ```if 1:
        import json
        y_series = kargs["y_series"]
        sensitivity = kargs["sensitivity"]
        json_str = []
        for i in range(len(df)):
            row = df.iloc[i, :]
            ts = [{'value':row[y_series][j]} for j in range(len(row[y_series]))]
            json_data = {'series': ts, "sensitivity":sensitivity}     # auto-detect period, or we can force 'period': 84. We can also add 'maxAnomalyRatio':0.25 for maximum 25% anomalies
            json_str = json_str + [json.dumps(json_data)]
        result = df
        result['json_str'] = json_str
    ```;
    tbl
    | evaluate python(typeof(*, json_str:string), code, kwargs)
    | extend _tsid = column_ifexists(tsid, 1)
    | partition by _tsid (
       project json_str
       | evaluate http_request_post(uri, headers, dynamic(null))
       | project period=ResponseBody.period, baseline_ama=ResponseBody.expectedValues, ad_ama=series_add(0, ResponseBody.isAnomaly), pos_ad_ama=series_add(0, ResponseBody.isPositiveAnomaly)
       , neg_ad_ama=series_add(0, ResponseBody.isNegativeAnomaly), upper_ama=series_add(ResponseBody.expectedValues, ResponseBody.upperMargins), lower_ama=series_subtract(ResponseBody.expectedValues, ResponseBody.lowerMargins)
       | extend _tsid=toscalar(_tsid)
      )
};
// Write your query to use the function here.
Examples
The following examples use the invoke operator to run the function.
Use series_uv_anomalies_fl() to detect anomalies
To use a query-defined function, invoke it after the embedded function definition.
let series_uv_anomalies_fl=(tbl:(*), y_series:string, sensitivity:int=85, tsid:string='_tsid')
{
let uri = 'https://YOUR-AD-RESOURCE-NAME.cognitiveservices.azure.com/anomalydetector/v1.0/timeseries/entire/detect';
let headers=dynamic({'Ocp-Apim-Subscription-Key': h'YOUR-KEY'});
let kwargs = bag_pack('y_series', y_series, 'sensitivity', sensitivity);
let code = ```if 1:
import json
y_series = kargs["y_series"]
sensitivity = kargs["sensitivity"]
json_str = []
for i in range(len(df)):
row = df.iloc[i, :]
ts = [{'value':row[y_series][j]} for j in range(len(row[y_series]))]
json_data = {'series': ts, "sensitivity":sensitivity} # auto-detect period, or we can force 'period': 84. We can also add 'maxAnomalyRatio':0.25 for maximum 25% anomalies
json_str = json_str + [json.dumps(json_data)]
result = df
result['json_str'] = json_str
```;
tbl
| evaluate python(typeof(*, json_str:string), code, kwargs)
| extend _tsid = column_ifexists(tsid, 1)
| partition by _tsid (
project json_str
| evaluate http_request_post(uri, headers, dynamic(null))
| project period=ResponseBody.period, baseline_ama=ResponseBody.expectedValues, ad_ama=series_add(0, ResponseBody.isAnomaly), pos_ad_ama=series_add(0, ResponseBody.isPositiveAnomaly)
, neg_ad_ama=series_add(0, ResponseBody.isNegativeAnomaly), upper_ama=series_add(ResponseBody.expectedValues, ResponseBody.upperMargins), lower_ama=series_subtract(ResponseBody.expectedValues, ResponseBody.lowerMargins)
| extend _tsid=toscalar(_tsid)
)
};
let etime=datetime(2017-03-02);
let stime=datetime(2017-01-01);
let dt=1h;
let ts = requests
| make-series value=avg(value) on timestamp from stime to etime step dt
| extend _tsid='TS1';
ts
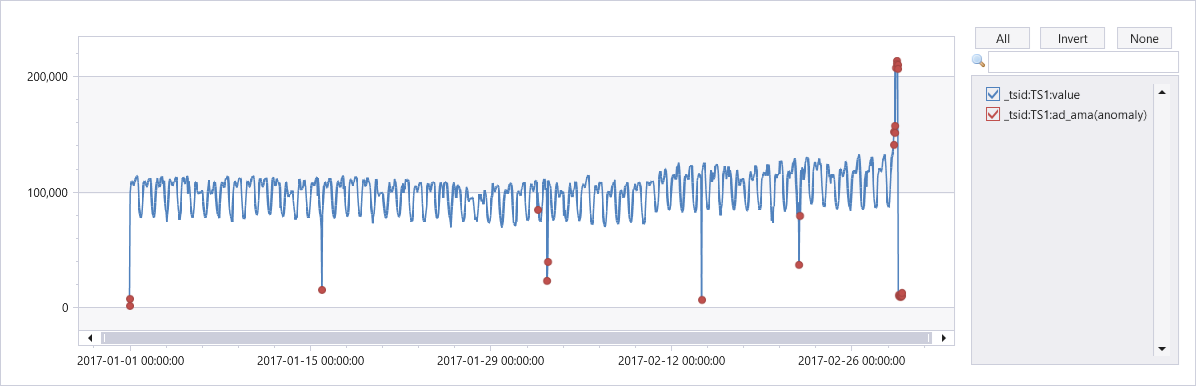
| invoke series_uv_anomalies_fl('value')
| lookup ts on _tsid
| render anomalychart with(xcolumn=timestamp, ycolumns=value, anomalycolumns=ad_ama)
Output
Compare series_uv_anomalies_fl() and native series_decompose_anomalies()
The following example compares the Univariate Anomaly Detection API to the native series_decompose_anomalies() function over three time series and assumes the series_uv_anomalies_fl() function is already defined in the database:
To use a query-defined function, invoke it after the embedded function definition.
let series_uv_anomalies_fl=(tbl:(*), y_series:string, sensitivity:int=85, tsid:string='_tsid')
{
    let uri = 'https://YOUR-AD-RESOURCE-NAME.cognitiveservices.azure.com/anomalydetector/v1.0/timeseries/entire/detect';
    let headers=dynamic({'Ocp-Apim-Subscription-Key': h'YOUR-KEY'});
    let kwargs = bag_pack('y_series', y_series, 'sensitivity', sensitivity);
    let code = ```if 1:
        import json
        y_series = kargs["y_series"]
        sensitivity = kargs["sensitivity"]
        json_str = []
        for i in range(len(df)):
            row = df.iloc[i, :]
            ts = [{'value':row[y_series][j]} for j in range(len(row[y_series]))]
            json_data = {'series': ts, "sensitivity":sensitivity}     # auto-detect period, or we can force 'period': 84. We can also add 'maxAnomalyRatio':0.25 for maximum 25% anomalies
            json_str = json_str + [json.dumps(json_data)]
        result = df
        result['json_str'] = json_str
    ```;
    tbl
    | evaluate python(typeof(*, json_str:string), code, kwargs)
    | extend _tsid = column_ifexists(tsid, 1)
    | partition by _tsid (
       project json_str
       | evaluate http_request_post(uri, headers, dynamic(null))
       | project period=ResponseBody.period, baseline_ama=ResponseBody.expectedValues, ad_ama=series_add(0, ResponseBody.isAnomaly), pos_ad_ama=series_add(0, ResponseBody.isPositiveAnomaly)
       , neg_ad_ama=series_add(0, ResponseBody.isNegativeAnomaly), upper_ama=series_add(ResponseBody.expectedValues, ResponseBody.upperMargins), lower_ama=series_subtract(ResponseBody.expectedValues, ResponseBody.lowerMargins)
       | extend _tsid=toscalar(_tsid)
      )
};
let ts = demo_make_series2
| summarize TimeStamp=make_list(TimeStamp), num=make_list(num) by sid;
ts
| invoke series_uv_anomalies_fl('num', 'sid', 90)
| join ts on $left._tsid == $right.sid
| project-away _tsid
| extend (ad_adx, score_adx, baseline_adx)=series_decompose_anomalies(num, 1.5, -1, 'linefit')
| project-reorder num, *
| render anomalychart with(series=sid, xcolumn=TimeStamp, ycolumns=num, baseline_adx, baseline_ama, lower_ama, upper_ama, anomalycolumns=ad_adx, ad_ama)
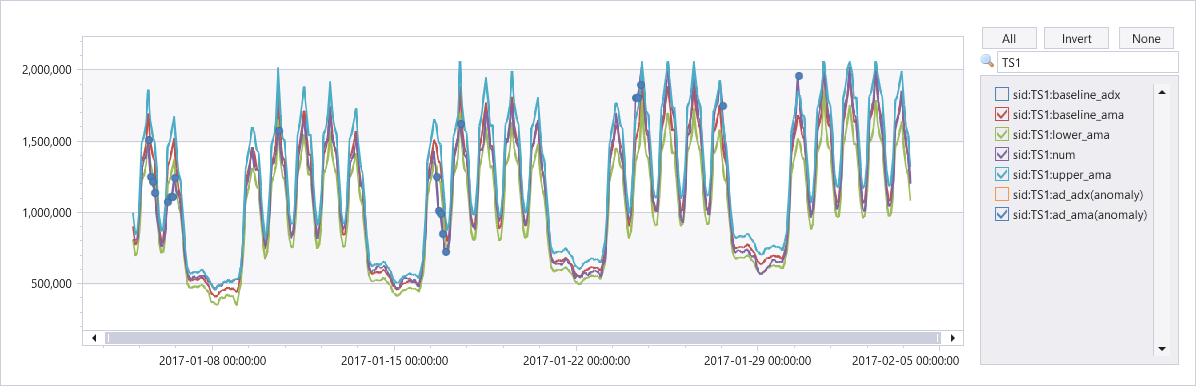
Output
The following graph shows anomalies detected by the Univariate Anomaly Detection API on TS1. You can also select TS2 or TS3 in the chart filter box.
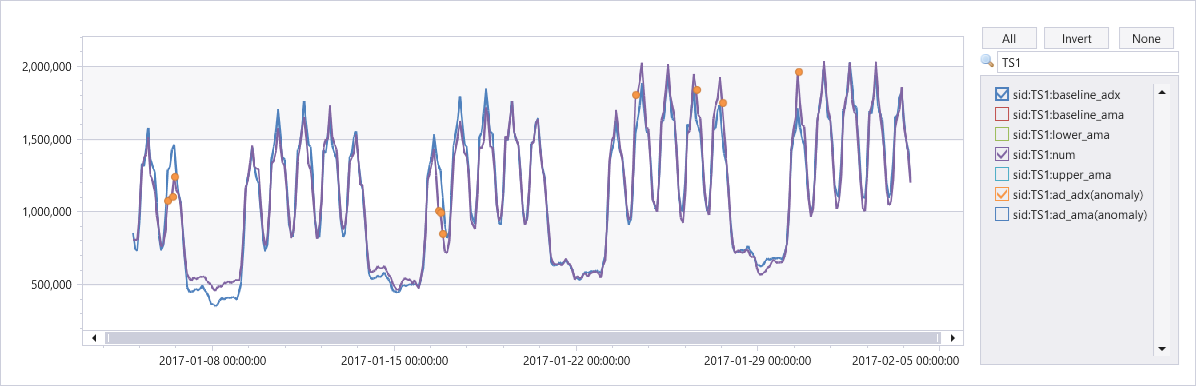
The following graph shows the anomalies detected by native function on TS1.
This feature isn't supported.
Feedback
Coming soon: Throughout 2024 we will be phasing out GitHub Issues as the feedback mechanism for content and replacing it with a new feedback system. For more information see: https://aka.ms/ContentUserFeedback.
Submit and view feedback for