Note
Access to this page requires authorization. You can try signing in or changing directories.
Access to this page requires authorization. You can try changing directories.
APPLIES TO:  Azure Data Factory
Azure Synapse Analytics
Azure Data Factory
Azure Synapse Analytics
Tip
Data Factory in Microsoft Fabric is the next generation of Azure Data Factory, with a simpler architecture, built-in AI, and new features. If you're new to data integration, start with Fabric Data Factory. Existing ADF workloads can upgrade to Fabric to access new capabilities across data science, real-time analytics, and reporting.
Mapping data flows in Azure Data Factory and Synapse pipelines provide a code-free interface to design and run data transformations at scale. If you're not familiar with mapping data flows, see the Mapping Data Flow Overview. This article highlights various ways to tune and optimize your data flows so that they meet your performance benchmarks.
Watch the following video to see shows some sample timings transforming data with data flows.
Monitoring data flow performance
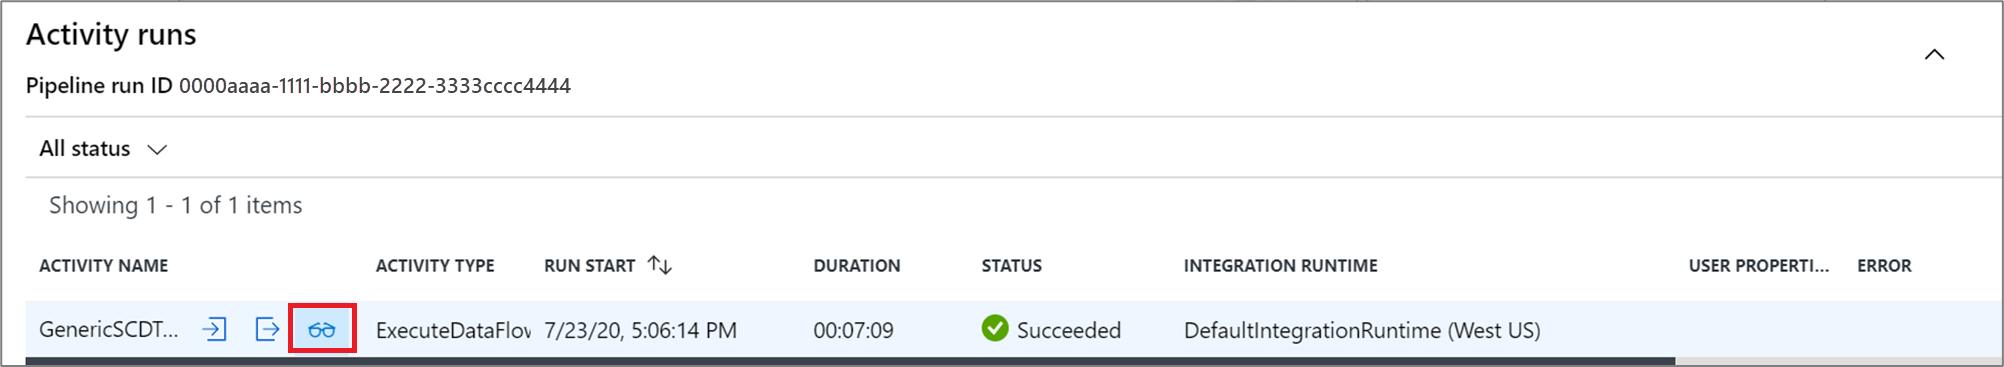
Once you verify your transformation logic using debug mode, run your data flow end-to-end as an activity in a pipeline. Data flows are operationalized in a pipeline using the execute data flow activity. The data flow activity has a unique monitoring experience compared to other activities that displays a detailed execution plan and performance profile of the transformation logic. To view detailed monitoring information of a data flow, select the eyeglasses icon in the activity run output of a pipeline. For more information, see Monitoring mapping data flows.
When you're monitoring data flow performance, there are four possible bottlenecks to look out for:
- Cluster start-up time
- Reading from a source
- Transformation time
- Writing to a sink
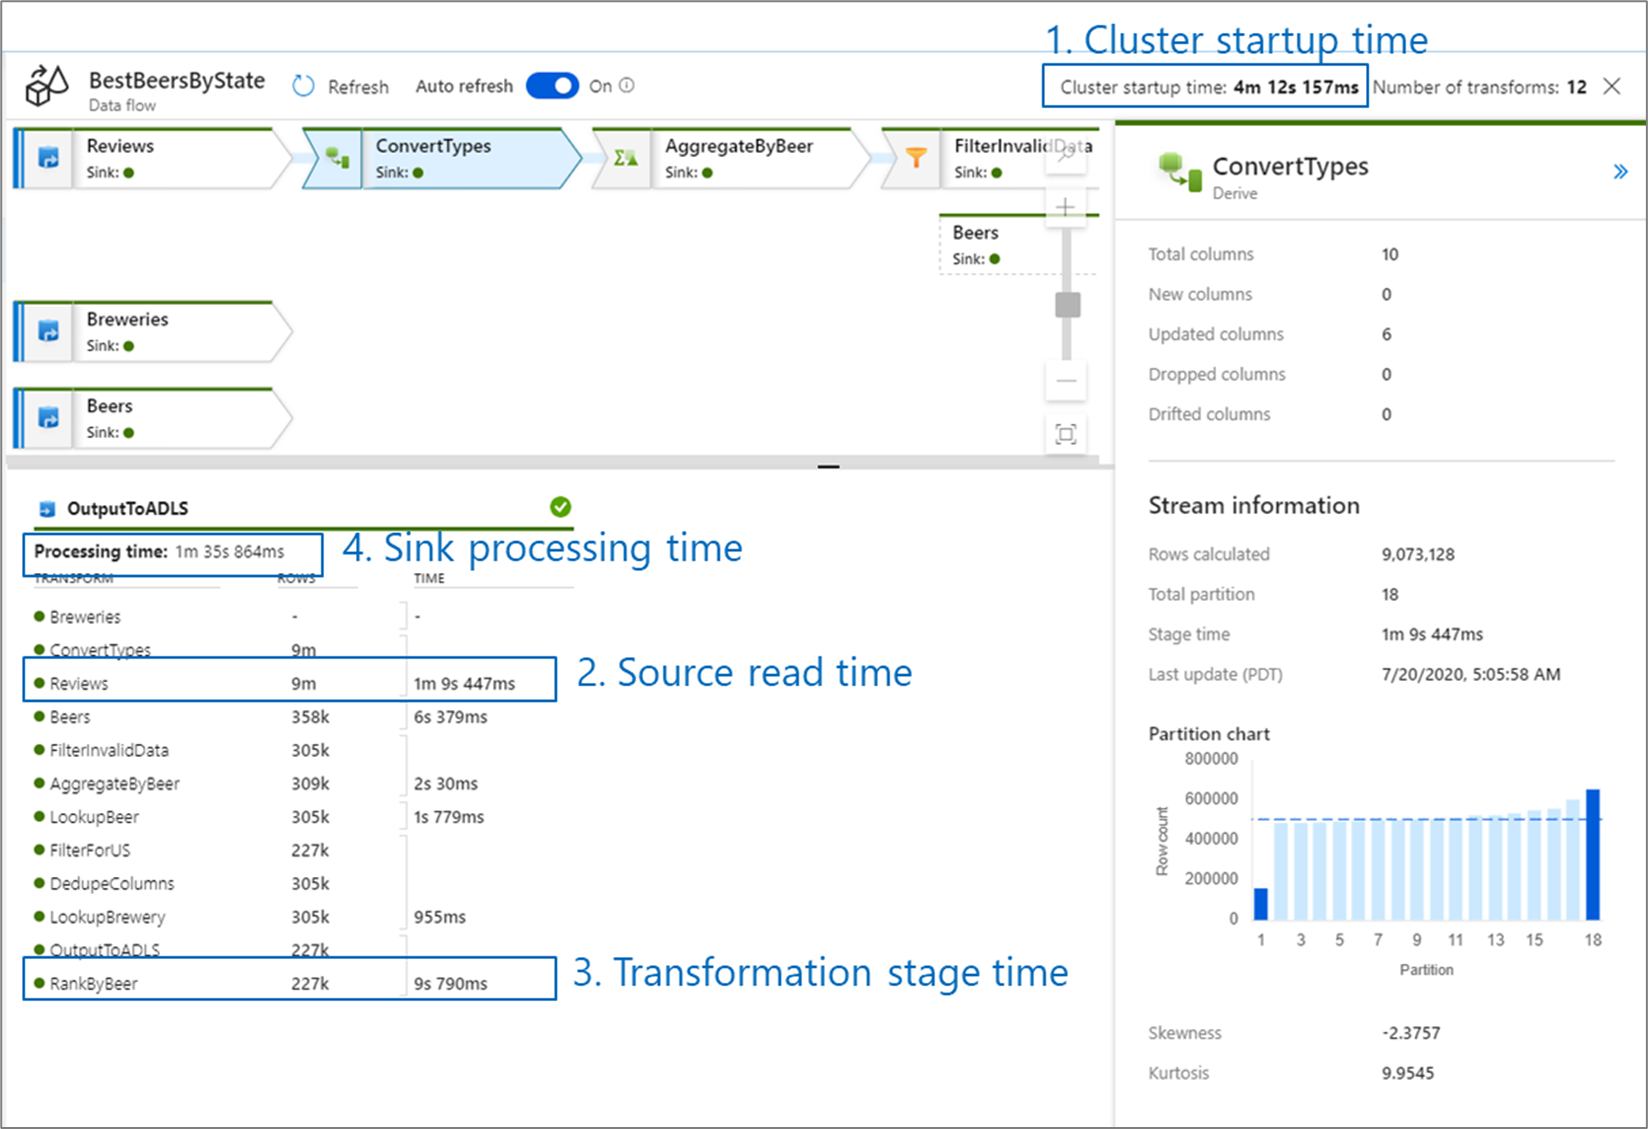
Cluster start-up time is the time it takes to spin up an Apache Spark cluster. This value is located in the top-right corner of the monitoring screen. Data flows run on a just-in-time model where each job uses an isolated cluster. This startup time generally takes 3-5 minutes. For sequential jobs, startup time can be reduced by enabling a time to live value. For more information, see the Time to live section in Integration Runtime performance.
Data flows utilize a Spark optimizer that reorders and runs your business logic in 'stages' to perform as quickly as possible. For each sink that your data flow writes to, the monitoring output lists the duration of each transformation stage, along with the time it takes to write data into the sink. The time that is the largest is likely the bottleneck of your data flow. If the transformation stage that takes the largest contains a source, then you might want to look at further optimizing your read time. If a transformation is taking a long time, then you might need to repartition or increase the size of your integration runtime. If the sink processing time is large, you might need to scale up your database or verify you aren't outputting to a single file.
Once you have identified the bottleneck of your data flow, use the below optimizations strategies to improve performance.
Testing data flow logic
When you're designing and testing data flows from UI, debug mode allows you to interactively test against a live Spark cluster, which allows you to preview data and execute your data flows without waiting for a cluster to warm up. For more information, see Debug Mode.
Optimize tab
The Optimize tab contains settings to configure the partitioning scheme of the Spark cluster. This tab exists in every transformation of data flow and specifies whether you want to repartition the data after the transformation has completed. Adjusting the partitioning provides control over the distribution of your data across compute nodes and data locality optimizations that can have both positive and negative effects on your overall data flow performance.
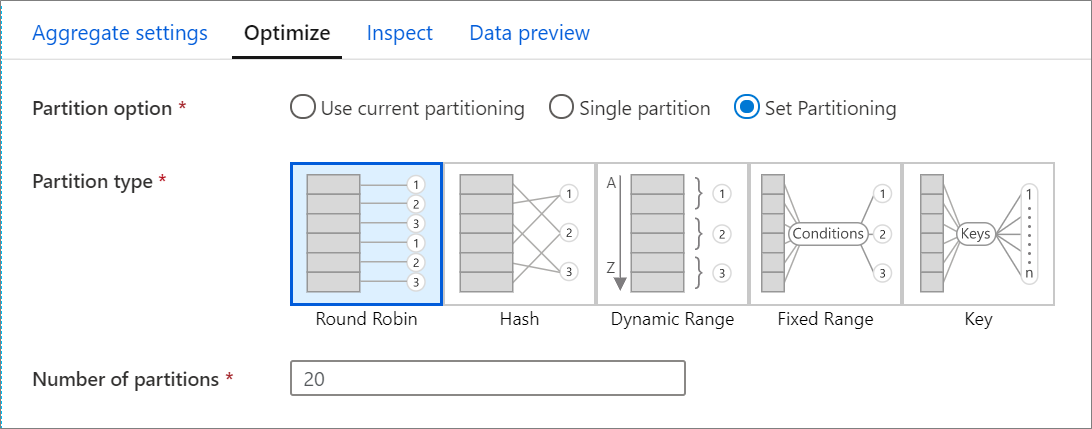
By default, Use current partitioning is selected which instructs the service keep the current output partitioning of the transformation. As repartitioning data takes time, Use current partitioning is recommended in most scenarios. Scenarios where you might want to repartition your data include after aggregates and joins that significantly skew your data or when using Source partitioning on a SQL database.
To change the partitioning on any transformation, select the Optimize tab and select the Set Partitioning radio button. You're presented with a series of options for partitioning. The best method of partitioning differs based on your data volumes, candidate keys, null values, and cardinality.
Important
Single partition combines all the distributed data into a single partition. This is a very slow operation that also significantly affects all downstream transformation and writes. This option is strongly discouraged unless there is an explicit business reason to use it.
The following partitioning options are available in every transformation:
Round robin
Round robin distributes data equally across partitions. Use round-robin when you don't have good key candidates to implement a solid, smart partitioning strategy. You can set the number of physical partitions.
Hash
The service produces a hash of columns to produce uniform partitions such that rows with similar values fall in the same partition. When you use the Hash option, test for possible partition skew. You can set the number of physical partitions.
Dynamic range
The dynamic range uses Spark dynamic ranges based on the columns or expressions that you provide. You can set the number of physical partitions.
Fixed range
Build an expression that provides a fixed range for values within your partitioned data columns. To avoid partition skew, you should have a good understanding of your data before you use this option. The values you enter for the expression are used as part of a partition function. You can set the number of physical partitions.
Key
If you have a good understanding of the cardinality of your data, key partitioning might be a good strategy. Key partitioning creates partitions for each unique value in your column. You can't set the number of partitions because the number is based on unique values in the data.
Tip
Manually setting the partitioning scheme reshuffles the data and can offset the benefits of the Spark optimizer. A best practice is to not manually set the partitioning unless you need to.
Logging level
If you don't require every pipeline execution of your data flow activities to fully log all verbose telemetry logs, you can optionally set your logging level to "Basic" or "None". When executing your data flows in "Verbose" mode (default), you're requesting the service to fully log activity at each individual partition level during your data transformation. This can be an expensive operation, so only enabling verbose when troubleshooting can improve your overall data flow and pipeline performance. "Basic" mode only logs transformation durations while "None" will only provide a summary of durations.

Related content
See other Data Flow articles related to performance: