Note
Access to this page requires authorization. You can try signing in or changing directories.
Access to this page requires authorization. You can try changing directories.
Microsoft Defender for IoT alerts enhance your network security and operations with real-time details about events logged in your network. Alerts are triggered when OT network sensors detect changes or suspicious activity in network traffic that needs your attention.
For example:

Use the details shown on the Alerts page, or on an alert details page, to investigate and take action that remediates any risk to your network, either from related devices or the network process that triggered the alert.
Tip
Use alert remediation steps to help your SOC teams understand possible issues and resolutions. We recommend that you review recommended remediation steps before updating an alert status or taking action on the device or network.
Alert management options
Defender for IoT alerts are available in the Azure portal or OT network sensor consoles. With Enterprise IoT security, alerts are also available for Enterprise IoT devices detected by Defender for Endpoint, in Microsoft 365 Defender.
While you can view alert details, investigate alert context, and triage and manage alert statuses from any of these locations, each location also offers extra alert actions. The following table describes the alerts supported for each location and the extra actions available from that location only:
| Location | Description | Extra alert actions |
|---|---|---|
| Azure portal | Alerts from all cloud-connected OT sensors | - View related MITRE ATT&CK tactics and techniques - Use out-of-the-box workbooks for visibility into high priority alerts - View alerts from Microsoft Sentinel and run deeper investigations with Microsoft Sentinel playbooks and workbooks. |
| OT network sensor consoles | Alerts generated by that OT sensor | - View the alert's source and destination in the Device map - View related events on the Event timeline - Forward alerts directly to partner vendors - Create alert comments - Create custom alert rules - Unlearn alerts |
| Microsoft 365 Defender | Alerts generated for Enterprise IoT devices detected by Microsoft Defender for Endpoint | - Manage alerts data together with other Microsoft 365 Defender data, including advanced hunting |
Tip
Any alerts generated from different sensors in the same zone within a 10-minute timeframe, with the same type, status, alert protocol, and associated devices, are listed as a single, unified alert.
- The 10-minute timeframe is based on the alert's first detection time.
- The single, unified alert lists all of the sensors that detected the alert.
- Alerts are combined based on the alert protocol, and not the device protocol.
For more information, see:
- Alert data retention
- Accelerating OT alert workflows
- Alert statuses and triaging options
- Plan OT sites and zones
Alert options also differ depending on your location and user role. For more information, see Azure user roles and permissions and On-premises users and roles.
Aggregating alert violations
Alert fatigue caused by a high number of identical alerts could lead to your team failing to see or remediate vital alerts. Each alert listed in the Alerts page is a result of a network violation, for example the Unpermitted Usage of Modbus Function Code. Aggregating violations with the same parameters and remediation requirements into one single alert listing, reduces the number of alerts displayed on the Alerts page. The matching parameters differ depending on the alert type. For example, the Unpermitted Usage of Modbus Function Code alert needs to have the same source and destination IP addresses to produce an aggregated alert violation. The aggregated alert could include alerts with different violation codes, such as read and write codes.
You download the aggregated alert violation data, that lists each alert with the relevant parameters and functions, as a CSV file in the Violations tab of the alert details. This data can help teams to identify patterns, assess impact and prioritize responses more effectively based on the remediation suggestions in the Take action tab. Only alerts that have the same remediation process are aggregated into a single alert. However, individual violation events can still be viewed separately within their respective devices, providing additional clarity.
The alerts that can be aggregated are listed in the Alert reference policy engine alerts tables under the Aggregarted heading.
Alert grouping appears in both the OT sensor console and the Azure portal. For more information, see remediate aggregated alerts in Sensor console and remediate aggregated alerts in Azure portal.
Focused alerts in OT/IT environments
Organizations where sensors are deployed between OT and IT networks deal with many alerts, related to both OT and IT traffic. The amount of alerts, some of which are irrelevant, can cause alert fatigue and affect overall performance. To address these challenges, Defender for IoT's detection policy steers its different alert engines to focus on alerts with business impact and relevance to an OT network, and reduce low-value IT related alerts. For example, the Unauthorized internet connectivity alert is highly relevant in an OT network, but has relatively low value in an IT network.
To focus the alerts triggered in these environments, all alert engines, except for the Malware engine, trigger alerts only if they detect a related OT subnet or protocol.
However, to maintain triggering of alerts that indicate critical scenarios:
- The Malware engine triggers malware alerts regardless of whether the alerts are related to OT or IT devices.
- The other engines include exceptions for critical scenarios. For example, the Operational engine triggers alerts related to sensor traffic, regardless of whether the alert is related to OT or IT traffic.
Managing OT alerts in a hybrid environment
Users working in hybrid environments might be managing OT alerts in Defender for IoT on the Azure portal or the OT sensor.
Note
While the sensor console displays an alert's Last detection field in real-time, Defender for IoT in the Azure portal may take up to one hour to display the updated time. This explains a scenario where the last detection time in the sensor console isn't the same as the last detection time in the Azure portal.
Alert statuses are otherwise fully synchronized between the Azure portal and the OT sensor. This means that regardless of where you manage the alert in Defender for IoT, the alert is updated in other locations as well.
Setting an alert status to Closed or Muted on a sensor updates the alert status to Closed on the Azure portal.
Tip
If you're working with Microsoft Sentinel, we recommend that you configure the integration to also synchronize alert status with Microsoft Sentinel, and then manage alert statuses together with the related Microsoft Sentinel incidents.
For more information, see Tutorial: Investigate and detect threats for IoT devices.
Enterprise IoT alerts and Microsoft Defender for Endpoint
If you're using Enterprise IoT security in Microsoft 365 Defender, alerts for Enterprise IoT devices detected by Microsoft Defender for Endpoint are available in Microsoft 365 Defender only. Many network-based detections from Microsoft Defender for Endpoint are pertinent to Enterprise IoT devices, such as alerts triggered by scans involving managed endpoints.
For more information, see Securing IoT devices in the enterprise and the Alerts queue in Microsoft 365 Defender.
Accelerating OT alert workflows
New alerts are automatically closed if no identical traffic is detected 90 days after the initial detection. If identical traffic is detected within those first 90 days, the 90-day count is reset.
In addition to the default behavior, you might want to help your SOC and OT management teams triage and remediate alerts faster. Sign into an OT sensor as an Admin user to use the following options:
Create custom alert rules. OT sensors only.
Add custom alert rules to trigger alerts for specific activity on your network that's not covered by out-of-the-box functionality.
For example, for an environment running MODBUS, you might add a rule to detect any written commands to a memory register on a specific IP address and ethernet destination.
For more information, see Create custom alert rules on an OT sensor.
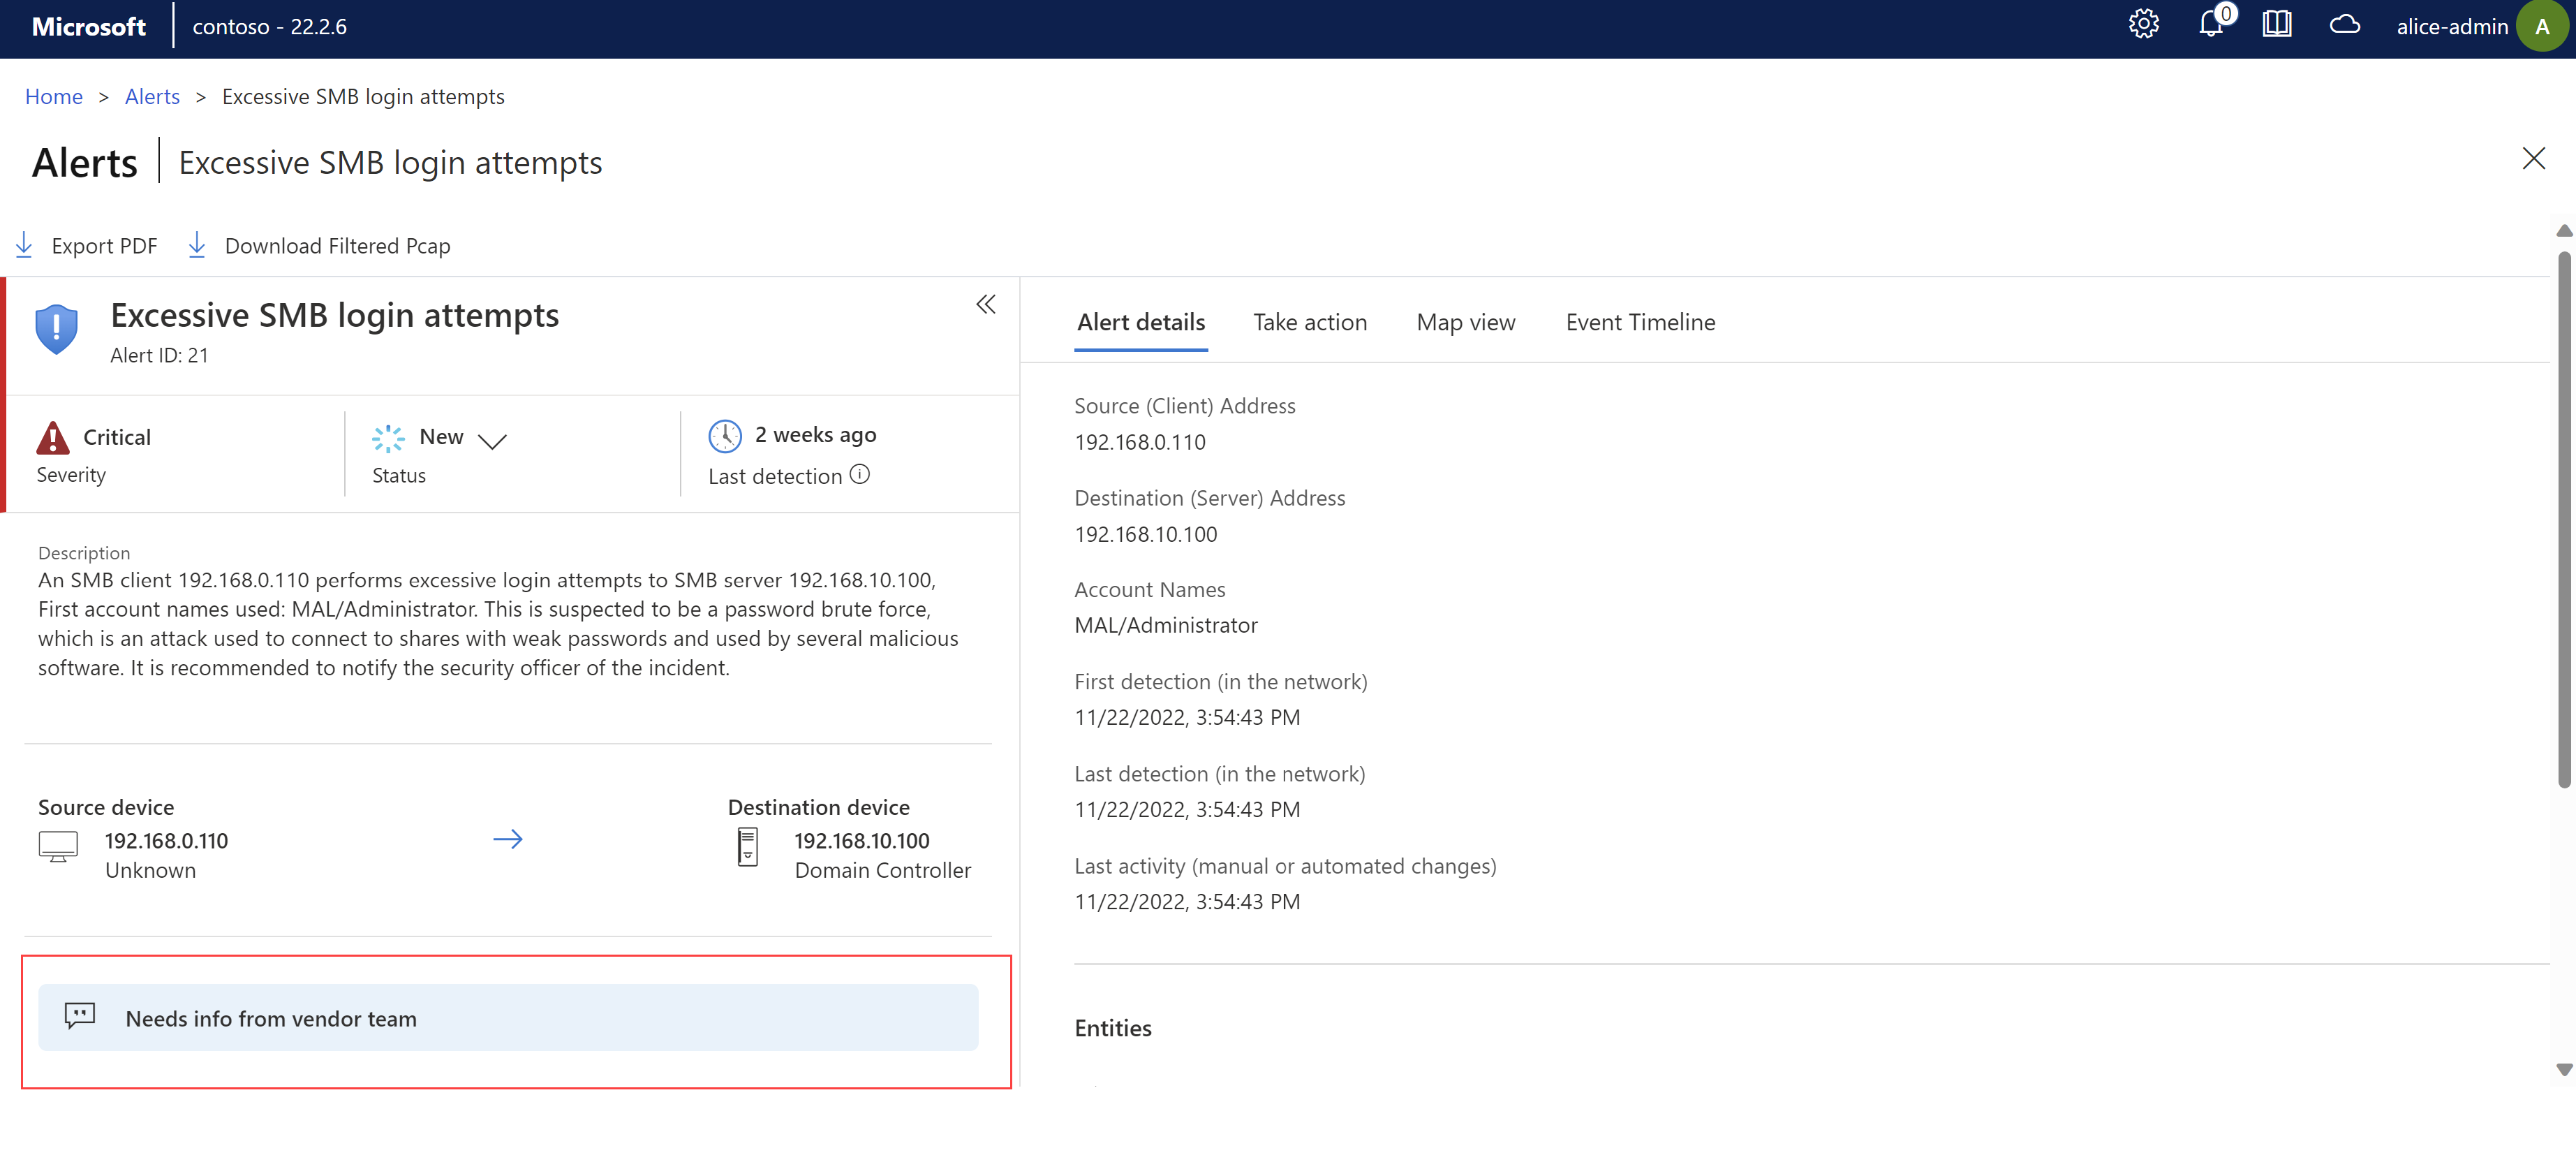
Create alert comments. OT sensors only.
Create a set of alert comments that other OT sensor users can add to individual alerts, with details like custom mitigation steps, communications to other team members, or other insights or warnings about the event.
Team members can reuse these custom comments as they triage and manage alert statuses. Alert comments are shown in a comments area on an alert details page. For example:
For more information, see Create alert comments on an OT sensor.
Forward alert data to partner systems to partner SIEMs, syslog servers, specified email addresses and more.
Supported from the OT sensors, for more information, see Forward alert information.
Alert statuses and triaging options
Use the following alert statuses and triaging options to manage alerts across Defender for IoT.
When triaging an alert, consider that some alerts might reflect valid network changes, such as an authorized device attempting to access a new resource on another device.
While triaging options from the OT sensor are available for OT alerts only, options available on the Azure portal are available for both OT and Enterprise IoT alerts.
Use the following table to learn more about each alert status and triage option.
| Status / triage action | Available on | Description |
|---|---|---|
| New | - Azure portal - OT network sensors |
New alerts are alerts that haven't yet been triaged or investigated by the team. New traffic detected for the same devices doesn't generate a new alert, but is added to the existing alert. Note: You might see multiple, New alerts with the same name. In such cases, each separate alert is triggered by separate traffic, on different sets of devices. |
| Active | - Azure portal only | Set an alert to Active to indicate that an investigation is underway, but that the alert can't yet be closed or otherwise triaged. This status has no effect elsewhere in Defender for IoT. |
| Closed | - Azure portal - OT network sensors |
Close an alert to indicate that it's fully investigated, and you want to be alerted again the next time the same traffic is detected. Closing an alert adds it to the sensor event timeline. |
| Learn | - Azure portal - OT network sensors Unlearning an alert is available only on the OT sensor. |
Learn an alert when you want to close it and add it as allowed traffic, so that you aren't alerted again the next time the same traffic is detected. For example, when the sensor detects firmware version changes following standard maintenance procedures, or when a new, expected device is added to the network. Learning an alert closes the alert and adds an item to the sensor event timeline. Detected traffic is included in data mining reports, but not when calculating other OT sensor reports. Learning alerts is available for selected alerts only, mostly those triggered by Policy and Anomaly engine alerts. |
| Mute | - OT network sensors Unmuting an alert is available only on the OT sensor. |
Mute an alert when you want to close it and not see again for the same traffic, but without adding the alert allowed traffic. For example, when the Operational engine triggers an alert indicating that the PLC Mode was changed on a device. The new mode might indicate that the PLC isn't secure, but after investigation, it's determined that the new mode is acceptable. Muting an alert closes it, but doesn't add an item to the sensor event timeline. Detected traffic is included in data mining reports, but not when calculating data for other sensor reports. Muting an alert is available for selected alerts only, mostly those triggered by the Anomaly, Protocol Violation, or Operational engines. |
Triage OT alerts during learning mode
Learning mode refers to the initial period after an OT sensor is deployed, when your OT sensor learns your network's baseline activity, including the devices and protocols in your network, and the regular file transfers that occur between specific devices.
Use learning mode to perform an initial triage on the alerts in your network, learning those you want to mark as authorized, expected activity. Learned traffic doesn't generate new alerts the next time the same traffic is detected.
For more information, see Create a learned baseline of OT alerts.
Next steps
Review alert types and messages to help you understand and plan remediation actions and playbook integrations. For more information, see OT monitoring alert types and descriptions.