In this quickstart, you'll learn how to provision and deploy app resources to Azure using an Azure Developer CLI (azd) template and only a few azd commands. azd templates are standard code repositories that include your application source code, as well as azd configuration and infrastructure files to provision Azure resources. To learn more about azd templates and how they can accelerate your Azure provisioning and deployment process see What are Azure Developer CLI templates?.
Select and deploy the template
For the steps ahead, you'll use the following template to provision and deploy an app on Azure:
You can also select a template that matches your preferences from the Awesome AZD template gallery site. Regardless of which template you use, you'll end up with the template code in your development environment and be able to run commands to build, redeploy, and monitor the app in Azure.
Select your preferred environment to continue:
A local development environment is a great choice for traditional development workflows. You'll clone the template repository down onto your device and run commands against a local installation of azd.
Prerequisites
Initialize the project
In File Explorer or a terminal, create a new empty directory, and change into it.
Run the azd init command and specify the template you want to use as a parameter:
azd init --template todo-nodejs-mongo
azd init --template todo-python-mongo
azd init --template todo-csharp-cosmos-sql
azd init --template todo-java-mongo-aca
Enter an environment name when prompted, such as azdquickstart, which sets a naming prefix for the resource group that will be created to hold the Azure resources. What is an Environment Name in azd?
After you specify the environment, azd clones the template project to your machine and initializes the project.
Provision and deploy the app resources
Run the azd auth login command and azd launches a browser for you to complete the sign-in process.
azd auth login
Run the azd up command:
azd up
Once you are signed-in to Azure, you will be prompted for the following information:
| Parameter |
Description |
Azure Location |
The Azure location where your resources will be deployed. |
Azure Subscription |
The Azure Subscription where your resources will be deployed. |
Select your desired values and press enter. The azd up command handles the following tasks for you using the template configuration and infrastructure files:
- Creates and configures all necessary Azure resources (
azd provision), including:
- Access policies and roles for your account
- Service-to-service communication with Managed Identities
- Packages and deploys the code (
azd deploy)
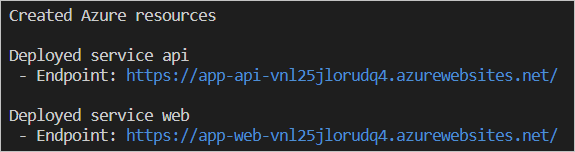
When the azd up command completes successfully, the CLI displays two links to view resources created:
- ToDo API app
- ToDo web app frontend
Note
You can call azd up as many times as you like to both provision and deploy updates to your application.
The deployment may fail due to a resource being undeployable in the selected region. Because this is a quick start, it is safe to delete the .azure directory and try azd up again. When asked, select a different region. In a more advanced scenario you could selectively edit files within the .azure directory to change the region.
The Azure Developer CLI provides a Visual Studio Code extension to streamline working with azd features. For example, you can use the command palette interface to run azd commands. You'll need to install the Azure Developer CLI extension for Visual Studio Code to complete the steps ahead.
Install the Azure Developer CLI extension
Open Visual Studio Code.
From the View menu, select Extensions.
In the search field, enter Azure Developer CLI.
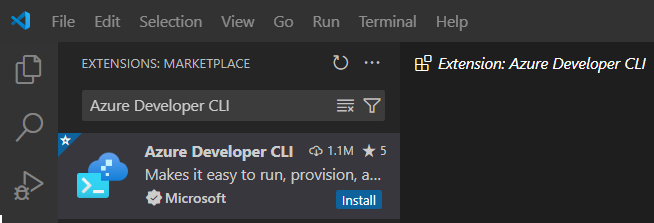
Select Install and wait for the installation process to complete.
Initialize a new app
Open an empty directory in Visual Studio Code.
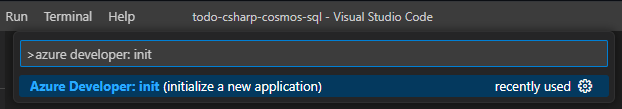
From the View menu, select Command Palette....
Search for the Azure Developer CLI (azd): Initialize app (init) command and press enter. The azd up command instructs azd to provision and deploy the app resources.
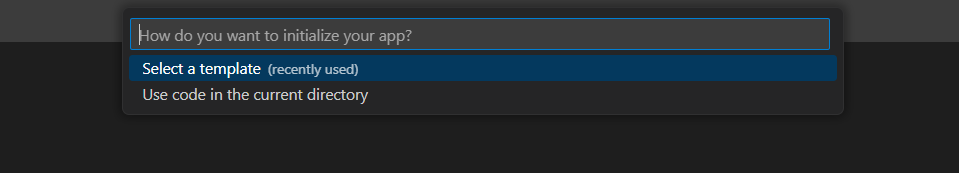
Choose the Select a template workflow.
Search for the React Web App with Node.js API and MongoDB on Azure template and press enter to select it.
Visual Studio Code clones down the azd template. The template includes infrastructure as code files in the infra folder and a sample app in the src folder. The infrastructure as code files provision the required resources on Azure required by the app when it is deployed.
Search for the React Web App with Python API and MongoDB on Azure template and press enter to select it.
Visual Studio Code clones down the azd template. The template includes infrastructure as code files in the infra folder and a sample app in the src folder. The infrastructure as code files provision the required resources on Azure required by the app when it is deployed.
Search for the React Web App with C# API and MongoDB on Azure template and press enter to select it.
Visual Studio Code clones down the azd template. The template includes infrastructure as code files in the infra folder and a sample app in the src folder. The infrastructure as code files provision the required resources on Azure required by the app when it is deployed.
Search for the Containerized React Web App with Java API and MongoDB on Azure template and press enter to select it.awesome-azd.
Visual Studio Code clones down the azd template. The template includes infrastructure as code files in the infra folder and a sample app in the src folder. The infrastructure as code files provision the required resources on Azure required by the app when it is deployed.
After the template is cloned, Visual Studio Code opens a terminal to prompt you for an environment name. Enter a short name of your choosing such as azdvscode and press enter.
Enter a new environment name: [? for help] azdvscode
The environment name influences the naming of resources provisioned in Azure and creates a folder in the .azure template directory to store certain environment settings.
Provision and deploy the app resources
Open the Command Palette and search for the Azure Developer CLI (azd): Package, Provision and Deploy(up) command and press enter. The azd up command instructs azd to provision and deploy the app resources.
Visual Studio Code opens a terminal window to display the progress of the provisioning and deployment process. azd uses the subscription and location settings you selected during the init process when deploying resources.
Note
The provisioning and deployment process can take several minutes.
When the deploy process complete, select the link in the output window provided by azd to launch your site in the browser.
Codespaces are a great option for developers who prefer to work in containerized cloud environments and avoid installing tools or dependencies locally.
Set up your Codespace
- Above the file list, click Use this template > Open in a Codespace.
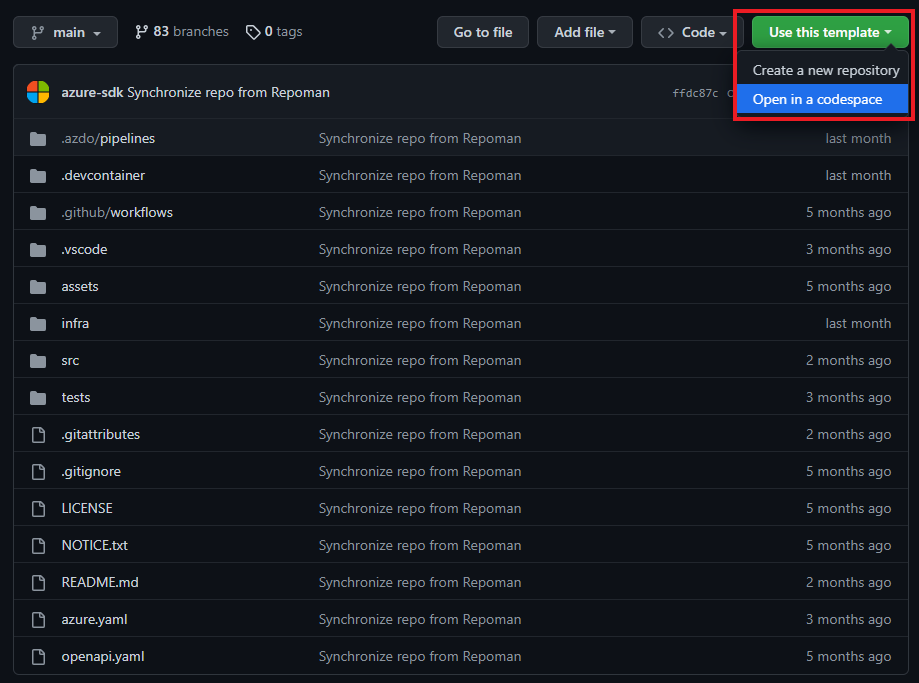
With Codespaces, all pre-requisites are installed for you, including the azd Visual Studio Code extension.
Run the template
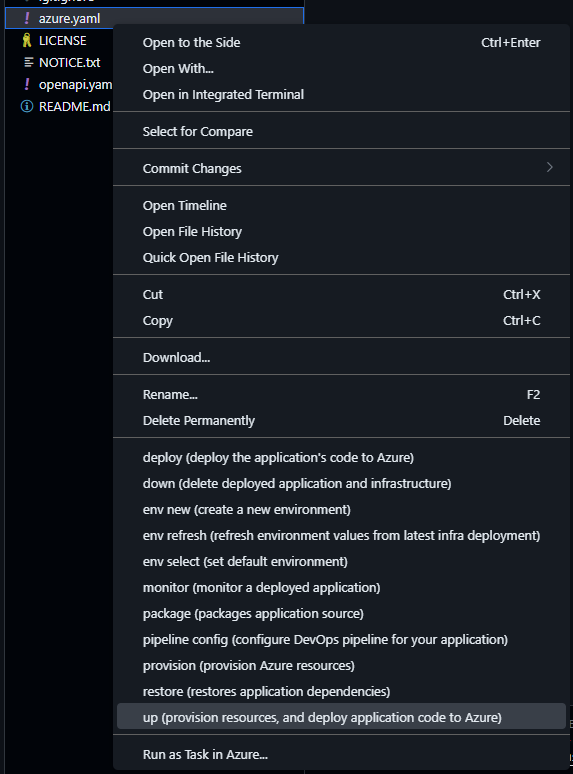
Once your Codespace is created, right-click azure.yaml in the root directory. From the options, select up (provision resources, and deploy code to Azure).
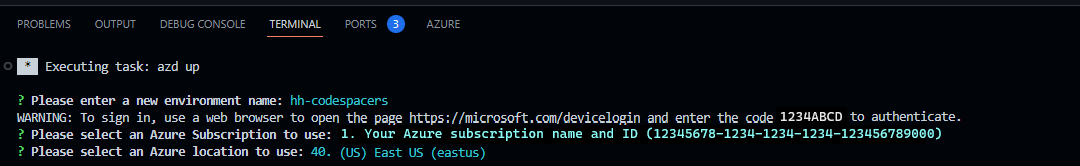
When you run the azd up command, you'll be prompted to provide the following information and to sign in using a web browser and an authentication code:
| Parameter |
Description |
Environment Name |
Prefix for the resource group that will be created to hold all Azure resources. What is an Environment Name in azd? You can always create a new environment with azd env new. |
Azure Location |
The Azure location where your resources will be deployed. |
Azure Subscription |
The Azure Subscription where your resources will be deployed. |
This process may take some time to complete, as the azd up command handles the following tasks:
- Creates and configures all necessary Azure resources (
azd provision).
- Configures access policies and roles for your account.
- Implements service-to-service communication with Managed Identities.
- Packages and deploys the code (
azd deploy).
Once you've provided the necessary parameters and the azd up command completes, the CodeSpaces terminal displays two Azure portal links to view resources created:
- ToDo API app
- ToDo web app frontend
What happened?
Upon successful completion of the azd up command:
Note
- You can call
azd up as many times as you like to both provision and deploy your application.
- Run and debug that requires launching a web browser is currently not support because of known limitation with GitHub Codespaces. For better experience, we recommend using Codespaces in Desktop.
A DevContainer is a Docker image that includes all of the prerequisites you need to work with the azd template on your local machine. They're a great choice for developers who prefer containerized environments that still run on a local device instead of a cloud service like GitHub Codespaces.
Prerequisites
Initialize the project
Open a terminal, create a new empty directory, and change into it.
Run the following command to initialize the project:
azd init --template todo-nodejs-mongo
azd init --template todo-python-mongo
azd init --template todo-csharp-cosmos-sql
azd init --template todo-java-mongo-aca
When you run the azd init command, you'll be prompted to provide the following information:
| Parameter |
Description |
Environment Name |
Prefix for the resource group that will be created to hold all Azure resources. What is an Environment Name in azd? You can always create a new environment with azd env new. |
Open the DevContainer
- Open the project in VS Code.
- Press F1 and choose:
Remote-Containers: Rebuild and Reopen in Container
Run up command
Run the following command:
azd up
When you run the azd up command, you'll be prompted to provide the following information:
| Parameter |
Description |
Azure Location |
The Azure location where your resources will be deployed. |
Azure Subscription |
The Azure Subscription where your resources will be deployed. |
The azd up command may take some time to run as it completes the following steps:
- Creates and configures all necessary Azure resources (
azd provision), including:
- Access policies and roles for your account
- Service-to-service communication with Managed Identities
- Packages and deploys the code (
azd deploy)
Once you've provided the necessary parameters and the azd up command completes, the CLI displays two Azure portal links to view resources created:
- ToDo API app
- ToDo web app frontend
Note
You can run azd up as many times as you like to both provision and deploy your application to the same region and with the same configuration values you provided on the first run.
Clean up resources
When you no longer need the resources created in this article, run the following command to power down the app:
azd down
If you want to redeploy to a different region, delete the .azure directory before running azd up again. In a more advanced scenario you could selectively edit files within the .azure directory to change the region.
Request help
For information on how to file a bug, request help, or propose a new feature for the Azure Developer CLI, please visit the troubleshooting and support page.
Next steps