Note
Access to this page requires authorization. You can try signing in or changing directories.
Access to this page requires authorization. You can try changing directories.
Azure DevOps Services | Azure DevOps Server 2022 - Azure DevOps Server 2019
The Chart for Work Items widget lets you select any flat-list query and configure it to support any of the supported chart types. The steps you take to configure this widget are very similar to those you take to configure a query-based chart.
To view a chart on a dashboard, you can start from Queries>Charts page and choose to add the chart to the dashboard. Charts added to the dashboard show up as a Chart for Work Items widget that you can relabel, resize, and reconfigure. Or, you can add a Chart for Work Items widget, select the query, and configure the chart as normal.
The only task you can accomplish from the Chart for Work Items widget that you can't from the Queries>Charts page is grouping work items by Tags. This feature is supported for Azure DevOps server 2022 and later versions.
Prerequisites
Note
Users with Stakeholder access for a public project have full access to query chart features just like users with Basic access. For more information, see Stakeholder access quick reference.
| Category | Requirements |
|---|---|
| Access | Project member with at least Basic access. Users with Stakeholder access can't view or create charts from the Queries page. They can view charts added to a team dashboard. For more information, see Stakeholder access quick reference. |
| Permissions | - By default, users with at least Basic access can create charts. Users with Stakeholder access can't view or create charts from the Queries page, however, they can view charts added to a team dashboard. For more information, see Stakeholder access quick reference. - To save a query to a Shared Queries folder: Permissions to save queries under a folder. For more information, see Set permissions on queries and query folders. - To add a widget to a team dashboard: Member of the team or member of the Project Administrators security group. - To add a widget to a project dashboard: Dashboard creator or Edit permissions for the dashboard, or member of the Project Administrators security group. - To view a query-based widget added to a dashboard: Read permissions to the underlying query. If that permission is denied, the widget displays a Widget failed to load message. |
| Queries | - Only flat-list queries support charts. - To add a chart to a dashboard: Save the query to a Shared Queries folder. To do so, get permissions to save queries under a folder. |
For more information about dashboard permissions, see Set dashboard permissions.
Define and save a flat-list query
From the Chart for Work Items widget, you select the query that contains the work items you want to chart. When creating a query to support your chart, follow the guidelines provided in Create a flat-list query.
Tip
If you start to configure a Chart for Work Items widget and then add the query you want to select, you must refresh your dashboard browser page in order to select the newly added query.
Create a dashboard
Prior to adding a widget to a dashboard, you must first add the dashboard to the project. To learn how, see Add, rename, and delete dashboards.
Add the Chart for Work Items widget to a dashboard
From the web portal, open the dashboard you want to add the chart to.
To add widgets to the dashboard, select
 Edit to open the widget catalog.
Note
If you don't see the
Edit option, then you need to get permissions to edit the dashboard.Select the Chart for Work Items widget and then select Add or drag it onto the dashboard.
To configure the widget, select the widget's
 More actions and choose the
  Configure option.
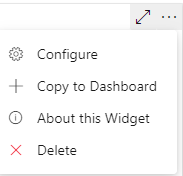
The Configuration dialog opens.
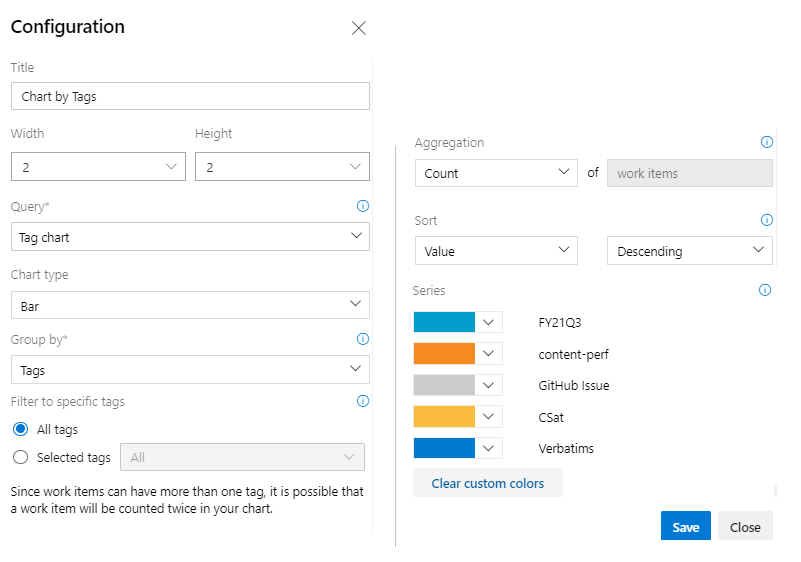
Enter a Title, select the Width and Height, and then select the flat-list Query on which the chart is based. Next, choose the Chart type.
Give the chart a title, select the flat list query on which the chart is based, and choose the chart type.
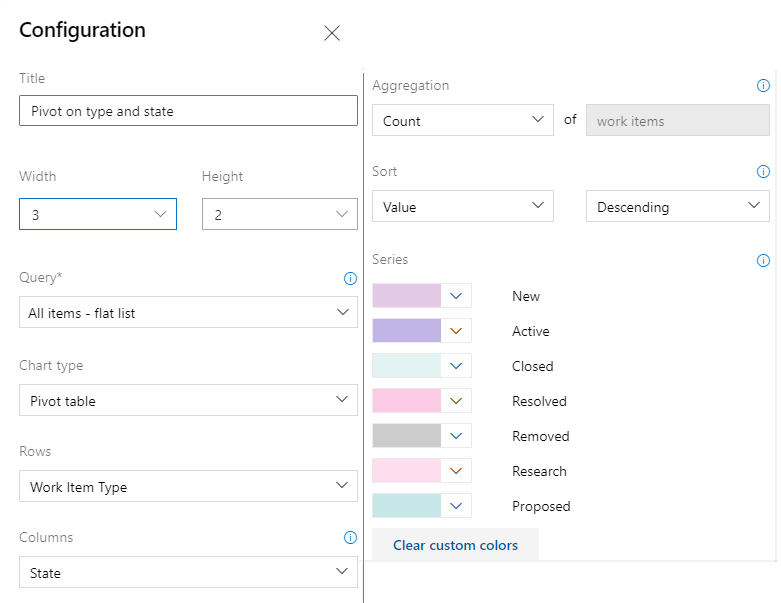
Based on your chart type, specify values for the remaining fields. Change a chart color simply by choosing another color from those shown. For additional guidance on choosing and configuring specific chart types, see Track progress with status and trend query-based charts.
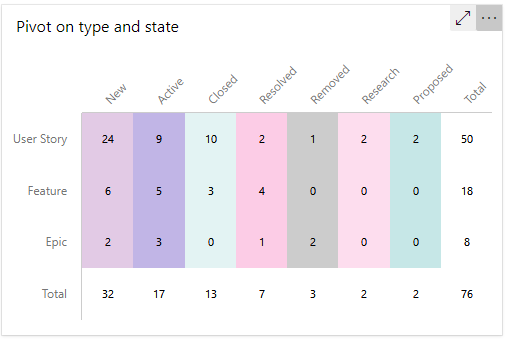
After you save your changes, you'll see the new chart has been added to the dashboard.
Tip
If the chart doesn't display all the rows or columns you want, try changing the chart Width and Height. Pivot tables and other chart types will display more data based on the area provided on the dashboard.
Drag the tile anywhere on the dashboard to put it where you want it.
When you're finished with your changes, select Done Editing to exit dashboard edit mode.
Group by Tags chart
Note
You can't group a query-based chart by tags, however, you can group a Chart for Work Items widget by tags that you add to a dashboard.
To group a chart by tags, perform the same steps provided in the previous section. Make sure that your flat-list query contains Tags in the query clause or as a column option. Then, select Tags for the Group by selection. To filter the chart to show only some tags, select the Selected tags radio button and then choose the tags you want the chart to display.
For more information about using tags, see Add tags to work items.