Note
Access to this page requires authorization. You can try signing in or changing directories.
Access to this page requires authorization. You can try changing directories.
Use the Monitor dashboard in Microsoft Foundry to see how agents use a toolbox and identify calls that need investigation. Review tool selection, skill usage, agent-to-agent (A2A) calls, and errors for a specific toolbox version.
The dashboard reads telemetry from the Application Insights resource connected to your Foundry project. Its metrics reflect the selected toolbox version, date range, and agent filter.
Prerequisites
- A Foundry project with an existing toolbox.
- A saved toolbox version used by an agent. To see activity, the agent must make calls through that version.
- An Application Insights resource to collect telemetry. You can connect it from Monitor settings.
- Permission to query the connected Application Insights resource. For telemetry access, use the Log Analytics Reader role. For additional requirements, including protected log tables, see Set up tracing.
Open the Monitor dashboard
Open the toolbox that your agent uses, and select the version you want to examine.
Sign in to the Foundry portal, and open your project.
Select Build > Tools > Toolboxes.
Open a toolbox, and select Monitor.
Use the version selector in the toolbox header to select the version your agent calls.
Changing the version changes the activity shown in the dashboard. Calls to another version aren't included.
Connect Application Insights
Check the telemetry connection before you interpret the dashboard. The connection applies to the project, not just the selected toolbox.
In Monitor, select Settings.
Under App. Insights resource, check the connection status and the selected Application insights resource name.
If no resource is connected, connect an Application Insights resource. If necessary, select a different resource.
For connection and permission setup, see Connect Application Insights to your Foundry project.
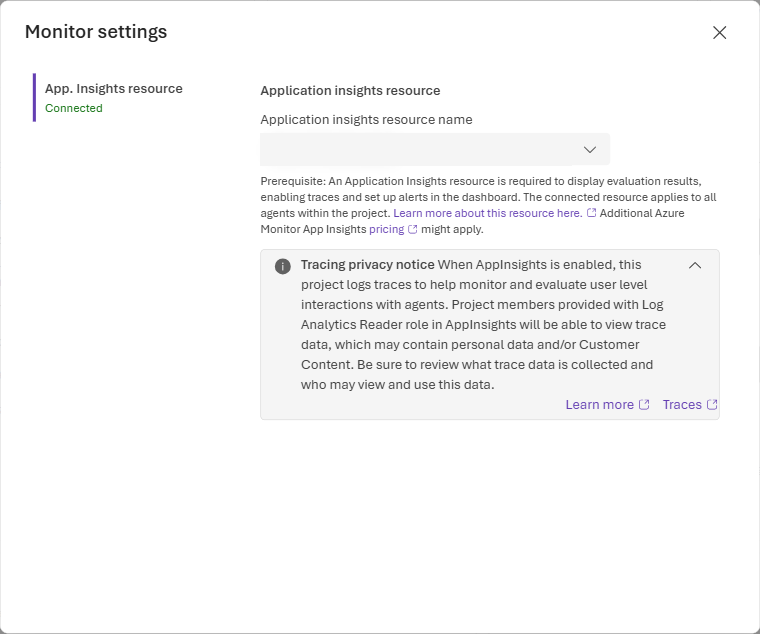
Close Monitor settings to return to the dashboard.
Trace data can contain user inputs, tool arguments, and tool results. Review access to that data before enabling tracing. Storage, retention, and charges follow your Application Insights configuration.
Filter the activity
Use the filters to compare activity for the same version and time period.
Choose Last Day, 7D, or 1M, or use the date-range control to select a custom range.
Leave All agents selected to review overall activity, or select an agent to focus on its calls.
Review Total calls, Success rate, and Active agents before examining individual charts.
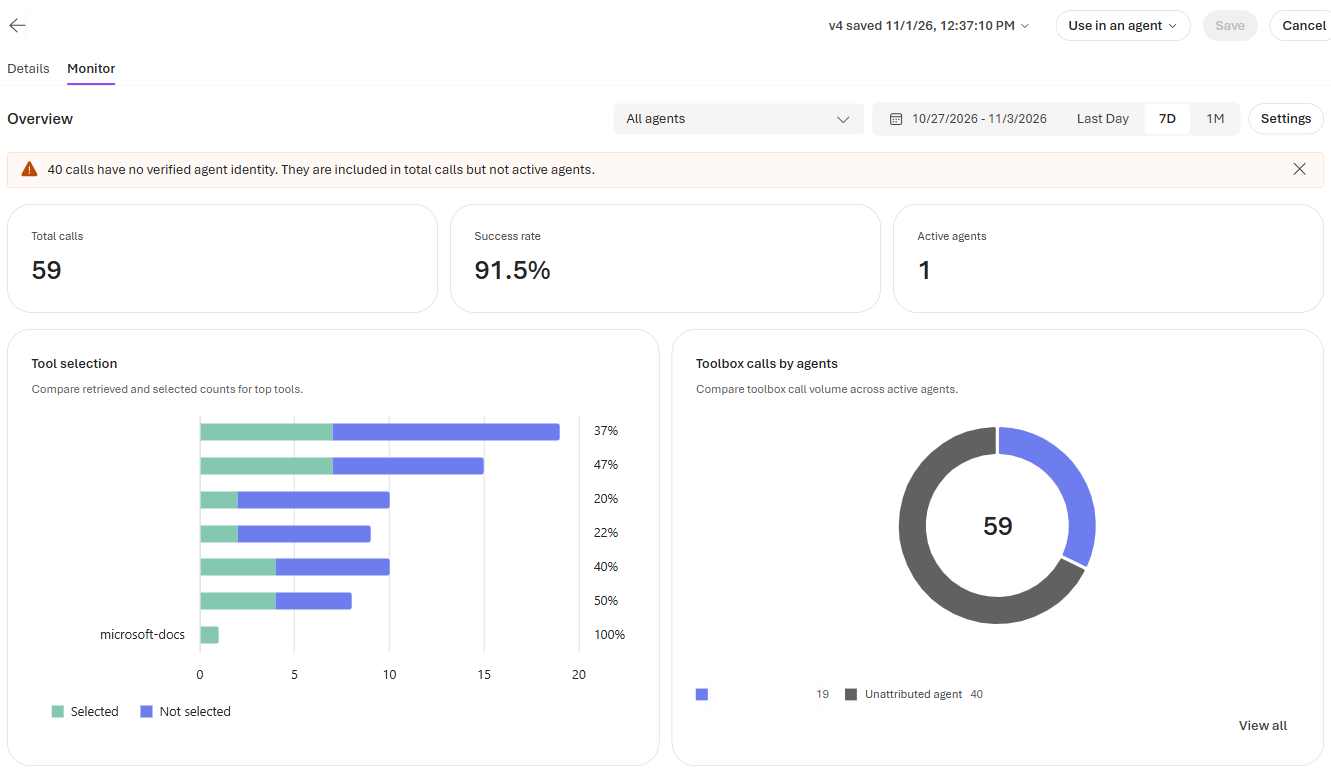
Calls without a verified agent identity appear as Unattributed agent. They're included in Total calls, but not in Active agents. The dashboard displays a message when this applies.
Understand the metrics and charts
Use the following views to understand usage and find potential problems.
| View | What it shows |
|---|---|
| Total calls | The number of recorded toolbox calls in the selected scope. |
| Success rate | The percentage of recorded calls reported as successful. Review traces when you need to confirm an individual tool's result. |
| Active agents | The number of identified agents with activity in the selected scope. Calls without a verified agent identity don't add to this count. |
| Tool selection | Retrieval and selection activity for tools. Use this view with tool search enabled to compare which tools are retrieved and selected. |
| Toolbox calls by agents | Call volume by agent, including unattributed calls. Select View all to inspect the agent list. |
| Skills usage | Invocation counts for skills used through the toolbox. |
| A2A agent usage | Call volume for agents invoked through A2A connections in the toolbox. |
| Errors over time | Recorded toolbox errors over the selected period, across tools, skills, and agents. |
Tool retrieval and tool execution are different events. Use Tool selection to examine selection activity and Consumption breakdown to review recorded calls.
An empty chart means no matching activity is available for that view and the selected filters. For example, a toolbox with tool calls but no A2A calls can show an empty A2A agent usage chart.
Investigate calls and errors
Use Consumption breakdown to identify the tools, skills, or A2A agents associated with activity or failures.
Review Errors over time to find the period you want to investigate, and adjust the date range if needed.
In Consumption breakdown, select All, Tools, Skills, or Agents (A2A).
Compare Name, Type, Total calls, Success rate, and Last active for the listed items.
Use Next and Prev to move through the results.
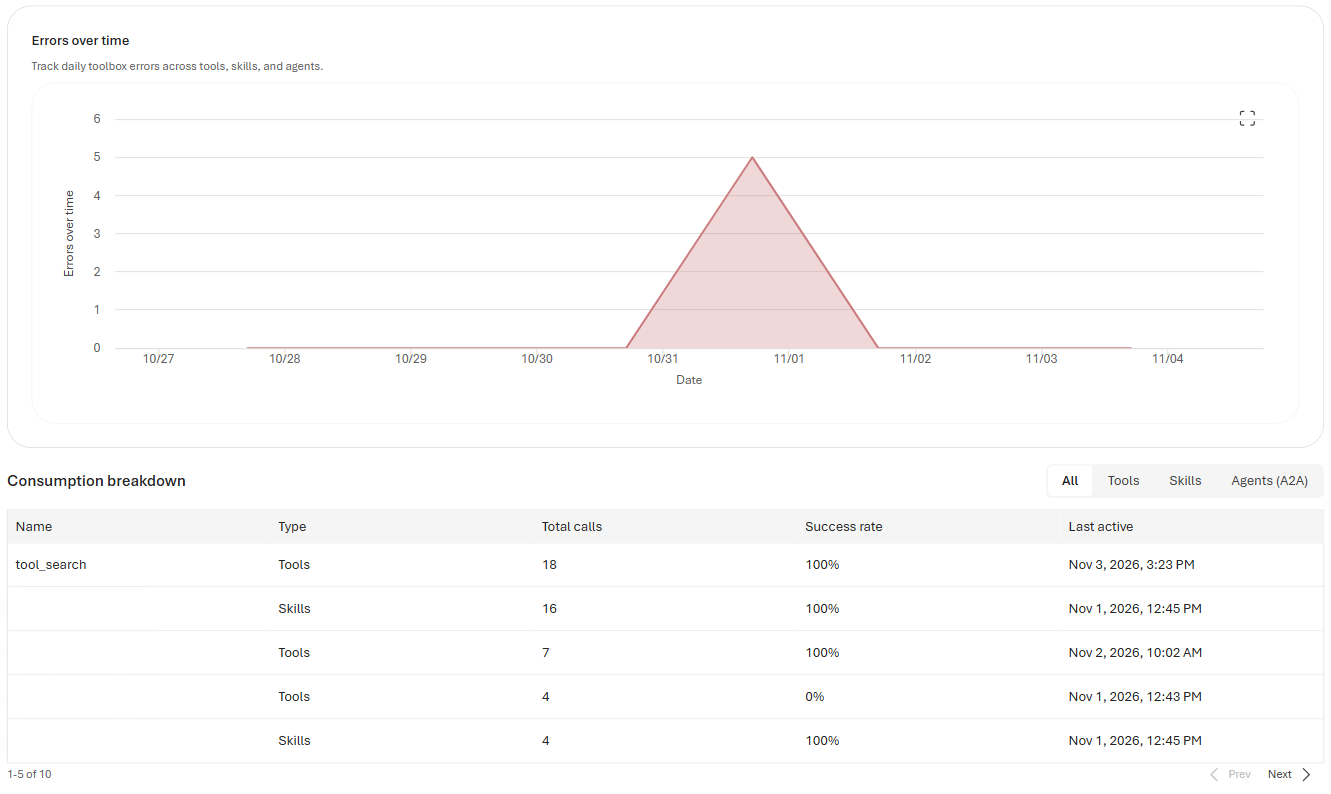
For an item with failed calls, note the name, time range, and calling agent. Then view the agent's traces to inspect the tool arguments, results, and errors.
Troubleshoot missing activity
If the dashboard is empty or doesn't show an expected call, check the following conditions:
- Connection and access: Open Settings, and confirm that the correct Application Insights resource is connected. Verify that you have permission to query its telemetry.
- Toolbox version: Confirm that the agent uses the version selected in Monitor. Save changes to the agent or toolbox before making new calls.
- Filters: Select a date range that includes the call. Clear an agent filter by selecting All agents.
- Actual calls: Confirm that the agent invoked a tool, skill, or A2A agent through the toolbox. Adding an item to a toolbox doesn't create usage data.
- Ingestion delay: Allow time for new activity to appear. Reopen Monitor or reselect the date range.
- Tool search: For retrieval activity in Tool selection, confirm that tool search is enabled and used.
If the problem continues, use the tracing troubleshooting guidance to check telemetry collection and permissions.
Related content
Continue configuring your toolbox or investigating agent activity: