Tutorial: Develop IoT Edge modules using Visual Studio Code
Applies to: ![]() IoT Edge 1.4
IoT Edge 1.4
Important
IoT Edge 1.4 is the supported release. If you are on an earlier release, see Update IoT Edge.
This tutorial walks through developing and deploying your own code to an IoT Edge device. You can use Azure IoT Edge modules to deploy code that implements your business logic directly to your IoT Edge devices. In the Deploy code to a Linux device quickstart, you created an IoT Edge device and deployed a module from the Azure Marketplace.
This article includes steps for two IoT Edge development tools.
- Azure IoT Edge Dev Tool command-line (CLI). This tool is preferred for development.
- Azure IoT Edge tools for Visual Studio Code extension. The extension is in maintenance mode.
Use the tool selector button at the beginning of this article to select the tool version.
In this tutorial, you learn how to:
- Set up your development machine.
- Use the IoT Edge tools to create a new project.
- Build your project as a Docker container and store it in an Azure container registry.
- Deploy your code to an IoT Edge device.
The IoT Edge module that you create in this tutorial filters the temperature data that your device generates. It only sends messages upstream if the temperature is above a specified threshold. This type of analysis at the edge is useful for reducing the amount of data that's communicated to and stored in the cloud.
Prerequisites
A development machine:
- Use your own computer or a virtual machine.
- Your development machine must support nested virtualization for running a container engine.
- Most operating systems that can run a container engine can be used to develop IoT Edge modules for Linux devices. This tutorial uses a Windows computer, but points out known differences on macOS or Linux.
- Install Visual Studio Code
- Install the Azure CLI.
An Azure IoT Edge device:
- You should run IoT Edge on a separate device. This distinction between development machine and IoT Edge device simulates a true deployment scenario and helps keep the different concepts separate. Use the quickstart article Deploy code to a Linux Device to create an IoT Edge device in Azure or the Azure Resource Template to deploy an IoT Edge enabled VM.
Cloud resources:
- A free or standard-tier IoT hub in Azure.
If you don't have an Azure subscription, create an Azure free account before you begin.
Tip
For guidance on interactive debugging in Visual Studio Code or Visual Studio 2022:
- Debug Azure IoT Edge modules using Visual Studio Code
- Use Visual Studio 2022 to develop and debug modules for Azure IoT Edge
This tutorial teaches the development steps for Visual Studio Code.
Key concepts
This tutorial walks through the development of an IoT Edge module. An IoT Edge module is a container with executable code. You can deploy one or more modules to an IoT Edge device. Modules perform specific tasks like ingesting data from sensors, cleaning and analyzing data, or sending messages to an IoT hub. For more information, see Understand Azure IoT Edge modules.
When developing IoT Edge modules, it's important to understand the difference between the development machine and the target IoT Edge device where the module deploys. The container that you build to hold your module code must match the operating system (OS) of the target device. For example, the most common scenario is someone developing a module on a Windows computer intending to target a Linux device running IoT Edge. In that case, the container operating system would be Linux. As you go through this tutorial, keep in mind the difference between the development machine OS and the container OS.
Tip
If you're using IoT Edge for Linux on Windows, then the target device in your scenario is the Linux virtual machine, not the Windows host.
This tutorial targets devices running IoT Edge with Linux containers. You can use your preferred operating system as long as your development machine runs Linux containers. We recommend using Visual Studio Code to develop with Linux containers, so that's what this tutorial uses. You can use Visual Studio as well, although there are differences in support between the two tools.
The following table lists the supported development scenarios for Linux containers in Visual Studio Code and Visual Studio.
| Visual Studio Code | Visual Studio 2019/2022 | |
|---|---|---|
| Linux device architecture | Linux AMD64 Linux ARM32v7 Linux ARM64 |
Linux AMD64 Linux ARM32 Linux ARM64 |
| Azure services | Azure Functions Azure Stream Analytics Azure Machine Learning |
|
| Languages | C C# Java Node.js Python |
C C# |
| More information | Azure IoT Edge for Visual Studio Code | Azure IoT Edge Tools for Visual Studio 2019 Azure IoT Edge Tools for Visual Studio 2022 |
Install container engine
IoT Edge modules are packaged as containers, so you need a Docker compatible container management system on your development machine to build and manage them. We recommend Docker Desktop for development because of its feature support and popularity. Docker Desktop on Windows lets you switch between Linux containers and Windows containers so that you can develop modules for different types of IoT Edge devices.
Use the Docker documentation to install on your development machine:
Install Docker Desktop for Windows
- When you install Docker Desktop for Windows, you're asked whether you want to use Linux or Windows containers. You can change this decision at any time. For this tutorial, we use Linux containers because our modules are targeting Linux devices. For more information, see Switch between Windows and Linux containers.
Read About Docker CE for installation information on several Linux platforms.
- For the Windows Subsystem for Linux (WSL), install Docker Desktop for Windows.
Set up tools
Install the Python-based Azure IoT Edge Dev Tool to create your IoT Edge solution. There are two options:
- Use the prebuilt IoT Edge Dev Container
- Install the tool using the iotedgedev development setup
Important
The Azure IoT Edge tools for Visual Studio Code extension is in maintenance mode. The preferred development tool is the command-line (CLI) Azure IoT Edge Dev Tool.
Use the IoT extensions for Visual Studio Code to develop IoT Edge modules. These extensions offer project templates, automate the creation of the deployment manifest, and allow you to monitor and manage IoT Edge devices. In this section, you install Visual Studio Code and the IoT extension, then set up your Azure account to manage IoT Hub resources from within Visual Studio Code.
Install Azure IoT Edge extension.
Install Azure IoT Hub extension.
After you install extensions, open the command palette by selecting View > Command Palette.
In the command palette again, search for and select Azure IoT Hub: Select IoT Hub. Follow the prompts to select your Azure subscription and IoT Hub.
Open the explorer section of Visual Studio Code by either selecting the icon in the activity bar on the left, or by selecting View > Explorer.
At the bottom of the explorer section, expand the collapsed Azure IoT Hub / Devices menu. You should see the devices and IoT Edge devices associated with the IoT Hub that you selected through the command palette.
Install language specific tools
Install tools specific to the language you're developing in:
Create a container registry
In this tutorial, you use the Azure IoT Edge and Azure IoT Hub extensions to build a module and create a container image from the files. Then you push this image to a registry that stores and manages your images. Finally, you deploy your image from your registry to run on your IoT Edge device.
Important
The Azure IoT Edge Visual Studio Code extension is in maintenance mode.
You can use any Docker-compatible registry to hold your container images. Two popular Docker registry services are Azure Container Registry and Docker Hub. This tutorial uses Azure Container Registry.
If you don't already have a container registry, follow these steps to create a new one in Azure:
In the Azure portal, select Create a resource > Containers > Container Registry.
Provide the following required values to create your container registry:
Field Value Subscription Select a subscription from the drop-down list. Resource group Use the same resource group for all of the test resources that you create during the IoT Edge quickstarts and tutorials. For example, IoTEdgeResources. Registry name Provide a unique name. Location Choose a location close to you. SKU Select Basic. Select Review + create, then Create.
Select your new container registry from the Resources section of your Azure portal home page to open it.
In the left pane of your container registry, select Access keys from the menu located under Settings.
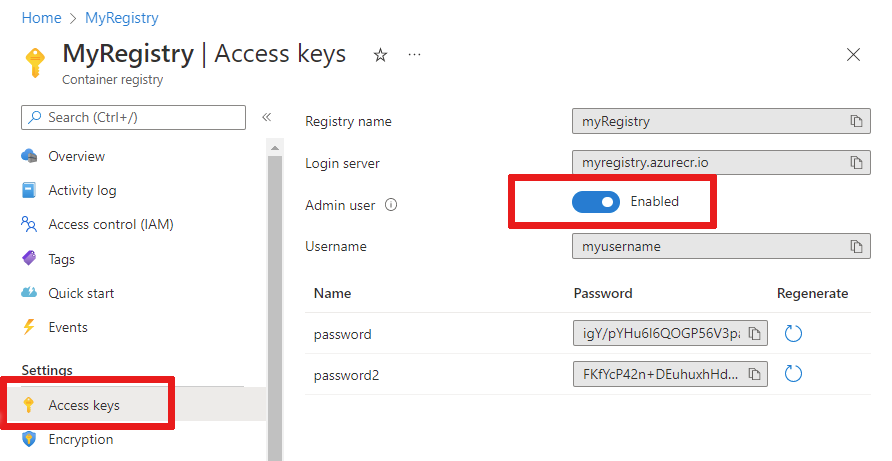
Enable Admin user with the toggle button and view the Username and Password for your container registry.
Copy the values for Login server, Username, and password and save them somewhere convenient. You use these values throughout this tutorial to provide access to the container registry.

Create a new module project
The Azure IoT Edge extension offers project templates for all supported IoT Edge module languages in Visual Studio Code. These templates have all the files and code that you need to deploy a working module to test IoT Edge, or give you a starting point to customize the template with your own business logic.
Create a project template
The IoT Edge Dev Tool simplifies Azure IoT Edge development to commands driven by environment variables. It gets you started with IoT Edge development with the IoT Edge Dev Container and IoT Edge solution scaffolding that has a default module and all the required configuration files.
Create a directory for your solution with the path of your choice. Change into your
iotedgesolutiondirectory.mkdir c:\dev\iotedgesolution cd c:\dev\iotedgesolutionUse the iotedgedev solution init command to create a solution and set up your Azure IoT Hub in the development language of your choice.
The iotedgedev solution init script prompts you to complete several steps including:
- Authenticate to Azure
- Choose an Azure subscription
- Choose or create a resource group
- Choose or create an Azure IoT Hub
- Choose or create an Azure IoT Edge device
Use Visual Studio Code and the Azure IoT Edge extension. You start by creating a solution, and then generating the first module in that solution. Each solution can contain multiple modules.
- Select View > Command Palette.
- In the command palette, enter and run the command Azure IoT Edge: New IoT Edge Solution.
- Browse to the folder where you want to create the new solution and then select Select folder.
- Enter a name for your solution.
- Select a module template for your preferred development language to be the first module in the solution.
- Enter a name for your module. Choose a name that's unique within your container registry.
- Provide the name of the module's image repository. Visual Studio Code autopopulates the module name with localhost:5000/<your module name>. Replace it with your own registry information. Use localhost if you use a local Docker registry for testing. If you use Azure Container Registry, then use Login server from your registry's settings. The sign-in server looks like <registry name>.azurecr.io. Only replace the localhost:5000 part of the string so that the final result looks like <registry name>.azurecr.io/<your module name>.
Visual Studio Code takes the information you provided, creates an IoT Edge solution, and then loads it in a new window.
After solution creation, these main files are in the solution:
A .vscode folder contains configuration file launch.json.
A modules folder that has subfolders for each module. Within the subfolder for each module, the module.json file controls how modules are built and deployed.
An .env file lists your environment variables. The environment variable for the container registry is localhost:5000 by default.
Two module deployment files named deployment.template.json and deployment.debug.template.json list the modules to deploy to your device. By default, the list includes the IoT Edge system modules (edgeAgent and edgeHub) and sample modules such as:
- filtermodule is a sample module that implements a simple filter function.
- SimulatedTemperatureSensor module that simulates data you can use for testing. For more information about how deployment manifests work, see Learn how to use deployment manifests to deploy modules and establish routes. For more information on how the simulated temperature module works, see the SimulatedTemperatureSensor.csproj source code.
Note
The exact modules installed may depend on your language of choice.
Set IoT Edge runtime version
The latest stable IoT Edge system module version is 1.4. Set your system modules to version 1.4.
In Visual Studio Code, open deployment.template.json deployment manifest file. The deployment manifest is a JSON document that describes the modules to be configured on the targeted IoT Edge device.
Change the runtime version for the system runtime module images edgeAgent and edgeHub. For example, if you want to use the IoT Edge runtime version 1.4, change the following lines in the deployment manifest file:
"systemModules": {
    "edgeAgent": {

        "image": "mcr.microsoft.com/azureiotedge-agent:1.4",

    "edgeHub": {

        "image": "mcr.microsoft.com/azureiotedge-hub:1.4",
Provide your registry credentials to the IoT Edge agent
The environment file stores the credentials for your container registry and shares them with the IoT Edge runtime. The runtime needs these credentials to pull your container images onto the IoT Edge device.
The IoT Edge extension tries to pull your container registry credentials from Azure and populate them in the environment file.
Note
The environment file is only created if you provide an image repository for the module. If you accepted the localhost defaults to test and debug locally, then you don't need to declare environment variables.
Check to see if your credentials exist. If not, add them now:
If Azure Container Registry is your registry, set an Azure Container Registry username and password. Get these values from your container registry's Settings > Access keys menu in the Azure portal.
Open the .env file in your module solution.
Add the username and password values that you copied from your Azure container registry. For example:
CONTAINER_REGISTRY_SERVER="myacr.azurecr.io"
CONTAINER_REGISTRY_USERNAME="myacr"
CONTAINER_REGISTRY_PASSWORD="<registry_password>"
Save your changes to the .env file.
Note
This tutorial uses administrator login credentials for Azure Container Registry that are convenient for development and test scenarios. When you're ready for production scenarios, we recommend a least-privilege authentication option like service principals or repository-scoped tokens. For more information, see Manage access to your container registry.
Target architecture
You need to select the architecture you're targeting with each solution, because that affects how the container is built and runs. The default is Linux AMD64. For this tutorial, we're using an Ubuntu virtual machine as the IoT Edge device and keep the default amd64.
If you need to change the target architecture for your solution, use the following steps.
Open the command palette and search for Azure IoT Edge: Set Default Target Platform for Edge Solution, or select the shortcut icon in the side bar at the bottom of the window.
In the command palette, select the target architecture from the list of options.
The target architecture is set when you create the container image in a later step.
Update module with custom code
Each template includes sample code that takes simulated sensor data from the SimulatedTemperatureSensor module and routes it to the IoT hub. The sample module receives messages and then passes them on. The pipeline functionality demonstrates an important concept in IoT Edge, which is how modules communicate with each other.
Each module can have multiple input and output queues declared in their code. The IoT Edge hub running on the device routes messages from the output of one module into the input of one or more modules. The specific code for declaring inputs and outputs varies between languages, but the concept is the same across all modules. For more information about routing between modules, see Declare routes.
The sample C# code that comes with the project template uses the ModuleClient Class from the IoT Hub SDK for .NET.
In the Visual Studio Code explorer, open modules > filtermodule > ModuleBackgroundService.cs.
Before the filtermodule namespace, add three using statements for types that are used later:
using System.Collections.Generic;     // For KeyValuePair<>
using Microsoft.Azure.Devices.Shared; // For TwinCollection
using Newtonsoft.Json;                // For JsonConvert
Add the temperatureThreshold variable to the ModuleBackgroundService class. This variable sets the value that the measured temperature must exceed for the data to be sent to the IoT hub.
static int temperatureThreshold { get; set; } = 25;Add the MessageBody, Machine, and Ambient classes. These classes define the expected schema for the body of incoming messages.
class MessageBody
{
    public Machine machine {get;set;}
    public Ambient ambient {get; set;}
    public string timeCreated {get; set;}
}
class Machine
{
    public double temperature {get; set;}
    public double pressure {get; set;}
}
class Ambient
{
    public double temperature {get; set;}
    public int humidity {get; set;}
}
Find the ExecuteAsync function. This function creates and configures a ModuleClient object that allows the module to connect to the local Azure IoT Edge runtime to send and receive messages. After creating the ModuleClient, the code reads the temperatureThreshold value from the module twin's desired properties. The code registers a callback to receive messages from an IoT Edge hub via an endpoint called input1.
Replace the call to the ProcessMessageAsync method with a new one that updates the name of the endpoint and the method that's called when input arrives. Also, add a SetDesiredPropertyUpdateCallbackAsync method for updates to the desired properties. To make this change, replace the last line of the ExecuteAsync method with the following code:
// Register a callback for messages that are received by the module.
// await _moduleClient.SetInputMessageHandlerAsync("input1", PipeMessage, cancellationToken);

// Read the TemperatureThreshold value from the module twin's desired properties
var moduleTwin = await _moduleClient.GetTwinAsync();
await OnDesiredPropertiesUpdate(moduleTwin.Properties.Desired, _moduleClient);

// Attach a callback for updates to the module twin's desired properties.
await _moduleClient.SetDesiredPropertyUpdateCallbackAsync(OnDesiredPropertiesUpdate, null);

// Register a callback for messages that are received by the module. Messages received on the inputFromSensor endpoint are sent to the FilterMessages method.
await _moduleClient.SetInputMessageHandlerAsync("inputFromSensor", FilterMessages, _moduleClient);
Add the onDesiredPropertiesUpdate method to the ModuleBackgroundService class. This method receives updates on the desired properties from the module twin, and updates the temperatureThreshold variable to match. All modules have their own module twin, which lets you configure the code that's running inside a module directly from the cloud.
static Task OnDesiredPropertiesUpdate(TwinCollection desiredProperties, object userContext)
{
    try
    {
        Console.WriteLine("Desired property change:");
        Console.WriteLine(JsonConvert.SerializeObject(desiredProperties));

        if (desiredProperties["TemperatureThreshold"]!=null)
            temperatureThreshold = desiredProperties["TemperatureThreshold"];

    }
    catch (AggregateException ex)
    {
        foreach (Exception exception in ex.InnerExceptions)
        {
            Console.WriteLine();
            Console.WriteLine("Error when receiving desired property: {0}", exception);
        }
    }
    catch (Exception ex)
    {
        Console.WriteLine();
        Console.WriteLine("Error when receiving desired property: {0}", ex.Message);
    }
    return Task.CompletedTask;
}
Add the FilterMessages method. This method is called whenever the module receives a message from the IoT Edge hub. It filters out messages that report temperatures below the temperature threshold set via the module twin. It also adds the MessageType property to the message with the value set to Alert.
async Task<MessageResponse> FilterMessages(Message message, object userContext)
{
    var counterValue = Interlocked.Increment(ref _counter);
    try
    {
        ModuleClient moduleClient = (ModuleClient)userContext;
        var messageBytes = message.GetBytes();
        var messageString = Encoding.UTF8.GetString(messageBytes);
        Console.WriteLine($"Received message {counterValue}: [{messageString}]");

        // Get the message body.
        var messageBody = JsonConvert.DeserializeObject<MessageBody>(messageString);

        if (messageBody != null && messageBody.machine.temperature > temperatureThreshold)
        {
            Console.WriteLine($"Machine temperature {messageBody.machine.temperature} " +
                $"exceeds threshold {temperatureThreshold}");
            using (var filteredMessage = new Message(messageBytes))
            {
                foreach (KeyValuePair<string, string> prop in message.Properties)
                {
                    filteredMessage.Properties.Add(prop.Key, prop.Value);
                }

                filteredMessage.Properties.Add("MessageType", "Alert");
                await moduleClient.SendEventAsync("output1", filteredMessage);
            }
        }

        // Indicate that the message treatment is completed.
        return MessageResponse.Completed;
    }
    catch (AggregateException ex)
    {
        foreach (Exception exception in ex.InnerExceptions)
        {
            Console.WriteLine();
            Console.WriteLine("Error in sample: {0}", exception);
        }
        // Indicate that the message treatment is not completed.
        var moduleClient = (ModuleClient)userContext;
        return MessageResponse.Abandoned;
    }
    catch (Exception ex)
    {
        Console.WriteLine();
        Console.WriteLine("Error in sample: {0}", ex.Message);
        // Indicate that the message treatment is not completed.
        ModuleClient moduleClient = (ModuleClient)userContext;
        return MessageResponse.Abandoned;
    }
}
Save the ModuleBackgroundService.cs file.
In the Visual Studio Code explorer, open the deployment.template.json file in your IoT Edge solution workspace.
Since we changed the name of the endpoint that the module listens on, we also need to update the routes in the deployment manifest so that the edgeHub sends messages to the new endpoint.
Find the routes section in the $edgeHub module twin. Update the sensorTofiltermodule route to replace
input1withinputFromSensor:"sensorTofiltermodule": "FROM /messages/modules/tempSensor/outputs/temperatureOutput INTO BrokeredEndpoint(\"/modules/filtermodule/inputs/inputFromSensor\")"Add the filtermodule module twin to the deployment manifest. Insert the following JSON content at the bottom of the modulesContent section, after the $edgeHub module twin:
   "filtermodule": {
       "properties.desired":{
           "TemperatureThreshold":25
       }
   }
Save the deployment.template.json file.
Build and push your solution
You updated the module code and the deployment template to help understand some key deployment concepts. Now, you're ready to build your module container image and push it to your container registry.
In Visual Studio Code, open the deployment.template.json deployment manifest file. The deployment manifest describes the modules to be configured on the targeted IoT Edge device. Before deployment, you need to update your Azure Container Registry credentials and your module images with the proper createOptions values. For more information about createOption values, see How to configure container create options for IoT Edge modules.
If you're using an Azure Container Registry to store your module image, add your credentials to the modulesContent > edgeAgent > settings > registryCredentials section in deployment.template.json. Replace myacr with your own registry name and provide your password and Login server address. For example:
"registryCredentials": {
    "myacr": {
        "username": "myacr",
        "password": "<your_acr_password>",
        "address": "myacr.azurecr.io"
    }
}
Add or replace the following stringified content to the createOptions value for each system (edgeHub and edgeAgent) and custom module (filtermodule and tempSensor) listed. Change the values if necessary.
"createOptions": "{\"HostConfig\":{\"PortBindings\":{\"5671/tcp\":[{\"HostPort\":\"5671\"}],\"8883/tcp\":[{\"HostPort\":\"8883\"}],\"443/tcp\":[{\"HostPort\":\"443\"}]}}}"
For example, the filtermodule configuration should be similar to:
"filtermodule": {
"version": "1.0",
"type": "docker",
"status": "running",
"restartPolicy": "always",
"settings": {
   "image": "myacr.azurecr.io/filtermodule:0.0.1-amd64",
   "createOptions": "{\"HostConfig\":{\"PortBindings\":{\"5671/tcp\":[{\"HostPort\":\"5671\"}],\"8883/tcp\":[{\"HostPort\":\"8883\"}],\"443/tcp\":[{\"HostPort\":\"443\"}]}}}"
}
Build module Docker image
Open the Visual Studio Code integrated terminal by selecting Terminal > New Terminal.
Use the dotnet publish command to build the container image for Linux and amd64 architecture. Change directory to the filtermodule directory in your project and run the dotnet publish command.
dotnet publish --os linux --arch x64 /t:PublishContainer
Currently, the iotedgedev tool template targets .NET 7.0. If you want to target a different version of .NET, you can edit the filtermodule.csproj file and change the TargetFramework and PackageReference values. For example to target .NET 8.0, your filtermodule.csproj file should look like this:
<Project Sdk="Microsoft.NET.Sdk.Worker">
    <PropertyGroup>
        <TargetFramework>net8.0</TargetFramework>
        <Nullable>enable</Nullable>
        <ImplicitUsings>enable</ImplicitUsings>
    </PropertyGroup>
    <ItemGroup>
        <PackageReference Include="Microsoft.Azure.Devices.Client" Version="1.42.0" />
        <PackageReference Include="Microsoft.Extensions.Hosting" Version="8.0.0" />
    </ItemGroup>
</Project>
Tag the docker image with your container registry information, version, and architecture. Replace myacr with your own registry name.
docker tag filtermodule myacr.azurecr.io/filtermodule:0.0.1-amd64
Push module Docker image
Provide your container registry credentials to Docker so that it can push your container image to storage in the registry.
Sign in to Docker with the Azure Container Registry (ACR) credentials.
docker login -u <ACR username> -p <ACR password> <ACR login server>You might receive a security warning recommending the use of
--password-stdin. While that's a recommended best practice for production scenarios, it's outside the scope of this tutorial. For more information, see the docker login reference.Sign in to the Azure Container Registry. You need to Install Azure CLI to use the
azcommand. This command asks for your user name and password found in your container registry in Settings > Access keys.az acr login -n <ACR registry name>Tip
If you get logged out at any point in this tutorial, repeat the Docker and Azure Container Registry sign in steps to continue.
Push your module image to the local registry or a container registry.
docker push <ImageName>For example:
# Push the Docker image to the local registry

docker push localhost:5000/filtermodule:0.0.1-amd64

# Or push the Docker image to an Azure Container Registry. Replace myacr with your Azure Container Registry name.

az acr login --name myacr
docker push myacr.azurecr.io/filtermodule:0.0.1-amd64
Update the deployment template
Update the deployment template deployment.template.json with the container registry image location. For example, if you're using an Azure Container Registry myacr.azurecr.io and your image is filtermodule:0.0.1-amd64, update the filtermodule configuration to:
"filtermodule": {
    "version": "1.0",
    "type": "docker",
    "status": "running",
    "restartPolicy": "always",
    "settings": {
        "image": "myacr.azurecr.io/filtermodule:0.0.1-amd64",
        "createOptions": "{\"HostConfig\":{\"PortBindings\":{\"5671/tcp\":[{\"HostPort\":\"5671\"}],\"8883/tcp\":[{\"HostPort\":\"8883\"}],\"443/tcp\":[{\"HostPort\":\"443\"}]}}}"
    }
}
In the Visual Studio Code explorer, right-click the deployment.template.json file and select Build and Push IoT Edge Solution.
The build and push command starts three operations. First, it creates a new folder in the solution called config that holds the full deployment manifest, built out of information in the deployment template and other solution files. Second, it runs docker build to build the container image based on the appropriate dockerfile for your target architecture. Then, it runs docker push to push the image repository to your container registry.
This process may take several minutes the first time, but is faster the next time that you run the commands.
Optional: Update the module and image
If you make changes to your module code, you need to rebuild and push the module image to your container registry. Use the steps in this section to update the build and container image. You can skip this section if you didn't make any changes to your module code.
Open the deployment.amd64.json file in newly created config folder. The filename reflects the target architecture, so it's different if you chose a different architecture.
Notice that the two parameters that had placeholders now contain their proper values. The registryCredentials section has your registry username and password pulled from the .env file. The filtermodule has the full image repository with the name, version, and architecture tag from the module.json file.
Open the module.json file in the filtermodule folder.
Change the version number for the module image. For example, increment the patch version number to
"version": "0.0.2"as if you made a small fix in the module code.Tip
Module versions enable version control, and allow you to test changes on a small set of devices before deploying updates to production. If you don't increment the module version before building and pushing, then you overwrite the repository in your container registry.
Save your changes to the module.json file.
Build and push the updated image with a 0.0.2 version tag. For example, to build and push the image for the local registry or an Azure container registry, use the following commands:
# Build the container image for Linux and amd64 architecture.

dotnet publish --os linux --arch x64

# For local registry:
# Tag the image with version 0.0.2, x64 architecture, and the local registry.

docker tag filtermodule localhost:5000/filtermodule:0.0.2-amd64

# For Azure Container Registry:
# Tag the image with version 0.0.2, x64 architecture, and your container registry information. Replace **myacr** with your own registry name.

docker tag filtermodule myacr.azurecr.io/filtermodule:0.0.2-amd64
Right-click the deployment.template.json file again, and again select Build and Push IoT Edge Solution.
Open the deployment.amd64.json file again. Notice the build system doesn't create a new file when you run the build and push command again. Rather, the same file updates to reflect the changes. The filtermodule image now points to the 0.0.2 version of the container.
To further verify what the build and push command did, go to the Azure portal and navigate to your container registry.
In your container registry, select Repositories then filtermodule. Verify that both versions of the image push to the registry.

Troubleshoot
If you encounter errors when building and pushing your module image, it often has to do with Docker configuration on your development machine. Use the following checks to review your configuration:
- Did you run the
docker logincommand using the credentials that you copied from your container registry? These credentials are different than the ones that you use to sign in to Azure. - Is your container repository correct? Does it have your correct container registry name and your correct module name? Open the module.json file in the filtermodule folder to check. The repository value should look like <registry name>.azurecr.io/filtermodule.
- If you used a different name than filtermodule for your module, is that name consistent throughout the solution?
- Is your machine running the same type of containers that you're building? This tutorial is for Linux IoT Edge devices, so Visual Studio Code should say amd64 or arm32v7 in the side bar, and Docker Desktop should be running Linux containers.
Deploy modules to device
You verified that there are built container images stored in your container registry, so it's time to deploy them to a device. Make sure that your IoT Edge device is up and running.
Use the IoT Edge Azure CLI set-modules command to deploy the modules to the Azure IoT Hub. For example, to deploy the modules defined in the deployment.template.json file to IoT Hub my-iot-hub for the IoT Edge device my-device, use the following command. Replace the values for hub-name, device-id, and login IoT Hub connection string with your own.
az iot edge set-modules --hub-name my-iot-hub --device-id my-device --content ./deployment.template.json --login "HostName=my-iot-hub.azure-devices.net;SharedAccessKeyName=iothubowner;SharedAccessKey=<SharedAccessKey>"
Tip
You can find your IoT Hub connection string including the shared access key in the Azure portal. Go to your IoT Hub > Security settings > Shared access policies > iothubowner.
In the Visual Studio Code explorer, under the Azure IoT Hub section, expand Devices to see your list of IoT devices.
Right-click the IoT Edge device that you want to deploy to, then select Create Deployment for Single Device.
In the file explorer, navigate into the config folder then select the deployment.amd64.json file.
Don't use the deployment.template.json file, which doesn't have the container registry credentials or module image values in it. If you target a Linux ARM32 device, the deployment manifest's name is deployment.arm32v7.json.
Under your device, expand Modules to see a list of deployed and running modules. Select the refresh button. You should see the new tempSensor and filtermodule modules running on your device.
It might take a few minutes for the modules to start. The IoT Edge runtime needs to receive its new deployment manifest, pull down the module images from the container runtime, then start each new module.
View messages from device
The sample module code receives messages through its input queue and passes them along through its output queue. The deployment manifest declared routes that passed messages to filtermodule from tempSensor, and then forwarded messages from filtermodule to IoT Hub. The Azure IoT Edge and Azure IoT Hub extensions allow you to see messages as they arrive at IoT Hub from your individual devices.
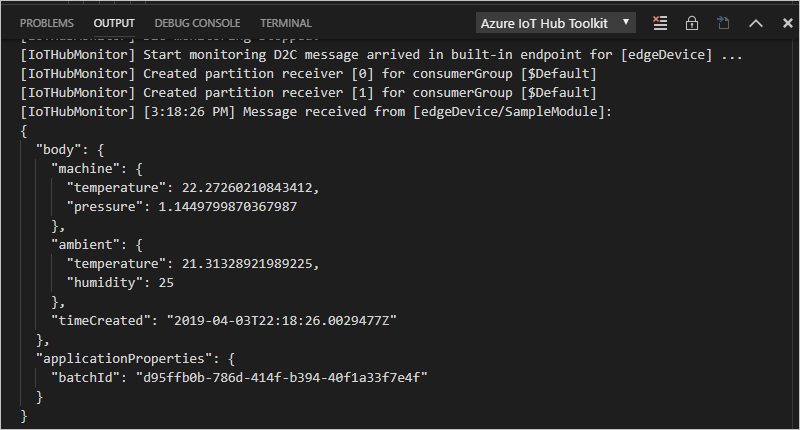
In the Visual Studio Code explorer, right-click the IoT Edge device that you want to monitor, then select Start Monitoring Built-in Event Endpoint.
Watch the output window in Visual Studio Code to see messages arriving at your IoT hub.
View changes on device
If you want to see what's happening on your device itself, use the commands in this section to inspect the IoT Edge runtime and modules running on your device.
The commands in this section are for your IoT Edge device, not your development machine. If you're using a virtual machine for your IoT Edge device, connect to it now. In Azure, go to the virtual machine's overview page and select Connect to access the secure shell connection.
View all modules deployed to your device, and check their status:
iotedge listYou should see four modules: the two IoT Edge runtime modules, tempSensor, and filtermodule. You should see all four listed as running.
Inspect the logs for a specific module:
iotedge logs <module name>IoT Edge modules are case-sensitive.
The tempSensor and filtermodule logs should show the messages they're processing. The edgeAgent module is responsible for starting the other modules, so its logs have information about implementing the deployment manifest. If you find a module is unlisted or not running, the edgeAgent logs likely have the errors. The edgeHub module is responsible for communications between the modules and IoT Hub. If the modules are up and running, but the messages aren't arriving at your IoT hub, the edgeHub logs likely have the errors.
Clean up resources
If you plan to continue to the next recommended article, you can keep the resources and configurations that you created and reuse them. You can also keep using the same IoT Edge device as a test device.
Otherwise, you can delete the local configurations and the Azure resources that you used in this article to avoid charges.
Delete Azure resources
Deleting Azure resources and resource groups is irreversible. Make sure that you don't accidentally delete the wrong resource group or resources. If you created the IoT hub inside an existing resource group that has resources that you want to keep, delete only the IoT hub resource itself, not the resource group.
To delete the resources:
Sign in to the Azure portal, and then select Resource groups.
Select the name of the resource group that contains your IoT Edge test resources.
Review the list of resources that are contained in your resource group. If you want to delete all of them, you can select Delete resource group. If you want to delete only some of them, you can click into each resource to delete them individually.
Next steps
In this tutorial, you set up Visual Studio Code on your development machine and deployed your first IoT Edge module that contains code to filter raw data generated by your IoT Edge device.
You can continue on to the next tutorials to learn how Azure IoT Edge can help you deploy Azure cloud services to process and analyze data at the edge.
Feedback
Coming soon: Throughout 2024 we will be phasing out GitHub Issues as the feedback mechanism for content and replacing it with a new feedback system. For more information see: https://aka.ms/ContentUserFeedback.
Submit and view feedback for