How to manage data sources in Azure Managed Grafana
In this guide, you learn about data sources supported in each Azure Managed Grafana plan and learn how to add, manage and remove these data sources.
Prerequisites
- An Azure Managed Grafana workspace.
- Required Grafana role: Grafana Editor.
Supported Grafana data sources
By design, Grafana can be configured with multiple data sources. A data source is an externalized storage backend that holds telemetry information.
Grafana built-in core data sources
Azure Managed Grafana supports many popular data sources. The table below lists the Grafana core data sources that can be added to Azure Managed Grafana for each service tier.
| Data sources | Essential (preview) | Standard |
|---|---|---|
| Alertmanager | - | ✔ |
| AWS CloudWatch | - | ✔ |
| Azure Data Explorer | - | ✔ |
| Azure Monitor | ✔ | ✔ |
| Elasticsearch | - | ✔ |
| GitHub | - | ✔ |
| Google Cloud Monitoring | - | ✔ |
| Graphite | - | ✔ |
| InfluxDB | - | ✔ |
| Jaeger | - | ✔ |
| JSON API | - | ✔ |
| Loki | - | ✔ |
| Microsoft SQL Server | - | ✔ |
| MySQL | - | ✔ |
| OpenTSDB | - | ✔ |
| PostgreSQL | - | ✔ |
| Prometheus | ✔ | ✔ |
| Tempo | - | ✔ |
| TestData | ✔ | ✔ |
| Zipkin | - | ✔ |
Grafana Enterprise data sources
Within the Standard service tier, users who have subscribed to the Grafana Enterprise option can also access the following data sources.
- AppDynamics
- Azure Devops
- Databricks
- DataDog
- Dynatrace
- GitLab
- Honeycomb
- Jira
- Looker
- MongoDB
- New Relic
- Oracle Database
- Salesforce
- SAP HANA®
- ServiceNow
- Snowflake
- Splunk
- Splunk Infrastructure monitoring (SignalFx)
- Sqlyze Datasource
- Sumo Logic
- Wavefront
Other data sources
Customers with a Standard tier plan can access additional data sources from the Plugin management (preview) feature.
For more information about data sources, go to Data sources on the Grafana Labs website.
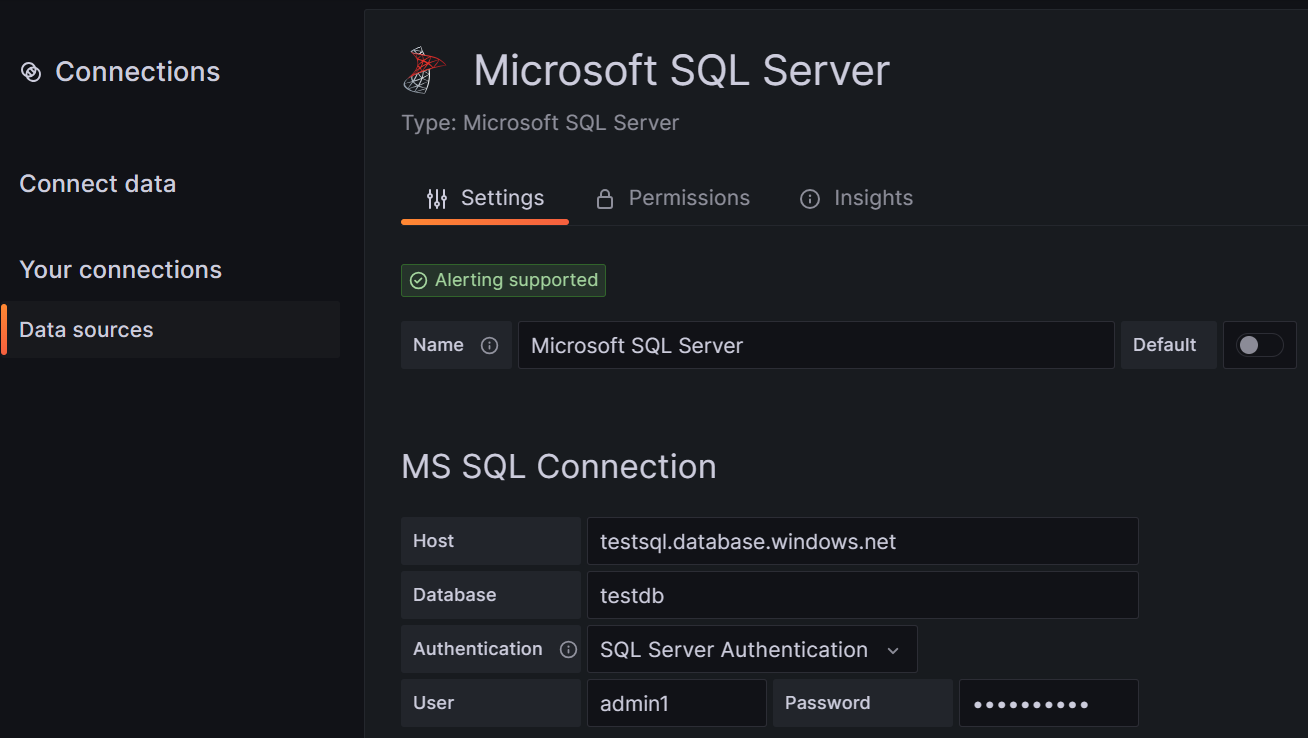
Add a data source
To add a data source to Azure Managed Grafana, follow the steps below.
Core Grafana plugins are installed in your workspace by default. If you want to use another type of data source, you first need to install its plugin. To install a new data source plugin, follow the instructions available at Add a plugin.
Add the data source to your instance.
- Open your Azure Managed Grafana workspace in the Azure portal and go to Overview > Endpoint to open the Grafana UI.
- In the Grafana portal, deploy the menu on the left and select Connections > Data sources > Add new data source.
- Select a data source from the list. The data source is added to your instance.
- Fill out the required fields and select Save & test to update the data source configuration and make sure it works.
Tip
If you can't connect to a data source, you may need to modify access permissions to allow access from your Azure Managed Grafana instance.
Configure a data source
The content below shows how to configure some of the most popular data sources in Azure Managed Grafana: Azure Monitor and Azure Data Explorer. A similar process can be used to configure other types of data sources. For more information about a specific data source, refer to Grafana's documentation.
Azure Monitor
The Azure Monitor data source is automatically added to all new Managed Grafana resources. To review or modify its configuration, follow the steps below in the Grafana portal of your Azure Managed Grafana instance or in the Azure CLI.
Deploy the menu on the left and select Connections > Data sources.
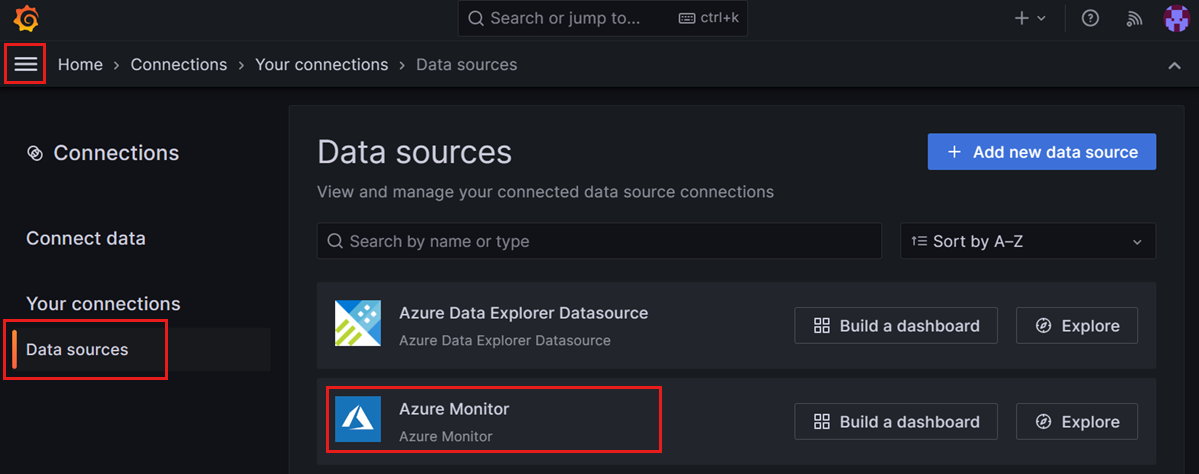
Azure Monitor is listed as a built-in data source for your Managed Grafana instance. Select Azure Monitor.
In the Settings tab, authenticate through Managed Identity and select your subscription from the dropdown list or enter your App Registration details
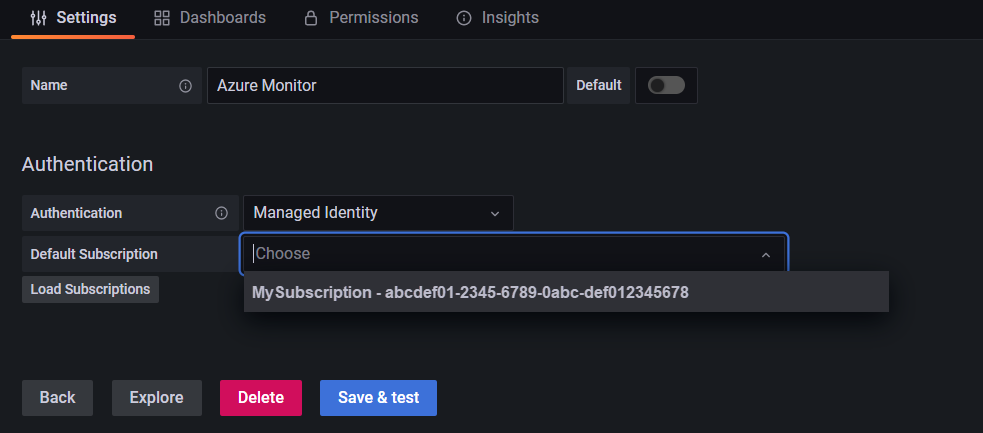
Authentication and authorization are made through the provided managed identity. Using managed identity, lets you assign permissions for your Managed Grafana instance to access Azure Monitor data without having to manually manage service principals in Microsoft Entra ID.
Note
User-assigned managed identity isn't currently supported.
Azure Data Explorer
To learn how to configure Azure Data Explorer, go to Configure Azure Data Explorer.
Remove a data source
This section describes the steps for removing a data source.
Caution
Removing a data source that is used in a dashboard will make the dashboard unable to collect the corresponding data and will trigger an error or result in no data being shown in the panel.
Remove a data source in the Azure portal:
- Open your Azure Managed Grafana instance in the Azure portal.
- Select Overview from the left menu, then open the Endpoint URL.
- In the Grafana portal, go to Connections > Your connections
- Select the data source you want to remove and select Delete.
Next steps
Feedback
Coming soon: Throughout 2024 we will be phasing out GitHub Issues as the feedback mechanism for content and replacing it with a new feedback system. For more information see: https://aka.ms/ContentUserFeedback.
Submit and view feedback for