Note
Access to this page requires authorization. You can try signing in or changing directories.
Access to this page requires authorization. You can try changing directories.
Query Performance Insight proposes to provide intelligent query analysis for databases. The most preferred insights are the workload patterns and the longer-running queries. Understanding these insights can help you find which queries to optimize to improve overall performance and to use your available resources efficiently.
Query Performance Insight is designed to help you spend less time troubleshooting database performance by providing such information as:
- Top N long-running queries and their trends.
- The query details: view the history of execution with minimum, maximum, average, and standard deviation query time.
- The resource utilizations (CPU, memory, and storage).
This article discusses how to use Azure Database for MySQL Flexible Server slow query logs, the Log Analytics tool, and workbooks templates to visualize Query Performance Insight for Azure Database for MySQL Flexible Server.
In this tutorial, you learn how to:
- Configure slow query logs by using the Azure portal or the Azure CLI
- Set up diagnostics
- View slow query logs by using Log Analytics
- View slow query logs by using workbooks
Prerequisites
- Quickstart: Create an instance of Azure Database for MySQL with the Azure portal
- Create a Log Analytics workspace
Configure slow query logs by using the Azure portal
Sign in to the Azure portal.
Select your Azure Database for MySQL Flexible Server instance.
On the left pane, under Settings, select Server parameters.
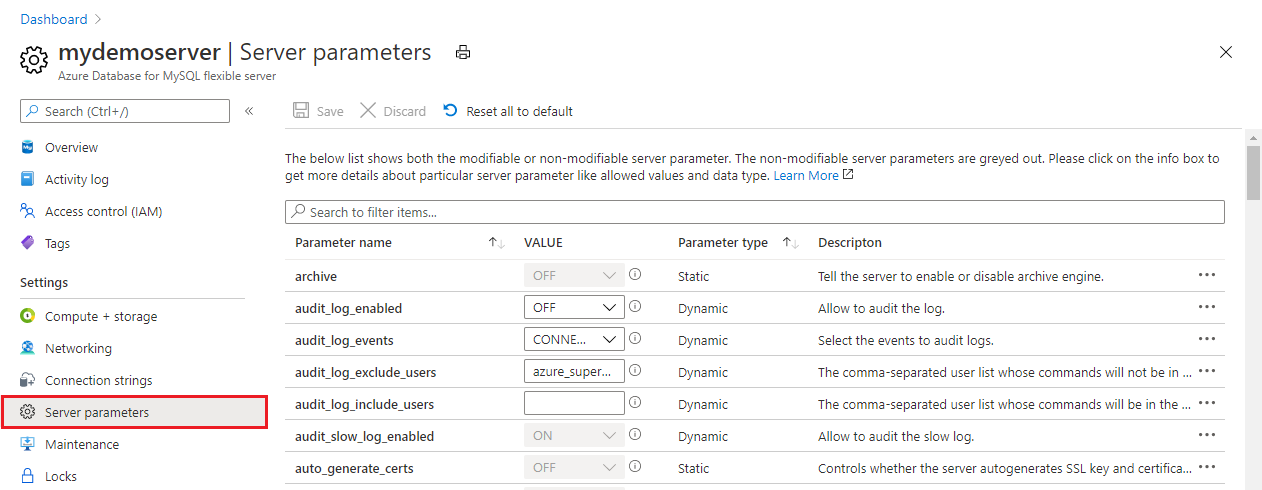
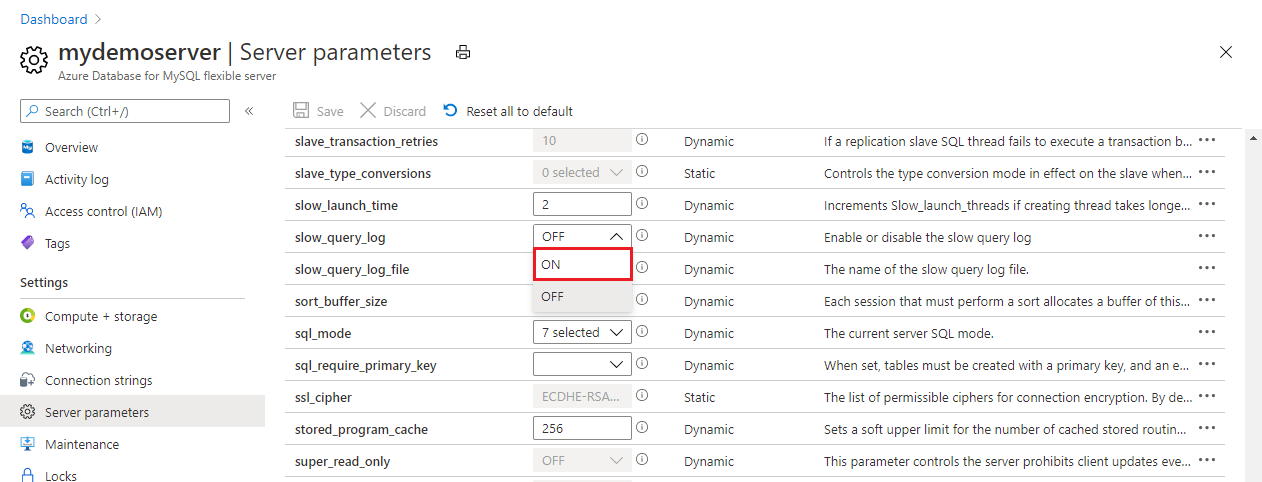
For the slow_query_log parameter, select ON.
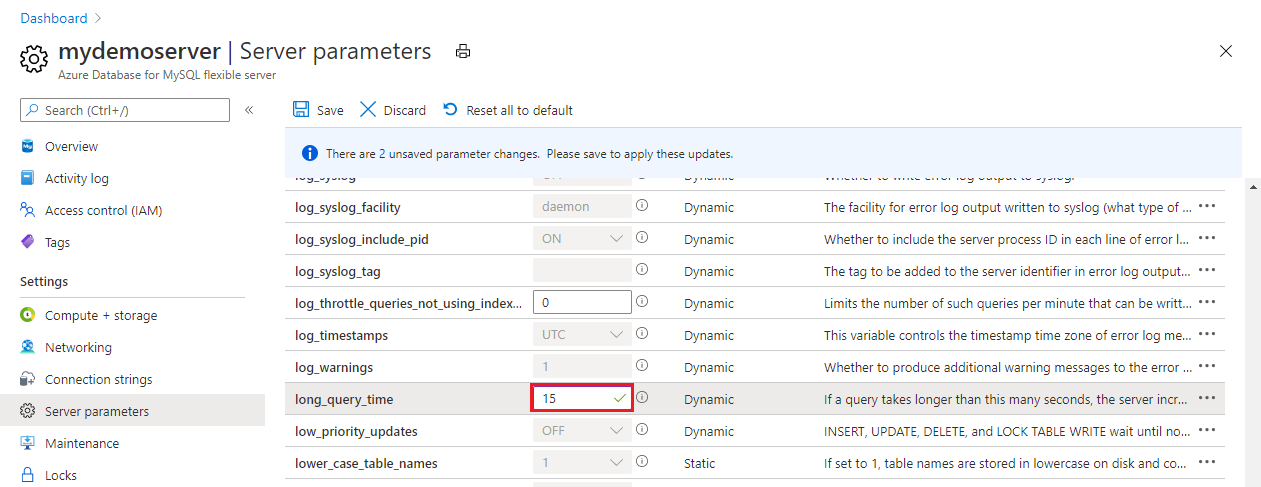
For the other parameters, such as long_query_time and log_slow_admin_statements, refer to the slow query logs documentation.
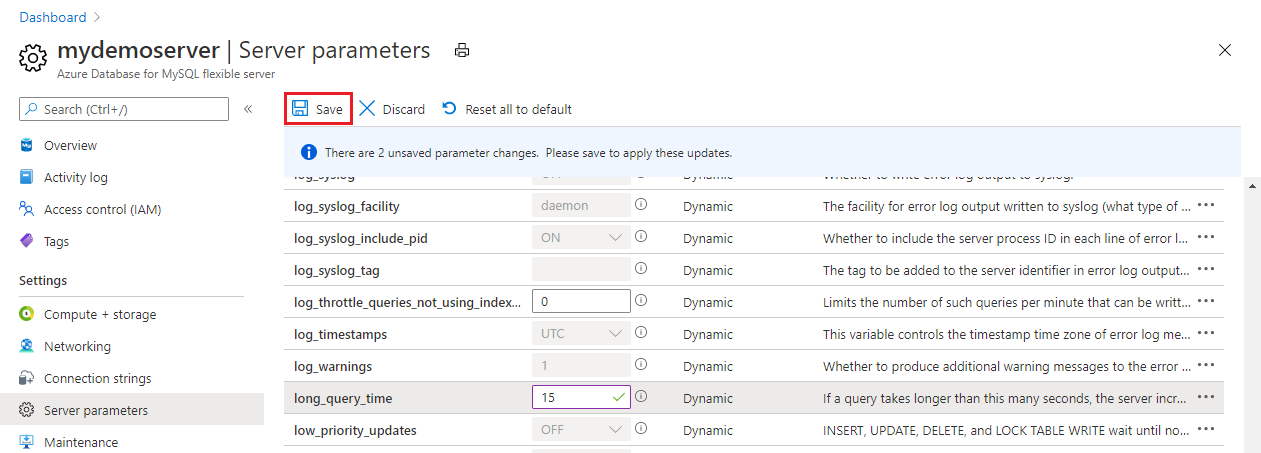
Select Save.
You can return to the list of logs by closing the Server parameters page.


Configure slow query logs by using the Azure CLI
Alternatively, you can enable and configure slow query logs for your Azure Database for MySQL Flexible Server instance from the Azure CLI by running the following command:
Important
To ensure that your Azure Database for MySQL Flexible Server instance's performance isn't heavily affected, we recommend that you log only the event types and users that are required for your auditing purposes.
- Enable slow query logs.
az mysql flexible-server parameter set \
--name slow_query_log \
--resource-group myresourcegroup \
--server-name mydemoserver \
--value ON
- Set long_query_time time to 10 seconds. This setting logs all queries that execute for more than 10 seconds. Adjust this threshold based on your definition for slow queries.
az mysql server configuration set \
--name long_query_time \
--resource-group myresourcegroup \
--server mydemoserver \
--value 10
Set up diagnostics
Slow query logs are integrated with Azure Monitor diagnostic settings to allow you to pipe your logs to any of three data sinks:
- A Log Analytics workspace
- An event hub
- A storage account
Note
You should create your data sinks before you configure the diagnostics settings. You can access the slow query logs in the data sinks you've configured. It can take up to 10 minutes for the logs to appear.
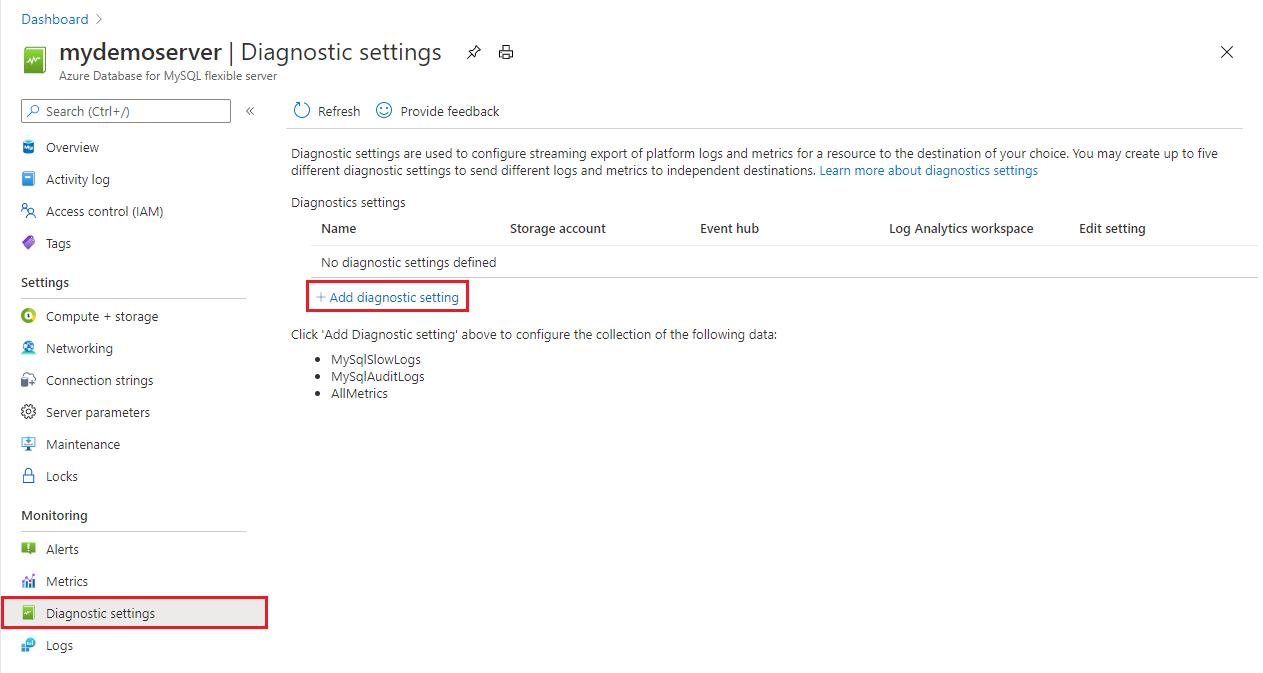
On the left pane, under Monitoring, select Diagnostic settings.
On the Diagnostics settings pane, select Add diagnostic setting.
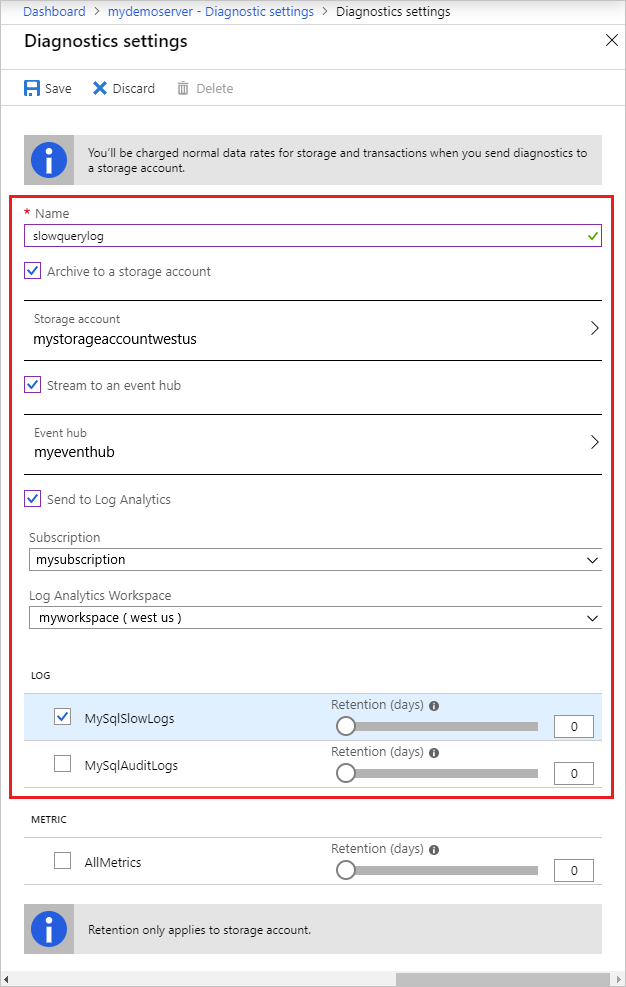
In the Name box, enter a name for the diagnostics setting.
Specify which destinations (Log Analytics workspace, an event hub, or a storage account) to send the slow query logs to by selecting their corresponding checkboxes.
Note
For this tutorial, you send the slow query logs to a Log Analytics workspace.
Under Log, for the log type, select the MySqlSlowLogs checkbox.
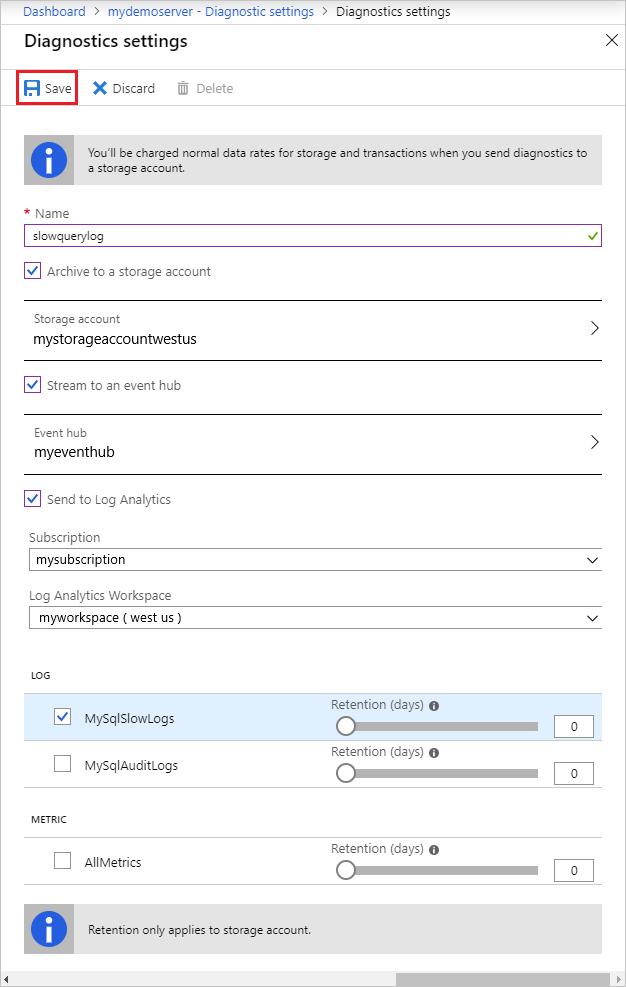
After you've configured the data sinks to pipe the slow query logs to, select Save.

View query insights by using Log Analytics
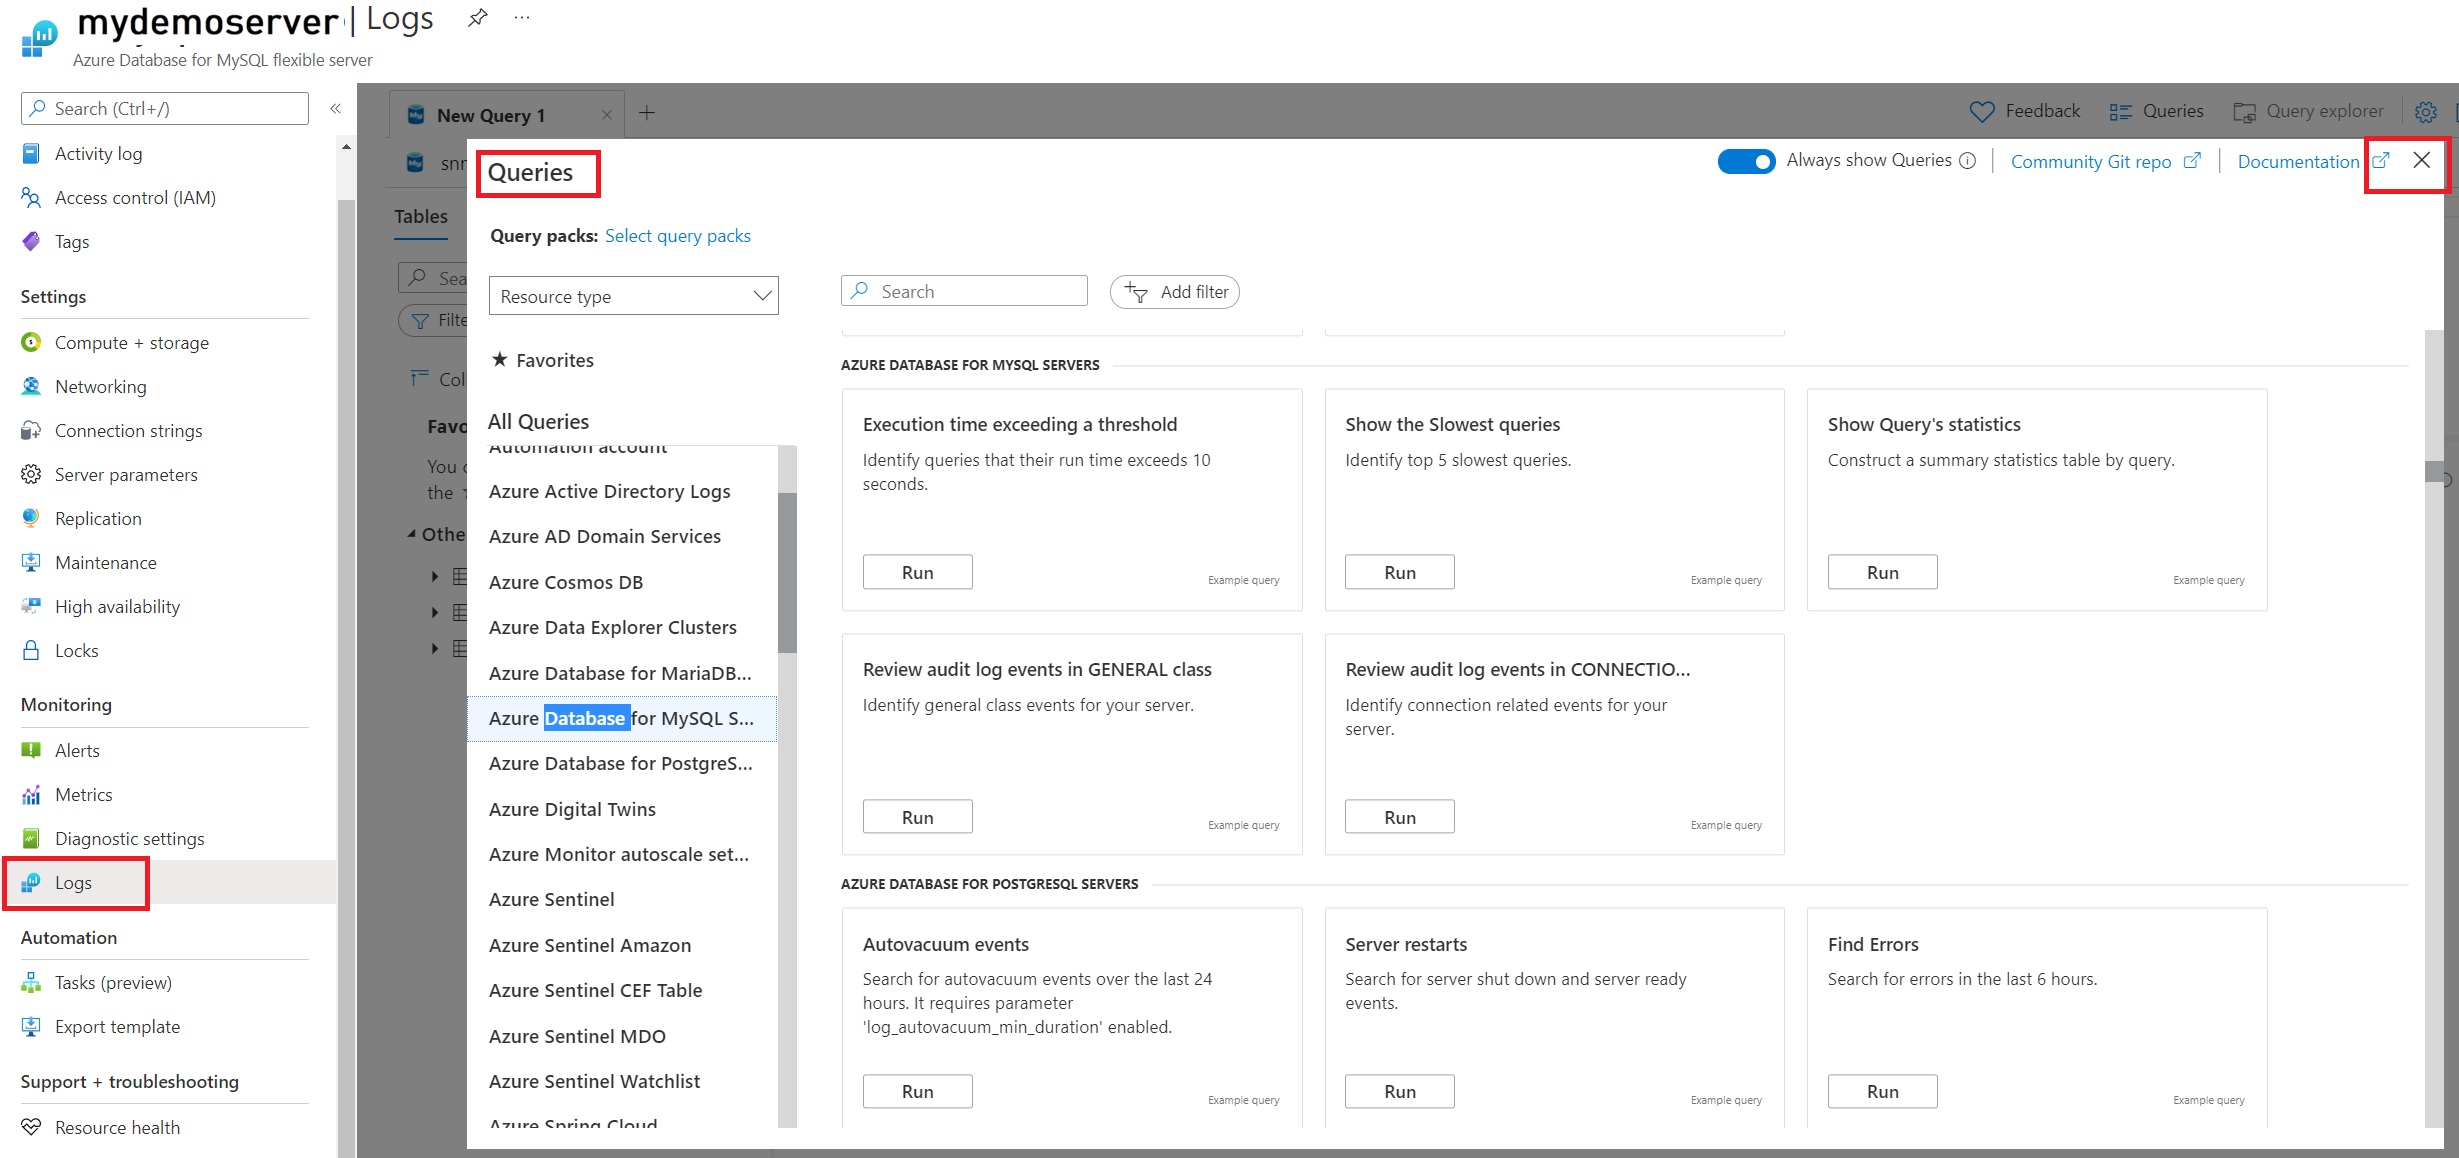
In Log Analytics, on the left pane, under Monitoring, select Logs.
Close the Queries window that opens.
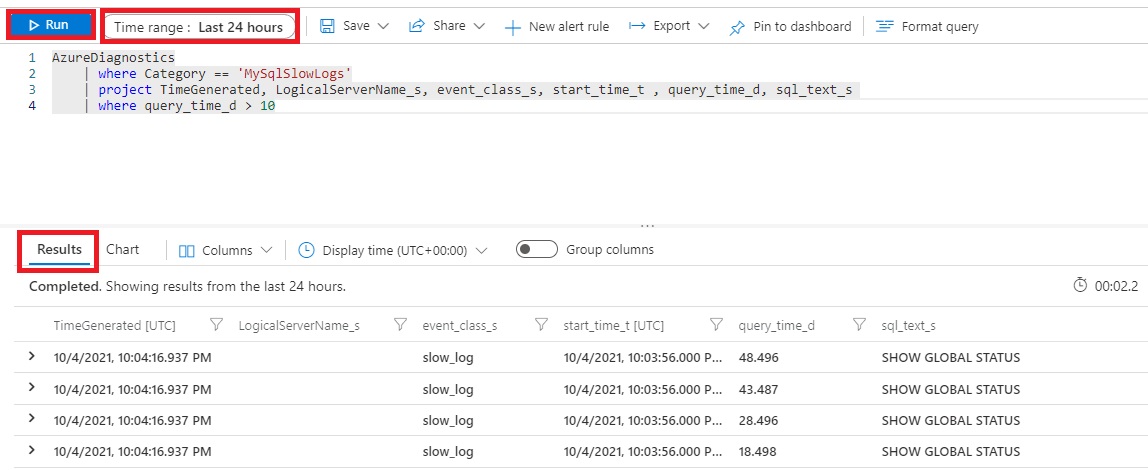
In the query window, you can write the query to be executed. To find queries longer than 10 seconds on a particular server, we've used the following code:
AzureDiagnostics
   | where Category == 'MySqlSlowLogs'
   | project TimeGenerated, LogicalServerName_s, event_class_s, start_time_t , query_time_d, sql_text_s
   | where query_time_d > 10
Select the Time range, and then run the query. The results are displayed in the following image:
View query insights by using workbooks
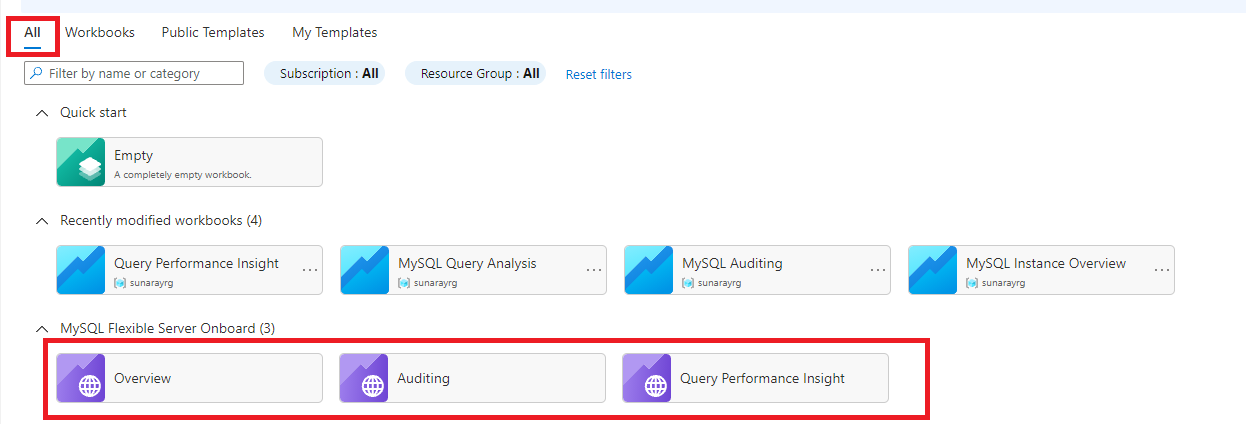
In the Azure portal, on the left pane, under Monitoring for your Azure Database for MySQL Flexible Server instance, select Workbooks.
Select the Query Performance Insight template.

In the workbook, you can view the following visualizations:
- Query Load
- Total Active Connections
- Slow Query Trend (>10 Sec Query Time)
- Slow Query Details
- List top 5 longest queries
- Summarize slow queries by minimum, maximum, average, and standard deviation query time

Note
- To view resource utilization, you can use the Overview template.
- You can also edit these templates and customize them according to your requirements. For more information, see Azure Workbooks.
- For a quick view, you can also pin the workbooks or Log Analytics query to your Dashboard. For more information, see Create a dashboard in the Azure portal.
In Query Performance Insight, two metrics that can help you find potential bottlenecks are duration and execution count. Long-running queries have the greatest potential for locking resources longer, blocking other users, and limiting scalability.
In some cases, a high execution count can lead to more network round trips. Round trips affect performance. They're subject to network latency and downstream server latency. So execution count can help to find frequently executed ("chatty") queries. These queries are the best candidates for optimization.