Note
Access to this page requires authorization. You can try signing in or changing directories.
Access to this page requires authorization. You can try changing directories.
Azure Private 5G Core offers a distributed tracing web GUI, which you can use to collect detailed traces for signaling flows involving packet core instances. You can use traces to diagnose many common configuration, network, and interoperability problems affecting user service.
Access the distributed tracing web GUI
Tip
When signing in, if you see a warning in your browser that the connection isn't secure, you may be using a self-signed certificate to attest access to your local monitoring tools. We recommend following Modify the local access configuration in a site to configure a custom HTTPS certificate signed by a globally known and trusted certificate authority.
Microsoft Entra ID
To sign in to the distributed tracing web GUI if you enabled Microsoft Entra authentication:
- In your browser, enter https://<local monitoring domain>/sas, where <local monitoring domain> is the domain name for your local monitoring tools that you set up in Configure domain system name (DNS) for local monitoring IP.
- Follow the prompts to sign in with your account credentials.
Local username and password
To sign in to the distributed tracing web GUI if you enabled local username and password authentication:
In your browser, enter https://<local monitoring IP>/sas, where <local monitoring IP> is the IP address for accessing the local monitoring tools that you set up in Management network.
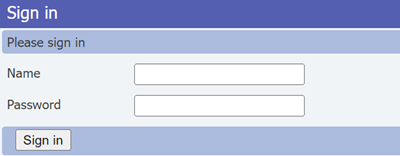
Sign in using your credentials.
If you're accessing the distributed tracing web GUI for the first time after installing or upgrading the packet core instance, you should fill in the fields with the default username and password. Afterwards, follow the prompts to set up a new password that you will use from the next time you sign in.
- Name: admin
- Password: packetCoreAdmin
Once you're signed in to the distributed tracing web GUI, you can use the top-level menu to sign out or change your credentials. Select Logout to end your current session, and Change Password to update your password.
Search for specific information
The distributed tracing web GUI provides two search tabs to allow you to search for diagnostics.
If you can't see the Search heading, select the Search button in the top-level menu.
SUPI - Allows you to search for activity involving a particular subscriber using their subscription permanent identifier (SUPI) or, in 4G networks, their international mobile subscriber identity (IMSI). This tab also provides an Errors panel, which allows you to filter the results by error condition. To search for activity for a particular subscriber, enter all of the initial digits of the subscriber's SUPI or IMSI into the text box on the SUPI search panel.
Errors - Allows you to search for error condition occurrences across all subscribers. To search for occurrences of error conditions across all subscribers, select the Errors tab and then use the drop-down menus on the Error panel to select an error category and, optionally, a specific error.
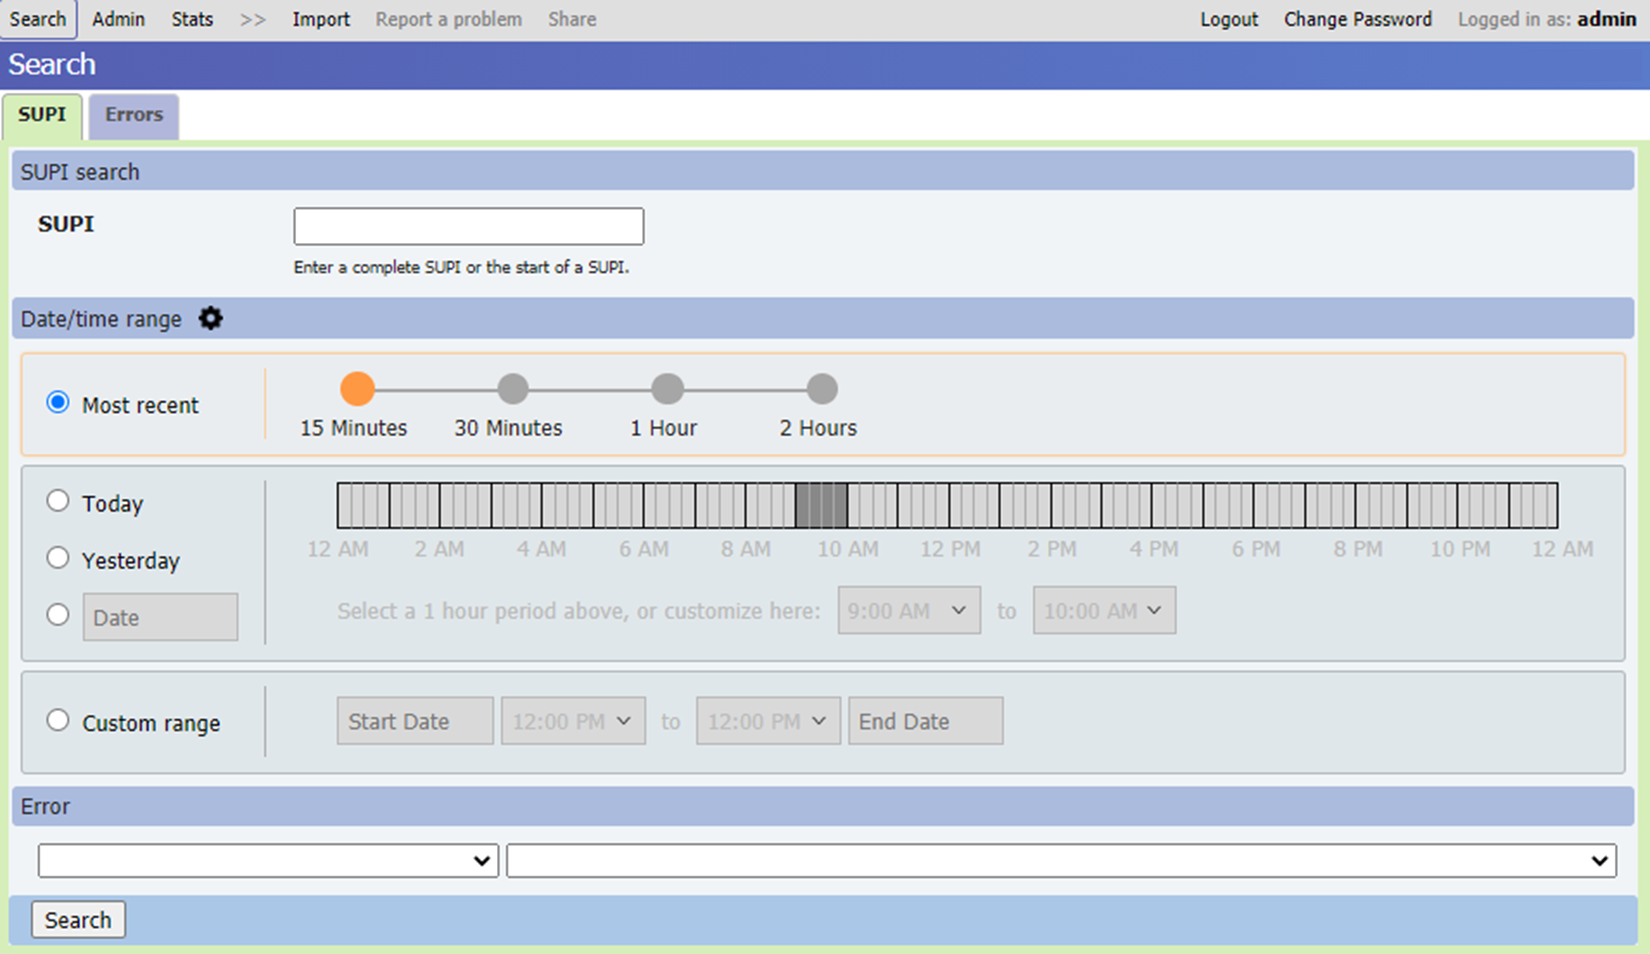
Both tabs also provide a Date/time range panel that allows you to specify a custom time window in which to search for diagnostics data. You can specify this time window in several ways.
- Select Most recent and choose an option to search for records from the most recent 15 minutes, 30 minutes, 1 hour, or 2 hours.
- Select Today, Yesterday, or a specific date, then select an hour-long range on the specified date by selecting the ribbon.
- Select Custom range, then specify the dates and times for the start and end of the search period. Custom ranges allow you to specify a search period that spans consecutive days.
Long search ranges result in slower searches, so it's recommended that you keep the search range to an hour or less if possible.
Tip
You can select the cog icon next to the Date/time range heading to customize the date and time format, default search period, and time zone according to your preferences.
Once you’ve entered your chosen search parameters, select Search. The following image shows an example of the results returned for a search on a particular SUPI.
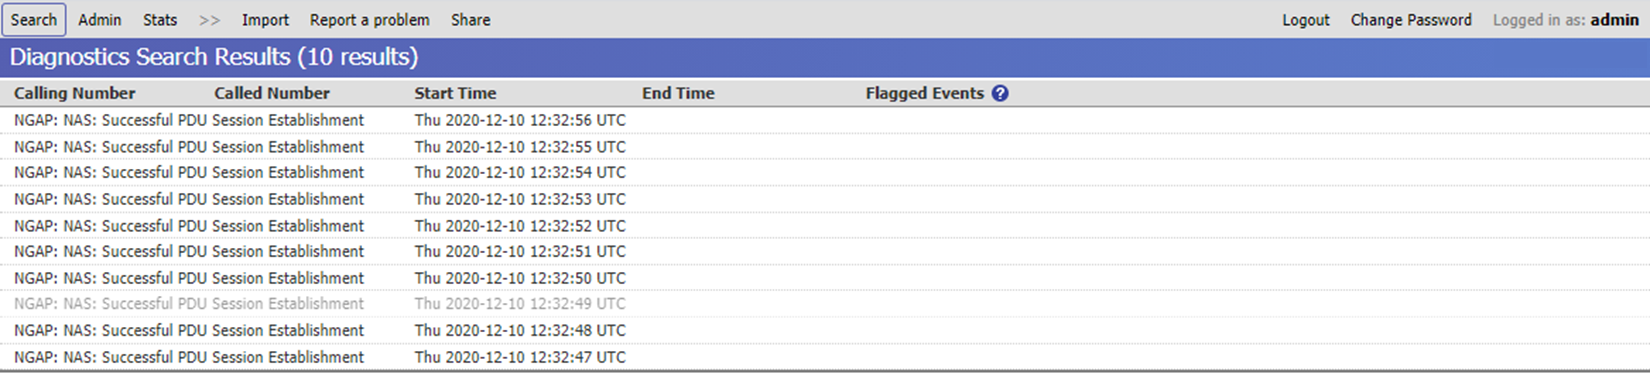
You can select an entry in the search results to view detailed information for that call flow or error.
View diagnostics details
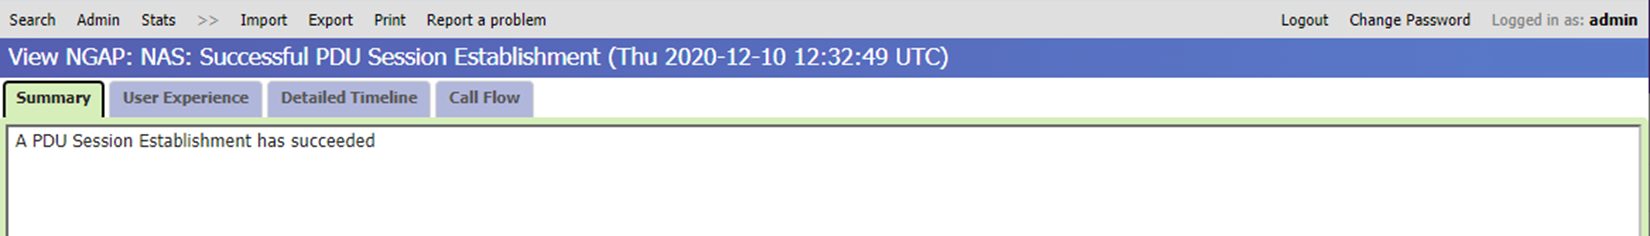
When you select a specific result, the display shows the following tabs containing different categories of information.
Note
In addition to the tabs described below, the distributed tracing web GUI also includes a User Experience tab. This tab is not used by Azure Private 5G Core and will not display any information.
Summary view
The Summary view displays a description of the flow or error.
Detailed Timeline view
The Detailed Timeline view shows the sequence of operations and events that occurred during the flow or error.

Each entry in the list shows summary information for a specific event that occurred during the flow or error. Each entry includes the date and time at which the event occurred and the name of the component on which it occurred. When you select a specific entry in this list, the panel at the bottom of the screen provides more detail about the selected event.
The Events to be viewed drop-down list allows you to control the level of events that are included in the list. You can choose from the following levels:
- High level events - the lowest level of detail, with a one-line summary of each event.
- High level events and protocol flows - includes the same information as for High level events, but adds details of the contents of network protocol messages involved at each stage.
- Detailed events - includes the network protocol messages and more fine-grained detail of events.
- Engineering level events - provides a detailed listing of internal events, typically for use by Microsoft personnel.
Call Flow view
The Call Flow view shows the sequence of messages flowing between components during the course of the flow or error.

The vertical lines in the diagram show the network components involved in the flow.
- Black lines indicate packet core Network Functions that have logged sending or receiving messages for this flow.
- Gray lines indicate other components that don't log messages.
You can customize the view by showing or hiding individual columns and giving them more descriptive display names. To view these options, select the current column name and then select the + (plus) sign that appears to the right of it to open a dropdown menu. Additionally, you can select multiple columns by holding down the Ctrl key as you select each column; the + (plus) sign remains next to the latest column that you selected.
- The Remove this column option hides the currently select column from view.
- The Remove other columns option hides all columns that don't include messages flowing to or from the selected column.
- The Group columns option allows you to combine several columns into a single column.
- The Ungroup columns option allows you to revert the Group columns option.
- The Show messages within group option shows any messages between group members as arrows that loop back on themselves to their originating column.
- The Set annotation option allows you to enter a new display name for the column.
You can revert to the default display options using the Options menu. You can access this menu by selecting the white cogwheel on a blue background at the upper-right corner of the view window. You can take the following actions:
- Choose Colors, styles and annotations -> Revert to default to clear your custom display names.
- Choose Visibility -> Show all to restore columns you've previously hidden from view.
- Choose Column grouping -> Ungroup all to separate columns you've previously grouped.
A horizontal line in the diagram shows each individual signaling message flowing between two network components. An arrow indicates the direction of flow from the sending to the receiving component.
- A double line indicates that the message was logged by both the sending and receiving components.
- A single line indicates that the message was logged by only one of these components, because the other component doesn't log messages.
- A line that is half double and half single, with an X symbol at the midpoint, indicates one of the following:
- The message should have been logged by both components but was logged by only one of them. For example, this occurs if a message is logged by the sending component but is then lost in transit and never reaches the receiving component.
- The message crossed with another message in the diagram while in transit, and so was received out of order.
- The messages were logged in the wrong order. This doesn't indicate a problem with your deployment; it can happen because of network latency in communications.
- A retransmitted message appears as a separate line for each retransmission.
- A looped line that returns to the same column indicates a message between group members.
Different colors and line styles (dashed, dotted, and so on) for horizontal lines are used to distinguish between different call legs.
The messages appear in the diagram in the order in which they occurred. An axis break on all of the vertical lines in the diagram between two consecutive messages indicates a gap of 10 seconds or more occurred between these two messages.
If the call flow diagram is too large to fit in the browser window, you can use the vertical and horizontal scrollbars to move around the display.
View help information
To view help information, select the Options symbol in the upper-right corner and choose Help. The help information appears in a panel at the bottom of the display. To hide this panel, select the X symbol at the upper-right corner of the panel.