Note
Access to this page requires authorization. You can try signing in or changing directories.
Access to this page requires authorization. You can try changing directories.
Important
Custom detections is now the best way to create new rules across Microsoft Sentinel SIEM Microsoft Defender XDR. With custom detections, you can reduce ingestion costs, get unlimited real-time detections, and benefit from seamless integration with Defender XDR data, functions, and remediation actions with automatic entity mapping. For more information, read this blog.
While Microsoft Sentinel can ingest data from various sources, ingestion time for each data source may differ in different circumstances.
This article describes how ingestion delay might impact your scheduled analytics rules and how you can fix them to cover these gaps.
Why delay is significant
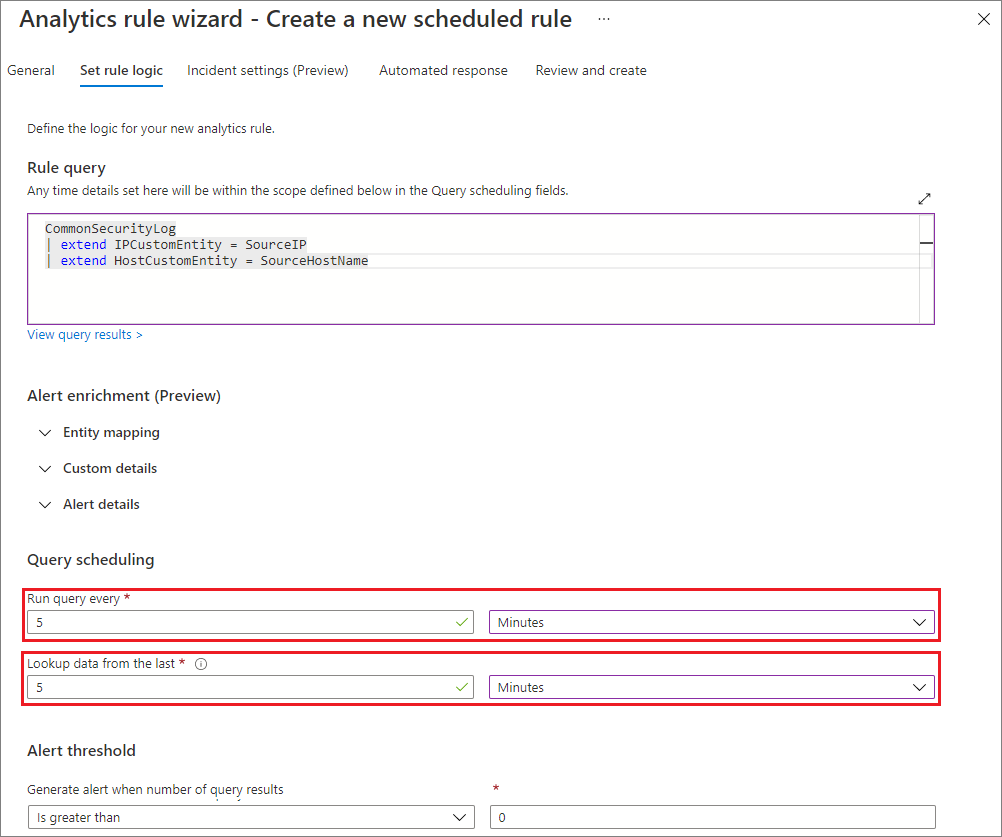
For example, you might write a custom detection rule, setting the Run query every and Lookup data from the last fields to have the rule run every five minutes, looking up data from those last five minutes:

The Lookup data from the last field defines a setting known as a look-back period. Ideally, when there's no delay, this detection misses no events, as shown in the following diagram:

The event arrives as it's generated, and is included in the lookback period.
Now, assume there's some delay for your data source. For this example, let's say the event was ingested two minutes after it was generated. The delay is two minutes:

The event is generated within the first look-back period, but isn't ingested in your Microsoft Sentinel workspace on the first run. The next time the scheduled query runs, it ingests the event, but the time-generated filter removes the event because it happened more than five minutes ago. In this case, the rule does not fire an alert.
How to handle delay
Note
You can either solve the issue using the process described below, or implement Microsoft Sentinel's near-real-time detection (NRT) rules. For more information, see Detect threats quickly with near-real-time (NRT) analytics rules in Microsoft Sentinel.
To solve the issue, you need to know the delay for your data type. For this example, you already know the delay is two minutes.
For your own data, you can understand delay using the Kusto ingestion_time() function, and calculating the difference between TimeGenerated and the ingestion time. For more information, see Calculate ingestion delay.
After determining the delay, you can address the problem as follows:
Increase the look-back period. Basic intuition tells you that increasing the look-back period size will help. Since your look-back period is five minutes and your delay is two minutes, setting the look-back period to seven minutes will help address this problem. For example, in your rule settings:

The following diagram shows how the look-pack period now contains the missed event:

Handle duplication. Only increasing the look-back period can create duplication, because the look-back windows now overlap. For example, a different event may look as shown in the following diagram:

Since the event TimeGenerated value is found in both look-back periods, the event fires two alerts. You need to find a way to solve the duplication.
Associate the event to a specific look-back period. In the first example, you missed events because your data wasn't ingested when the scheduled query ran. You extended the look-back to include the event, but this caused duplication. You have to associate the event to the window you extended to contain it.
Do this by setting
ingestion_time() > ago(5m), instead of the original rulelook-back = 5m. This setting associates the event to the first look-back window. For example:
The ingestion time restriction now trims the extra two minutes you added to the look-back period. And for the first example, the second run look-back period now captures the event:

The following sample query summarizes the solution for solving ingestion delay issues:
let ingestion_delay = 2min;
let rule_look_back = 5min;
CommonSecurityLog
| where TimeGenerated >= ago(ingestion_delay + rule_look_back)
| where ingestion_time() > ago(rule_look_back)
See more information on the following items used in the preceding example, in the Kusto documentation:
Calculate ingestion delay
By default, Microsoft Sentinel scheduled alert rules are configured to have a 5-minute look-back period. However, each data source may have its own, individual ingestion delay. When joining multiple data types, you must understand the different delays for each data type in order to configure the look-back period correctly.
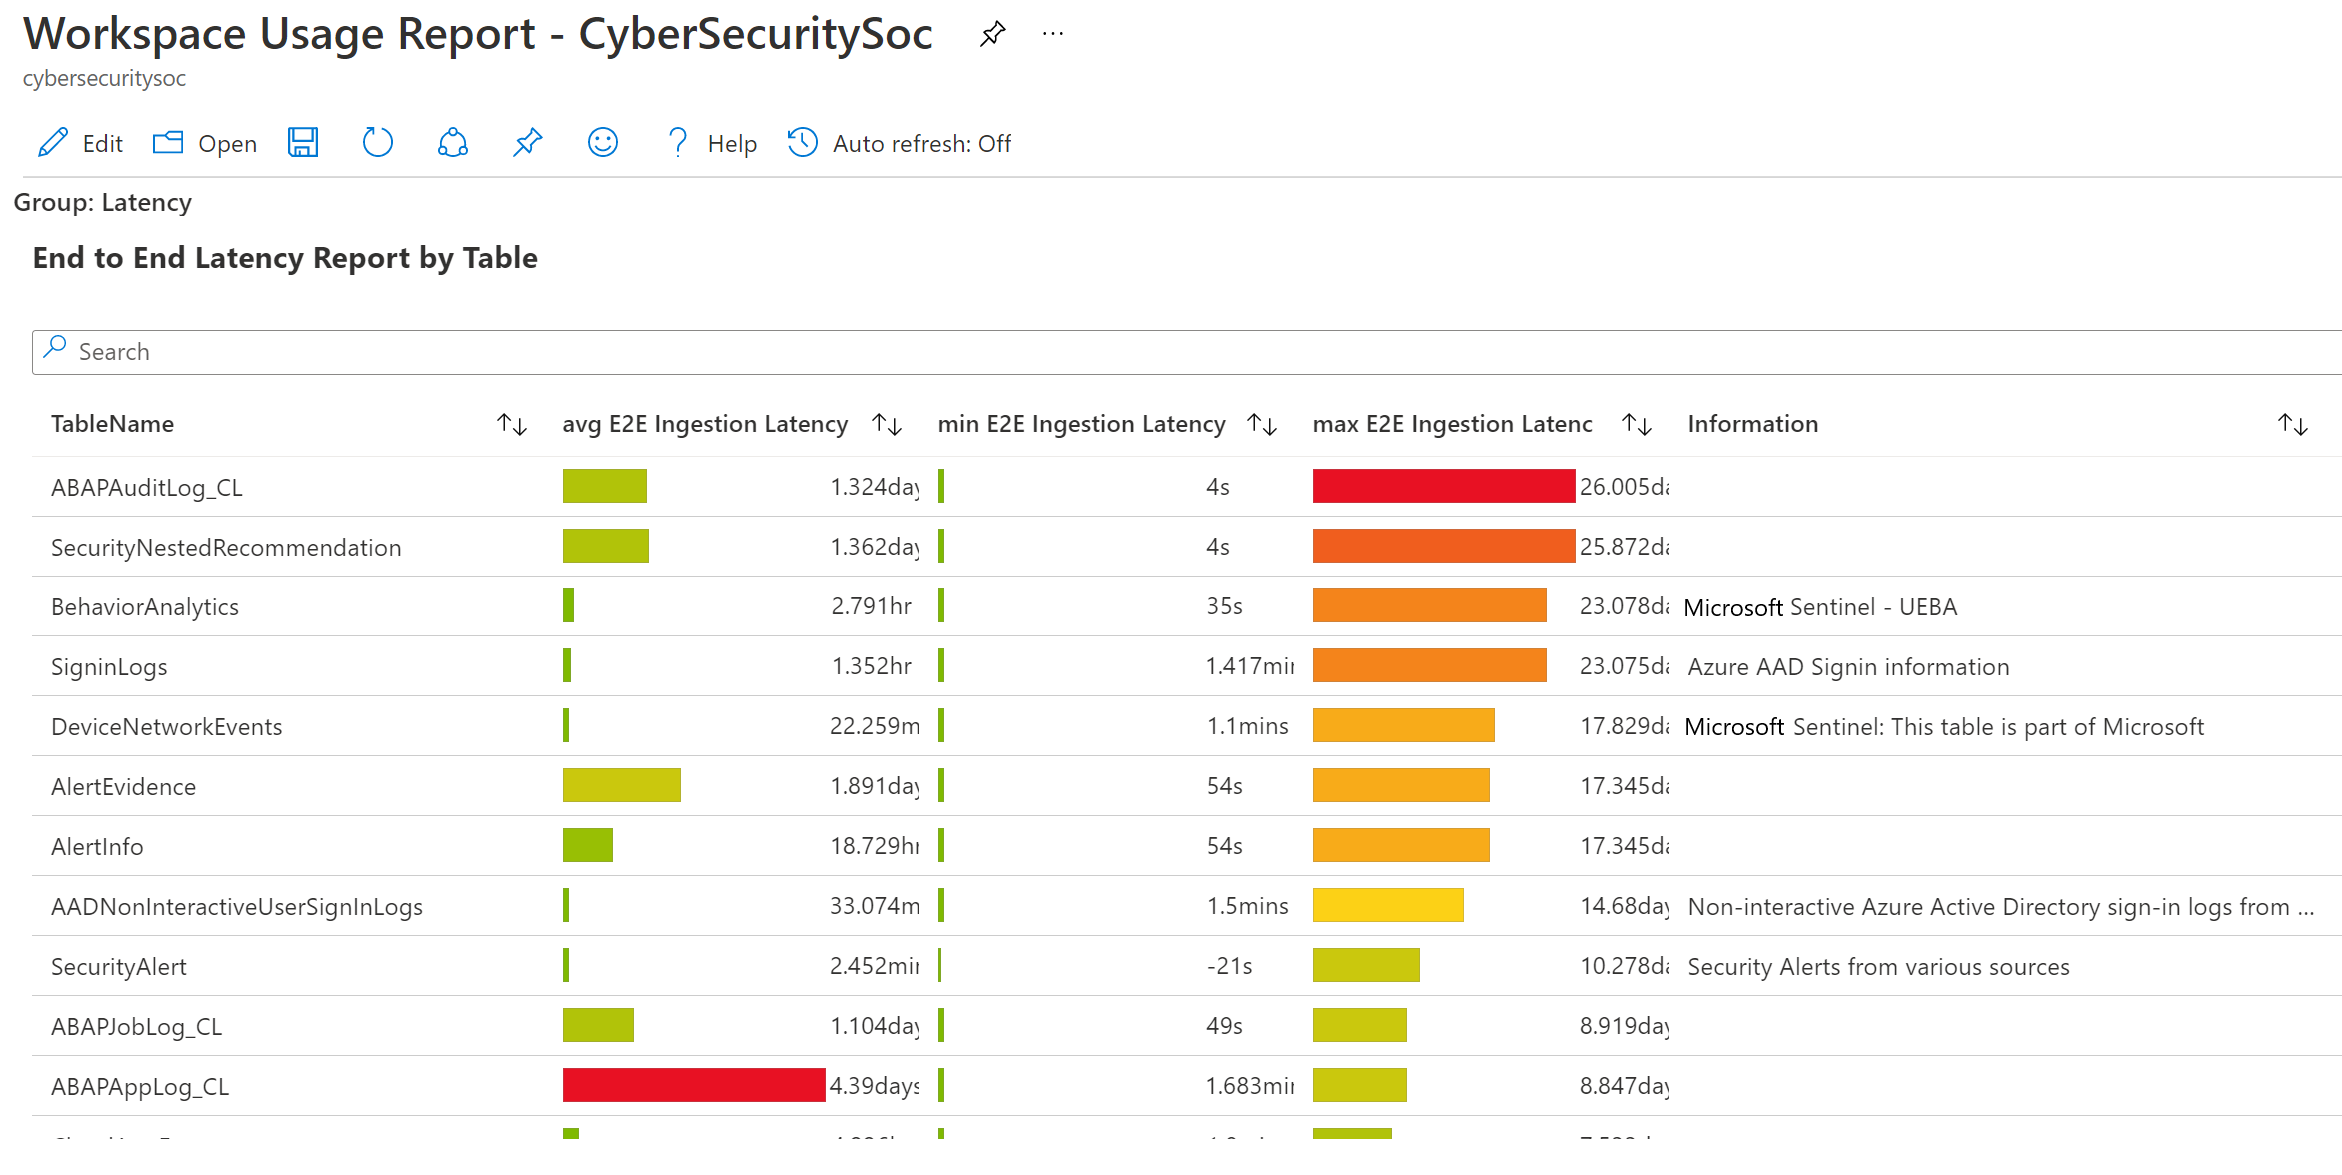
The Workspace Usage Report, provided in Microsoft Sentinel out-of-the-box, includes a dashboard that shows latency and delays for the different data types flowing into your workspace.
For example:

Next steps
For more information, see: